Skip to content

Grafana

252 Themen 4.4k Beiträge

NEWS

  • Sehr große Zahlen

    19
    0 Stimmen
    19 Beiträge
    929 Aufrufe
    M
    Danke! Blockly geht schon mal.
  • Grafana Energiedashboard

    Verschoben
    8
    1
    0 Stimmen
    8 Beiträge
    769 Aufrufe
    W
    @icegixxe So wären die Einstellungen bei den Overrides für das Stacking. Bei mir funktioniert das einwandfrei. [image: 1718725255223-screenshot-2024-06-18-173743.png]
  • Grafana Influx tägliche Wertedarstellung

    Verschoben
    4
    1
    0 Stimmen
    4 Beiträge
    308 Aufrufe
    T
    @homoran vielen Dank, ich sitze nämlich an einem ähnlichen Problem. Habe einen PV Speicher und möchte die täglichen min und Max Werte gerne in einer Visualisierung anzeigen lassen. Aber egal ob ich nun 24h oder 1d anzeigen lasse, er zeigt es nicht korrekt an und zeigt die Werte an, die bei der Abfrage 24h her sind. Ich möchte ungern, eine weitere Messung für diesen Zweck abspeichern müssen.
  • Grafana > transparenter Hintergrund

    hintergund
    13
    1
    0 Stimmen
    13 Beiträge
    1k Aufrufe
    HomoranH
    @agrippinenser sagte in Grafana > transparenter Hintergrund: Feinstaub: dieses > HmIP-SFD ja! (als Bausatz) @agrippinenser sagte in Grafana > transparenter Hintergrund: Wetter: HmIP-SWO-B oder sogar HmIP-SWO-PR ? weder noch! Sondern eine 12 Jahre alte HomeMatic Wetterstation.
  • 2 unterschiedliche Werte in einer Visualisierung

    1
    1
    0 Stimmen
    1 Beiträge
    167 Aufrufe
    Niemand hat geantwortet
  • [gelöst] Grafana Alert um Datenpunkt zu ändern

    grafana
    6
    0 Stimmen
    6 Beiträge
    464 Aufrufe
    B
    Problem gefunden: In den sogenanntem Label des Alerts müssen Variablen eingetragen werden: zb. Router = Asus Diese Variablen müssen dann in den Benachrichtigungsrichtlinien unter "New nested policy" ebenfalls eingetragen werden. [image: 1718449374971-unbenannt1.jpg] [image: 1718449364651-unbenannt.jpg] Trotzdem herzlichen Dank!
  • Messdaten aus Influx in Sonnenanzeige Dashboard darstellen

    Verschoben
    12
    0 Stimmen
    12 Beiträge
    995 Aufrufe
    icebearI
    @domm Also ich hab jetzt noch zweimal drübergelesen, aber ich hab immernoch nicht wirklich verstanden wo dein Problem liegt. Vielleicht solltest du mal ein Bild vom Grafana Dashboard zeigen und was du genau machen möchtest. Wenn du schreibst du hast alle DP vorliegen und schreibst diese auch in die InfluxDB, dann mußt du die doch nur noch abfragen, bzw eine vorhandene Abfrage anpassen. Dann in Grafana das Dashboard aufrufen und eine neue Visualisierung hinzufügen.
  • Grafana, Summierung der letzten Tageswerte

    Verschoben
    2
    1
    0 Stimmen
    2 Beiträge
    337 Aufrufe
    Marc BergM
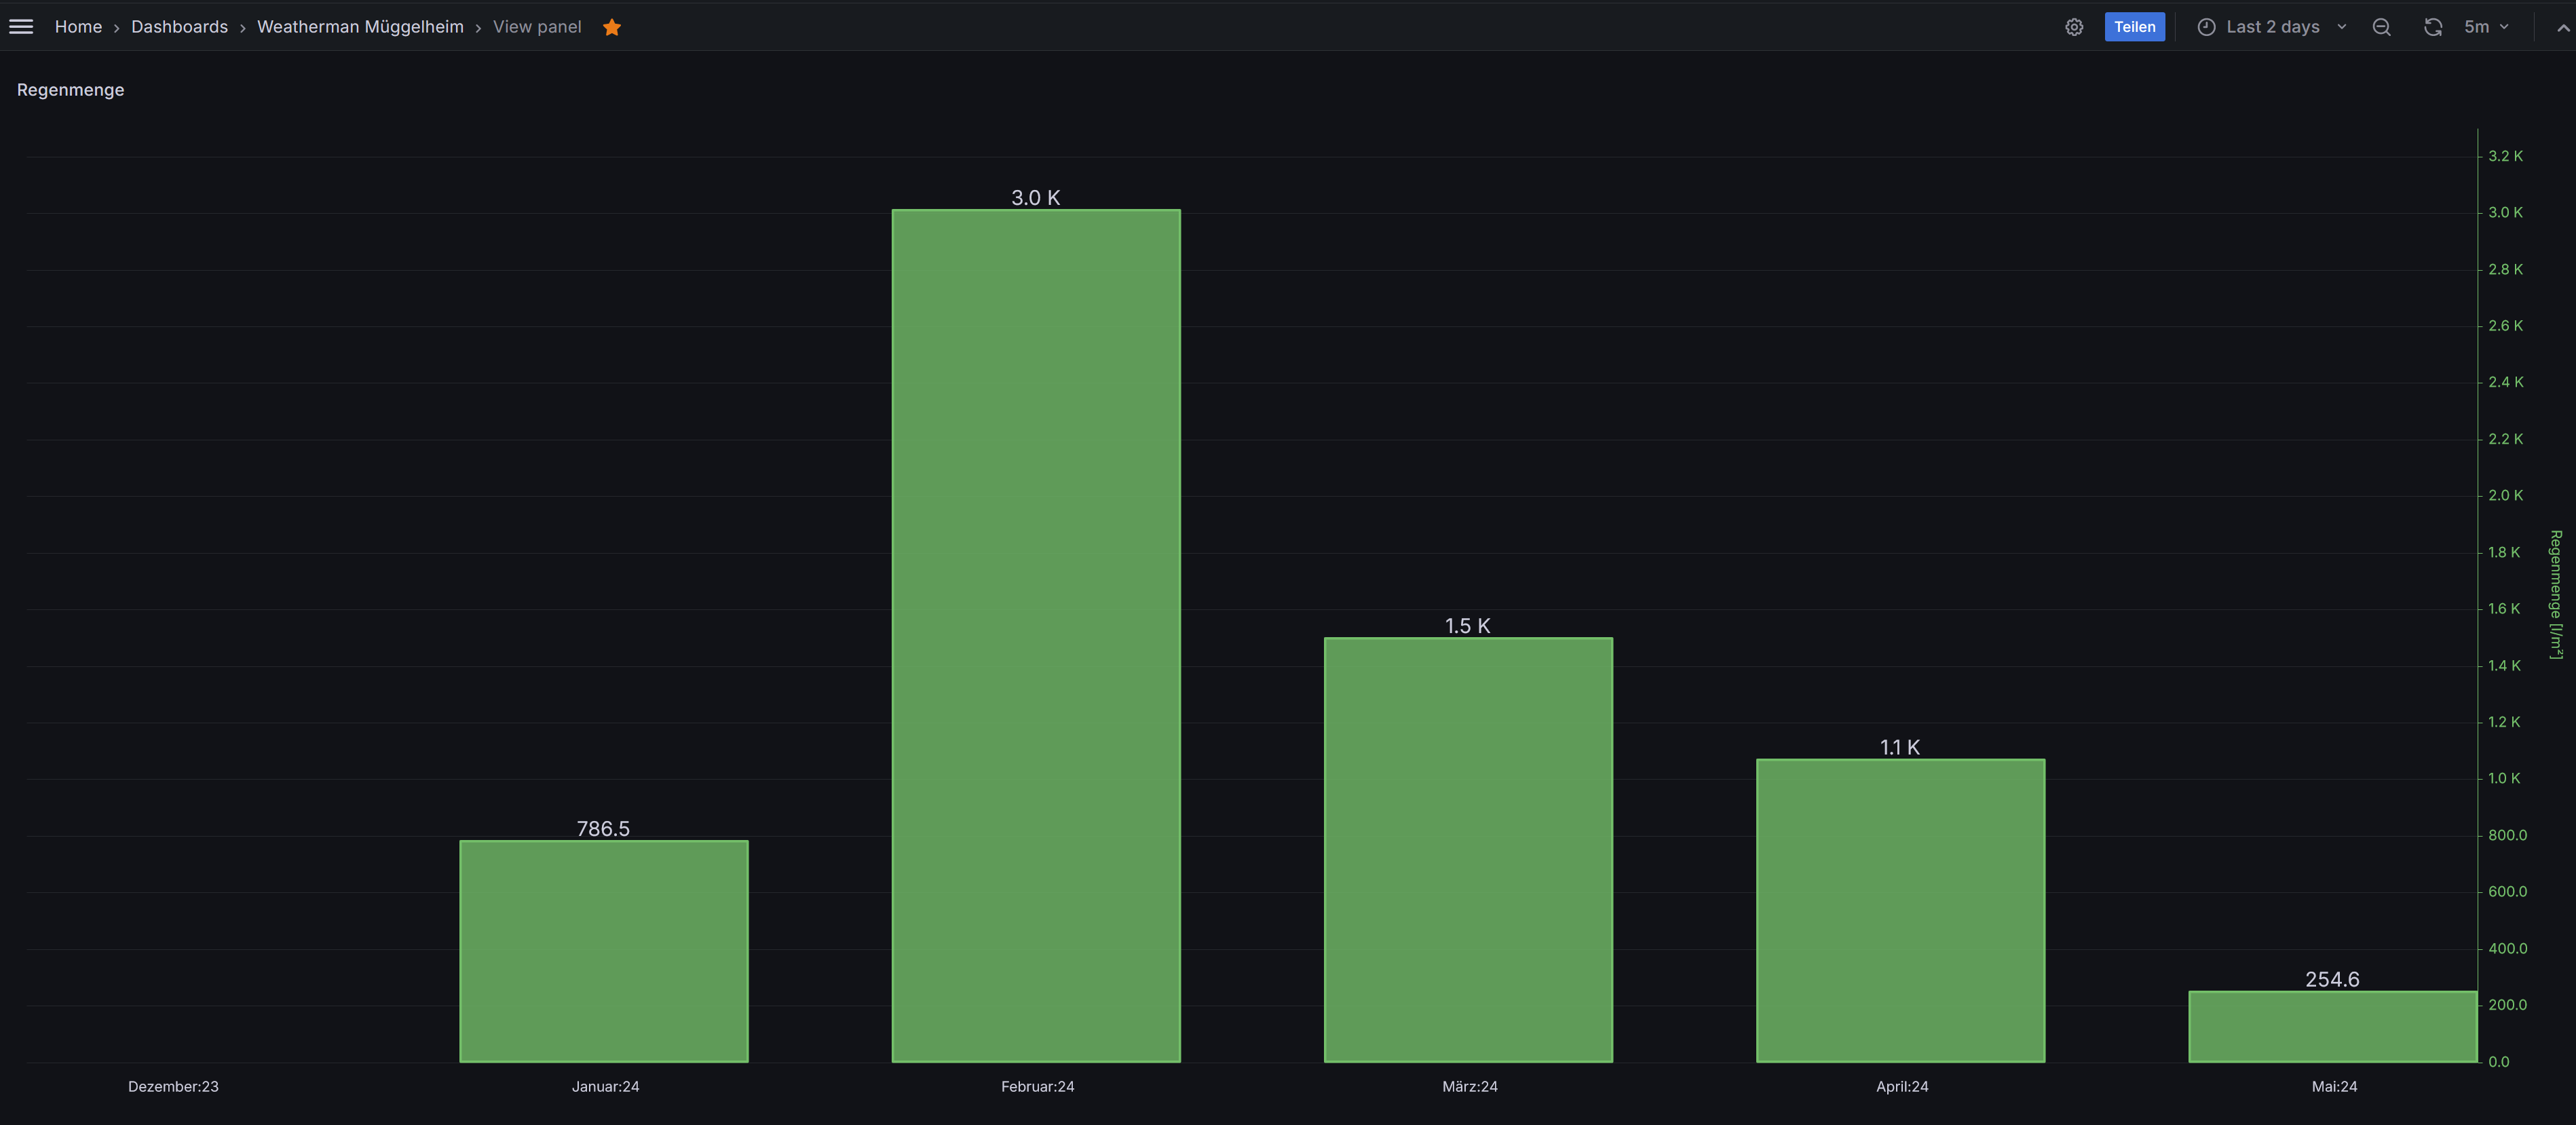
    @andi_grafa sagte in Grafana, Summierung der letzten Tageswerte: Wie du schon richtig selbst festgestellt hast, summierst du stumpf ALLE Werte. Stattdessen willst du ja nur den jeweilig letzten Wert des Tages nehmen und den im Monat summieren. Das bedeutet, dass du noch ein zusätzliches "aggregateWindow" benötigt, mit dem du den Tages"letzt"wert ermittelst. Versuchs mal so: import "timezone" import "date" option location = timezone.location(name: "Europe/Berlin") from(bucket: "iobroker") |> range(start: date.truncate(t: date.add(d: -6mo, to: today()), unit: 1mo), stop: date.truncate(t: today(), unit: 1mo)) |> filter(fn: (r) => r["_measurement"] == "Regen heute") |> filter(fn: (r) => r["_field"] == "value") |> aggregateWindow(every: 1d, fn: last, createEmpty: true, timeSrc: "_start") |> aggregateWindow(every: 1mo, fn: sum, createEmpty: true, timeSrc: "_start")
  • Gelöst: Reste alter Installationen löschen

    Verschoben
    5
    0 Stimmen
    5 Beiträge
    270 Aufrufe
    M
    @meister-mopper Danke :+1:
  • Grafana.ini datei ändert sich nicht? "Gelöst"

    Verschoben grafana.ini
    5
    2
    0 Stimmen
    5 Beiträge
    277 Aufrufe
    D
    @crunchip vielen dank, das hätte ich nie gefunden.
  • Tagesverbrauch - Ich komm nicht drauf

    2
    0 Stimmen
    2 Beiträge
    223 Aufrufe
    haus-automatisierungH
    @mere13 sagte in Tagesverbrauch - Ich komm nicht drauf: |> aggregateWindow(every: 24h, fn: last, timeSrc: "_start", createEmpty: false) Würde stattdessen mal every: 1d testen. Sonst werden wahrscheinlich immer nur 24 Stunden genommen und die Tagesgrenze ignoriert. Ich würde vor dem aggregateWindow die Differenz bilden und dann sum aller Differenzen anwenden. import "timezone" option location = timezone.location(name: "Europe/Berlin") from(bucket: "homebucket") |> range(start: -10d) |> filter(fn: (r) => r["_measurement"] == "mystrom energy since boot - WLAN" and r["_field"] == "value") |> difference(nonNegative: true, columns: ["_value"]) |> aggregateWindow(every: 1d, fn: sum, timeSrc: "_start", createEmpty: false) |> map(fn: (r) => ({r with _value: r._value / 3600.0})) |> yield(name: "last")
  • Grafana Wert nur als Text

    4
    2
    0 Stimmen
    4 Beiträge
    315 Aufrufe
    HomoranH
    siehe hier: https://forum.iobroker.net/post/1166370
  • Ist Grafana kostenlos?

    Verschoben
    12
    0 Stimmen
    12 Beiträge
    1k Aufrufe
    U
    @udbruegg Ich hab es ! Entschuldigt diese halbgare Aktion. Ich war echt etwas in Panik, weil ich da echt schon einige Tage Arbeit drin habe. Es war das einfache einloggen. Ich hatte nur was mit den Passwörtern "damals" nicht eindeutig dokumentiert und war nun total auf dem irrem Holzweg. Sorry... Ist mir echt etwas peinlich, dass ich bei so einer einfachen Sache, so panisch in die falsche Richtung gerannt bin.
  • smartmeterreader und JSON, wie Verbrauch summieren?

    1
    0 Stimmen
    1 Beiträge
    138 Aufrufe
    Niemand hat geantwortet
  • Daten aus dem Influxbd falsch dargestellt in Grafana

    10
    0 Stimmen
    10 Beiträge
    592 Aufrufe
    LongbowL
    Danke für die Unterstützung, da bei dem Datenpunkt keine ständigen Daten kommen, geht das so. Hab bei einem anderen, der ständig die Wertewechsel, da geht das so nicht. Daher erst mal Dankeschön, hier war es genau das richtig, was Ihr mir gesagt habt.
  • daten von pv forecast / in die zukunft blicken

    13
    0 Stimmen
    13 Beiträge
    883 Aufrufe
    T
    @luckyheiko [image: 1715175374941-c3f6fee3-33b6-432b-95d3-cd097e8949ef-image.png] Fertig! Naja, der grobe Entwurf. Wichtig ist, dass die Werte mit >Influx1.8 vorliegen. mit folgender Syntax kannst du die Daten umbiegen: from(bucket: "Solar") |> range(start: 12h, stop: 36h) |> timeShift (duration: -48h) |> filter(fn: (r) => r["_measurement"] == "pvforecast.0.plants.westseiteEigen.power") |> filter(fn: (r) => r["_field"] == "value") |> aggregateWindow(every: v.windowPeriod, fn: mean, createEmpty: false) |> yield(name: "mean") Das wäre der Befehl für die Werte morgen (Graue Linie) from(bucket: "Solar") |> range(start: -12h, stop: 12h) |> timeShift (duration: -24h) |> filter(fn: (r) => r["_measurement"] == "pvforecast.0.plants.westseiteEigen.power") |> filter(fn: (r) => r["_field"] == "value") |> aggregateWindow(every: v.windowPeriod, fn: mean, createEmpty: false) |> yield(name: "mean") Das wäre der Befehl für die Werte heute (Farbige Fläche) Die nervöse Linie ist der aktuelle Ertrag der PV Anlaga
  • Tagesverbrauch Wasser

    19
    0 Stimmen
    19 Beiträge
    1k Aufrufe
    crunchipC
    @fk757 hier mal ein Dashboard zum einfügen in Grafana, deinen Datenpunkt Gesamt musst du entsprechend einfügen. Spoiler { "__inputs": [ { "name": "DS_INFLUXDB", "label": "InfluxDB", "description": "", "type": "datasource", "pluginId": "influxdb", "pluginName": "InfluxDB" } ], "__elements": {}, "__requires": [ { "type": "panel", "id": "bargauge", "name": "Bar gauge", "version": "" }, { "type": "panel", "id": "gauge", "name": "Gauge", "version": "" }, { "type": "grafana", "id": "grafana", "name": "Grafana", "version": "10.0.3" }, { "type": "datasource", "id": "influxdb", "name": "InfluxDB", "version": "1.0.0" }, { "type": "panel", "id": "stat", "name": "Stat", "version": "" }, { "type": "panel", "id": "table", "name": "Table", "version": "" }, { "type": "panel", "id": "timeseries", "name": "Time series", "version": "" } ], "annotations": { "list": [ { "builtIn": 1, "datasource": { "type": "grafana", "uid": "-- Grafana --" }, "enable": true, "hide": true, "iconColor": "rgba(0, 211, 255, 1)", "name": "Annotations & Alerts", "target": { "limit": 100, "matchAny": false, "tags": [], "type": "dashboard" }, "type": "dashboard" } ] }, "description": "Wasserverbrauch", "editable": true, "fiscalYearStartMonth": 0, "graphTooltip": 0, "id": null, "links": [ { "asDropdown": true, "icon": "external link", "includeVars": true, "keepTime": true, "tags": [ "Hausenergie" ], "targetBlank": false, "title": "Hausenergie", "tooltip": "", "type": "dashboards", "url": "" } ], "liveNow": false, "panels": [ { "datasource": { "type": "influxdb", "uid": "${DS_INFLUXDB}" }, "fieldConfig": { "defaults": { "custom": { "align": "right", "cellOptions": { "type": "auto" }, "filterable": false, "inspect": false }, "decimals": 3, "mappings": [], "thresholds": { "mode": "absolute", "steps": [ { "color": "blue", "value": null }, { "color": "super-light-orange", "value": 0.1 }, { "color": "light-orange", "value": 0.2 }, { "color": "semi-dark-orange", "value": 0.4 }, { "color": "dark-red", "value": 0.8 } ] }, "unit": "m3" }, "overrides": [ { "matcher": { "id": "byName", "options": "Verbrauch" }, "properties": [ { "id": "custom.cellOptions", "value": { "mode": "gradient", "type": "gauge" } }, { "id": "custom.width", "value": 200 } ] }, { "matcher": { "id": "byName", "options": "Time" }, "properties": [ { "id": "unit", "value": "time:D.M.Y" }, { "id": "displayName", "value": "Tag" } ] } ] }, "gridPos": { "h": 29, "w": 5, "x": 0, "y": 0 }, "id": 4, "options": { "cellHeight": "sm", "footer": { "countRows": false, "fields": "", "reducer": [ "sum" ], "show": false }, "showHeader": true, "sortBy": [] }, "pluginVersion": "10.0.3", "targets": [ { "alias": "Verbrauch", "datasource": { "type": "influxdb", "uid": "${DS_INFLUXDB}" }, "groupBy": [ { "params": [ "1d" ], "type": "time" }, { "params": [ "previous" ], "type": "fill" } ], "measurement": "wiffi-wz.0.root.10_1_30_10.w_counter_3", "orderByTime": "ASC", "policy": "default", "refId": "A", "resultFormat": "time_series", "select": [ [ { "params": [ "value" ], "type": "field" }, { "params": [], "type": "last" }, { "params": [], "type": "difference" } ] ], "tags": [] } ], "timeFrom": "1M", "title": "Wasserverbrauch", "transformations": [ { "id": "sortBy", "options": { "fields": {}, "sort": [ { "desc": true, "field": "Time" } ] } } ], "transparent": true, "type": "table" }, { "datasource": { "type": "influxdb", "uid": "${DS_INFLUXDB}" }, "fieldConfig": { "defaults": { "color": { "mode": "thresholds" }, "decimals": 3, "mappings": [], "thresholds": { "mode": "absolute", "steps": [ { "color": "blue", "value": null }, { "color": "super-light-orange", "value": 3 }, { "color": "semi-dark-orange", "value": 6 }, { "color": "dark-orange", "value": 9 }, { "color": "dark-red", "value": 12 } ] }, "unit": "m3" }, "overrides": [] }, "gridPos": { "h": 6, "w": 8, "x": 5, "y": 0 }, "hideTimeOverride": true, "id": 6, "interval": "", "options": { "displayMode": "gradient", "minVizHeight": 10, "minVizWidth": 0, "orientation": "auto", "reduceOptions": { "calcs": [ "lastNotNull" ], "fields": "", "values": false }, "showUnfilled": true, "text": {}, "valueMode": "color" }, "pluginVersion": "10.0.3", "targets": [ { "alias": "Mo", "datasource": { "type": "influxdb", "uid": "${DS_INFLUXDB}" }, "groupBy": [ { "params": [ "$__interval" ], "type": "time" }, { "params": [ "null" ], "type": "fill" } ], "measurement": "sourceanalytix.0.wiffi-wz__0__root__10_1_30_10__w_counter_3.currentYear.consumed.currentWeek.01_Monday", "orderByTime": "ASC", "policy": "default", "refId": "A", "resultFormat": "time_series", "select": [ [ { "params": [ "value" ], "type": "field" }, { "params": [], "type": "mean" } ] ], "tags": [] }, { "alias": "Di", "datasource": { "type": "influxdb", "uid": "${DS_INFLUXDB}" }, "groupBy": [ { "params": [ "$__interval" ], "type": "time" }, { "params": [ "null" ], "type": "fill" } ], "measurement": "sourceanalytix.0.wiffi-wz__0__root__10_1_30_10__w_counter_3.currentYear.consumed.currentWeek.02_Tuesday", "orderByTime": "ASC", "policy": "default", "refId": "B", "resultFormat": "time_series", "select": [ [ { "params": [ "value" ], "type": "field" }, { "params": [], "type": "mean" } ] ], "tags": [] }, { "alias": "Mi", "datasource": { "type": "influxdb", "uid": "${DS_INFLUXDB}" }, "groupBy": [ { "params": [ "$__interval" ], "type": "time" }, { "params": [ "null" ], "type": "fill" } ], "measurement": "sourceanalytix.0.wiffi-wz__0__root__10_1_30_10__w_counter_3.currentYear.consumed.currentWeek.03_Wednesday", "orderByTime": "ASC", "policy": "default", "refId": "C", "resultFormat": "time_series", "select": [ [ { "params": [ "value" ], "type": "field" }, { "params": [], "type": "mean" } ] ], "tags": [] }, { "alias": "Do", "datasource": { "type": "influxdb", "uid": "${DS_INFLUXDB}" }, "groupBy": [ { "params": [ "$__interval" ], "type": "time" }, { "params": [ "null" ], "type": "fill" } ], "measurement": "sourceanalytix.0.wiffi-wz__0__root__10_1_30_10__w_counter_3.currentYear.consumed.currentWeek.04_Thursday", "orderByTime": "ASC", "policy": "default", "refId": "D", "resultFormat": "time_series", "select": [ [ { "params": [ "value" ], "type": "field" }, { "params": [], "type": "mean" } ] ], "tags": [] }, { "alias": "Fr", "datasource": { "type": "influxdb", "uid": "${DS_INFLUXDB}" }, "groupBy": [ { "params": [ "$__interval" ], "type": "time" }, { "params": [ "null" ], "type": "fill" } ], "measurement": "sourceanalytix.0.wiffi-wz__0__root__10_1_30_10__w_counter_3.currentYear.consumed.currentWeek.05_Friday", "orderByTime": "ASC", "policy": "default", "refId": "E", "resultFormat": "time_series", "select": [ [ { "params": [ "value" ], "type": "field" }, { "params": [], "type": "mean" } ] ], "tags": [] }, { "alias": "Sa", "datasource": { "type": "influxdb", "uid": "${DS_INFLUXDB}" }, "groupBy": [ { "params": [ "$__interval" ], "type": "time" }, { "params": [ "null" ], "type": "fill" } ], "measurement": "sourceanalytix.0.wiffi-wz__0__root__10_1_30_10__w_counter_3.currentYear.consumed.currentWeek.06_Saturday", "orderByTime": "ASC", "policy": "default", "refId": "F", "resultFormat": "time_series", "select": [ [ { "params": [ "value" ], "type": "field" }, { "params": [], "type": "mean" } ] ], "tags": [] }, { "alias": "So", "datasource": { "type": "influxdb", "uid": "${DS_INFLUXDB}" }, "groupBy": [ { "params": [ "$__interval" ], "type": "time" }, { "params": [ "null" ], "type": "fill" } ], "measurement": "sourceanalytix.0.wiffi-wz__0__root__10_1_30_10__w_counter_3.currentYear.consumed.currentWeek.07_Sunday", "orderByTime": "ASC", "policy": "default", "refId": "G", "resultFormat": "time_series", "select": [ [ { "params": [ "value" ], "type": "field" }, { "params": [], "type": "mean" } ] ], "tags": [] } ], "timeFrom": "7d", "title": "Tagesverbrauch", "transparent": true, "type": "bargauge" }, { "datasource": { "type": "influxdb", "uid": "${DS_INFLUXDB}" }, "fieldConfig": { "defaults": { "mappings": [], "thresholds": { "mode": "absolute", "steps": [ { "color": "green", "value": null }, { "color": "red", "value": 80 } ] }, "unit": "currencyEUR" }, "overrides": [] }, "gridPos": { "h": 4, "w": 3, "x": 13, "y": 0 }, "id": 10, "options": { "colorMode": "none", "graphMode": "area", "justifyMode": "auto", "orientation": "auto", "reduceOptions": { "calcs": [ "lastNotNull" ], "fields": "", "values": false }, "textMode": "auto" }, "pluginVersion": "10.0.3", "targets": [ { "datasource": { "type": "influxdb", "uid": "${DS_INFLUXDB}" }, "groupBy": [ { "params": [ "$__interval" ], "type": "time" }, { "params": [ "null" ], "type": "fill" } ], "measurement": "sourceanalytix.0.wiffi-wz__0__root__10_1_30_10__w_counter_3.currentYear.costs.02_currentWeek", "orderByTime": "ASC", "policy": "default", "refId": "A", "resultFormat": "time_series", "select": [ [ { "params": [ "value" ], "type": "field" }, { "params": [], "type": "mean" } ] ], "tags": [] } ], "title": "Woche", "type": "stat" }, { "datasource": { "type": "influxdb", "uid": "${DS_INFLUXDB}" }, "fieldConfig": { "defaults": { "mappings": [], "thresholds": { "mode": "absolute", "steps": [ { "color": "green", "value": null }, { "color": "orange", "value": 7 }, { "color": "red", "value": 9 } ] }, "unit": "currencyEUR" }, "overrides": [] }, "gridPos": { "h": 5, "w": 3, "x": 16, "y": 0 }, "id": 12, "options": { "orientation": "auto", "reduceOptions": { "calcs": [ "lastNotNull" ], "fields": "", "values": false }, "showThresholdLabels": false, "showThresholdMarkers": false }, "pluginVersion": "10.0.3", "targets": [ { "datasource": { "type": "influxdb", "uid": "${DS_INFLUXDB}" }, "groupBy": [ { "params": [ "$__interval" ], "type": "time" }, { "params": [ "null" ], "type": "fill" } ], "measurement": "sourceanalytix.0.wiffi-wz__0__root__10_1_30_10__w_counter_3.currentYear.costs.03_currentMonth", "orderByTime": "ASC", "policy": "default", "refId": "A", "resultFormat": "time_series", "select": [ [ { "params": [ "value" ], "type": "field" }, { "params": [], "type": "mean" } ] ], "tags": [] } ], "title": "Monat", "type": "gauge" }, { "datasource": { "type": "influxdb", "uid": "${DS_INFLUXDB}" }, "fieldConfig": { "defaults": { "mappings": [], "thresholds": { "mode": "absolute", "steps": [ { "color": "green", "value": null }, { "color": "red", "value": 80 } ] }, "unit": "currencyEUR" }, "overrides": [] }, "gridPos": { "h": 3, "w": 5, "x": 19, "y": 0 }, "id": 14, "options": { "colorMode": "none", "graphMode": "area", "justifyMode": "auto", "orientation": "auto", "reduceOptions": { "calcs": [ "lastNotNull" ], "fields": "", "values": false }, "textMode": "auto" }, "pluginVersion": "10.0.3", "targets": [ { "datasource": { "type": "influxdb", "uid": "${DS_INFLUXDB}" }, "groupBy": [ { "params": [ "$__interval" ], "type": "time" }, { "params": [ "null" ], "type": "fill" } ], "measurement": "sourceanalytix.0.wiffi-wz__0__root__10_1_30_10__w_counter_3.currentYear.costs.05_currentYear", "orderByTime": "ASC", "policy": "default", "refId": "A", "resultFormat": "time_series", "select": [ [ { "params": [ "value" ], "type": "field" }, { "params": [], "type": "mean" } ] ], "tags": [] } ], "title": "Jahr", "type": "stat" }, { "datasource": { "type": "influxdb", "uid": "${DS_INFLUXDB}" }, "fieldConfig": { "defaults": { "mappings": [], "thresholds": { "mode": "absolute", "steps": [ { "color": "green", "value": null }, { "color": "red", "value": 80 } ] }, "unit": "m³" }, "overrides": [] }, "gridPos": { "h": 2, "w": 5, "x": 19, "y": 3 }, "id": 16, "options": { "colorMode": "none", "graphMode": "none", "justifyMode": "auto", "orientation": "auto", "reduceOptions": { "calcs": [ "lastNotNull" ], "fields": "", "values": false }, "textMode": "auto" }, "pluginVersion": "10.0.3", "targets": [ { "datasource": { "type": "influxdb", "uid": "${DS_INFLUXDB}" }, "groupBy": [ { "params": [ "$__interval" ], "type": "time" }, { "params": [ "null" ], "type": "fill" } ], "measurement": "wiffi-wz.0.root.10_1_30_10.w_counter_3", "orderByTime": "ASC", "policy": "default", "refId": "A", "resultFormat": "time_series", "select": [ [ { "params": [ "value" ], "type": "field" }, { "params": [], "type": "mean" } ] ], "tags": [] } ], "title": "Zählerstand", "type": "stat" }, { "datasource": { "type": "influxdb", "uid": "${DS_INFLUXDB}" }, "fieldConfig": { "defaults": { "color": { "mode": "palette-classic" }, "custom": { "axisCenteredZero": false, "axisColorMode": "text", "axisLabel": "", "axisPlacement": "auto", "barAlignment": 0, "drawStyle": "line", "fillOpacity": 100, "gradientMode": "opacity", "hideFrom": { "legend": false, "tooltip": false, "viz": false }, "lineInterpolation": "linear", "lineWidth": 1, "pointSize": 5, "scaleDistribution": { "type": "linear" }, "showPoints": "never", "spanNulls": false, "stacking": { "group": "A", "mode": "none" }, "thresholdsStyle": { "mode": "line" } }, "links": [], "mappings": [], "thresholds": { "mode": "absolute", "steps": [ { "color": "transparent", "value": null } ] }, "unit": "flowlpm" }, "overrides": [ { "matcher": { "id": "byName", "options": "Gesamt" }, "properties": [ { "id": "color", "value": { "fixedColor": "semi-dark-blue", "mode": "fixed" } } ] }, { "matcher": { "id": "byName", "options": "solar" }, "properties": [ { "id": "color", "value": { "fixedColor": "#73BF69", "mode": "fixed" } }, { "id": "unit", "value": "watt" } ] } ] }, "gridPos": { "h": 10, "w": 19, "x": 5, "y": 6 }, "id": 8, "links": [], "options": { "legend": { "calcs": [ "mean", "lastNotNull", "max", "min" ], "displayMode": "table", "placement": "bottom", "showLegend": true }, "tooltip": { "mode": "multi", "sort": "none" } }, "pluginVersion": "8.5.2", "targets": [ { "alias": "Gesamt", "datasource": { "type": "influxdb", "uid": "${DS_INFLUXDB}" }, "groupBy": [ { "params": [ "10s" ], "type": "time" }, { "params": [ "previous" ], "type": "fill" } ], "hide": false, "measurement": "wiffi-wz.0.root.10_1_30_10.w_power_3", "orderByTime": "ASC", "policy": "default", "refId": "A", "resultFormat": "time_series", "select": [ [ { "params": [ "value" ], "type": "field" }, { "params": [], "type": "mean" }, { "params": [ " *1000" ], "type": "math" } ] ], "tags": [] } ], "title": "aktueller Wasserverbrauch", "transparent": true, "type": "timeseries" } ], "refresh": "", "schemaVersion": 38, "style": "dark", "tags": [ "Hausenergie", "Wasser" ], "templating": { "list": [] }, "time": { "from": "now-24h", "to": "now" }, "timepicker": {}, "timezone": "", "title": "Wasser", "uid": "nZwcX6d4k", "version": 14, "weekStart": "" }
  • Grafana: täglichen Solar-Ertrag summieren

    7
    1
    0 Stimmen
    7 Beiträge
    606 Aufrufe
    M
    @marc-berg said in Grafana: täglichen Solar-Ertrag summieren: timeSrc: "_start" Super!! Das war die Lösung.
  • [Gelöst] Grafana Datum stimmt nicht

    5
    3
    0 Stimmen
    5 Beiträge
    463 Aufrufe
    Marc BergM
    @dede2403 sagte in Grafana Datum stimmt nicht: Danke kann geschlossen werden. Das ist aber deine Aufgabe, indem du deinen ersten Post editierst und "gelöst" mit in den Betreff setzt. :-)
  • Reihenfolge Diagramme in Grafana ändern?

    Verschoben
    2
    1
    0 Stimmen
    2 Beiträge
    234 Aufrufe
    M
    Aaahrg, ich habe übersehen, dass ich ein "Transform" eingebaut hatte, dessen Graph dann die Linie immer übermalt hat. Jetzt klappts :-) [image: 1713281165392-5a595d5e-88a9-4a08-8efb-766f06b4ff4f-image.png]

938

Online

32.4k

Benutzer

81.4k

Themen

1.3m

Beiträge