

Test eCharts Adapter
-
Moin
Seit ich den Adapter am Laufen habe, bekomme ich des Öfteren folgende Fehlermeldung auf meinem Rechner im Firefox, wenn ich die VIS aufrufe:
Socket Error: Error: xhr post errorOder alternativ manchmal auch:
Socket Error: Error: websocket errorDas war vorher definitiv nicht der Fall. Woran kann das liegen? der ioBroker läuft auf einem Nuc und die Adapter sind alle aktuell. Hat jemand eine Idee?
Dank & Gruß
Daniel -
@besterquester one after other.... May be.
-
Aktuelle Test Version 0.4.2 Veröffentlichungsdatum 01.11.2020 Github Link https://github.com/ioBroker/ioBroker.echarts Hallo Community,
ich möchte für den Test mein neuen Adapter abgeben: echarts.
Die Entwicklung hat mehr als ein Jahr gedauert (seit 21 Okt 2019) und ich habe sehr viel Zeit in diesen Adapter inverstiert.
Der Adapter ist als Ersatz für flot gedacht und alle Presets aus flot werden beim Start automatisch einmalig übernommen.
Ich denke, dass Adapter selbst erklärend ist. Man kann im Vis die Charts benutzen oder auch irgendwo als iframe:
http://IP:8082/echarts/index.html?preset=echarts.0.PRESETID.Die Issues, wie immer, bitte ich auf github erstellen: https://github.com/ioBroker/ioBroker.echarts/issues
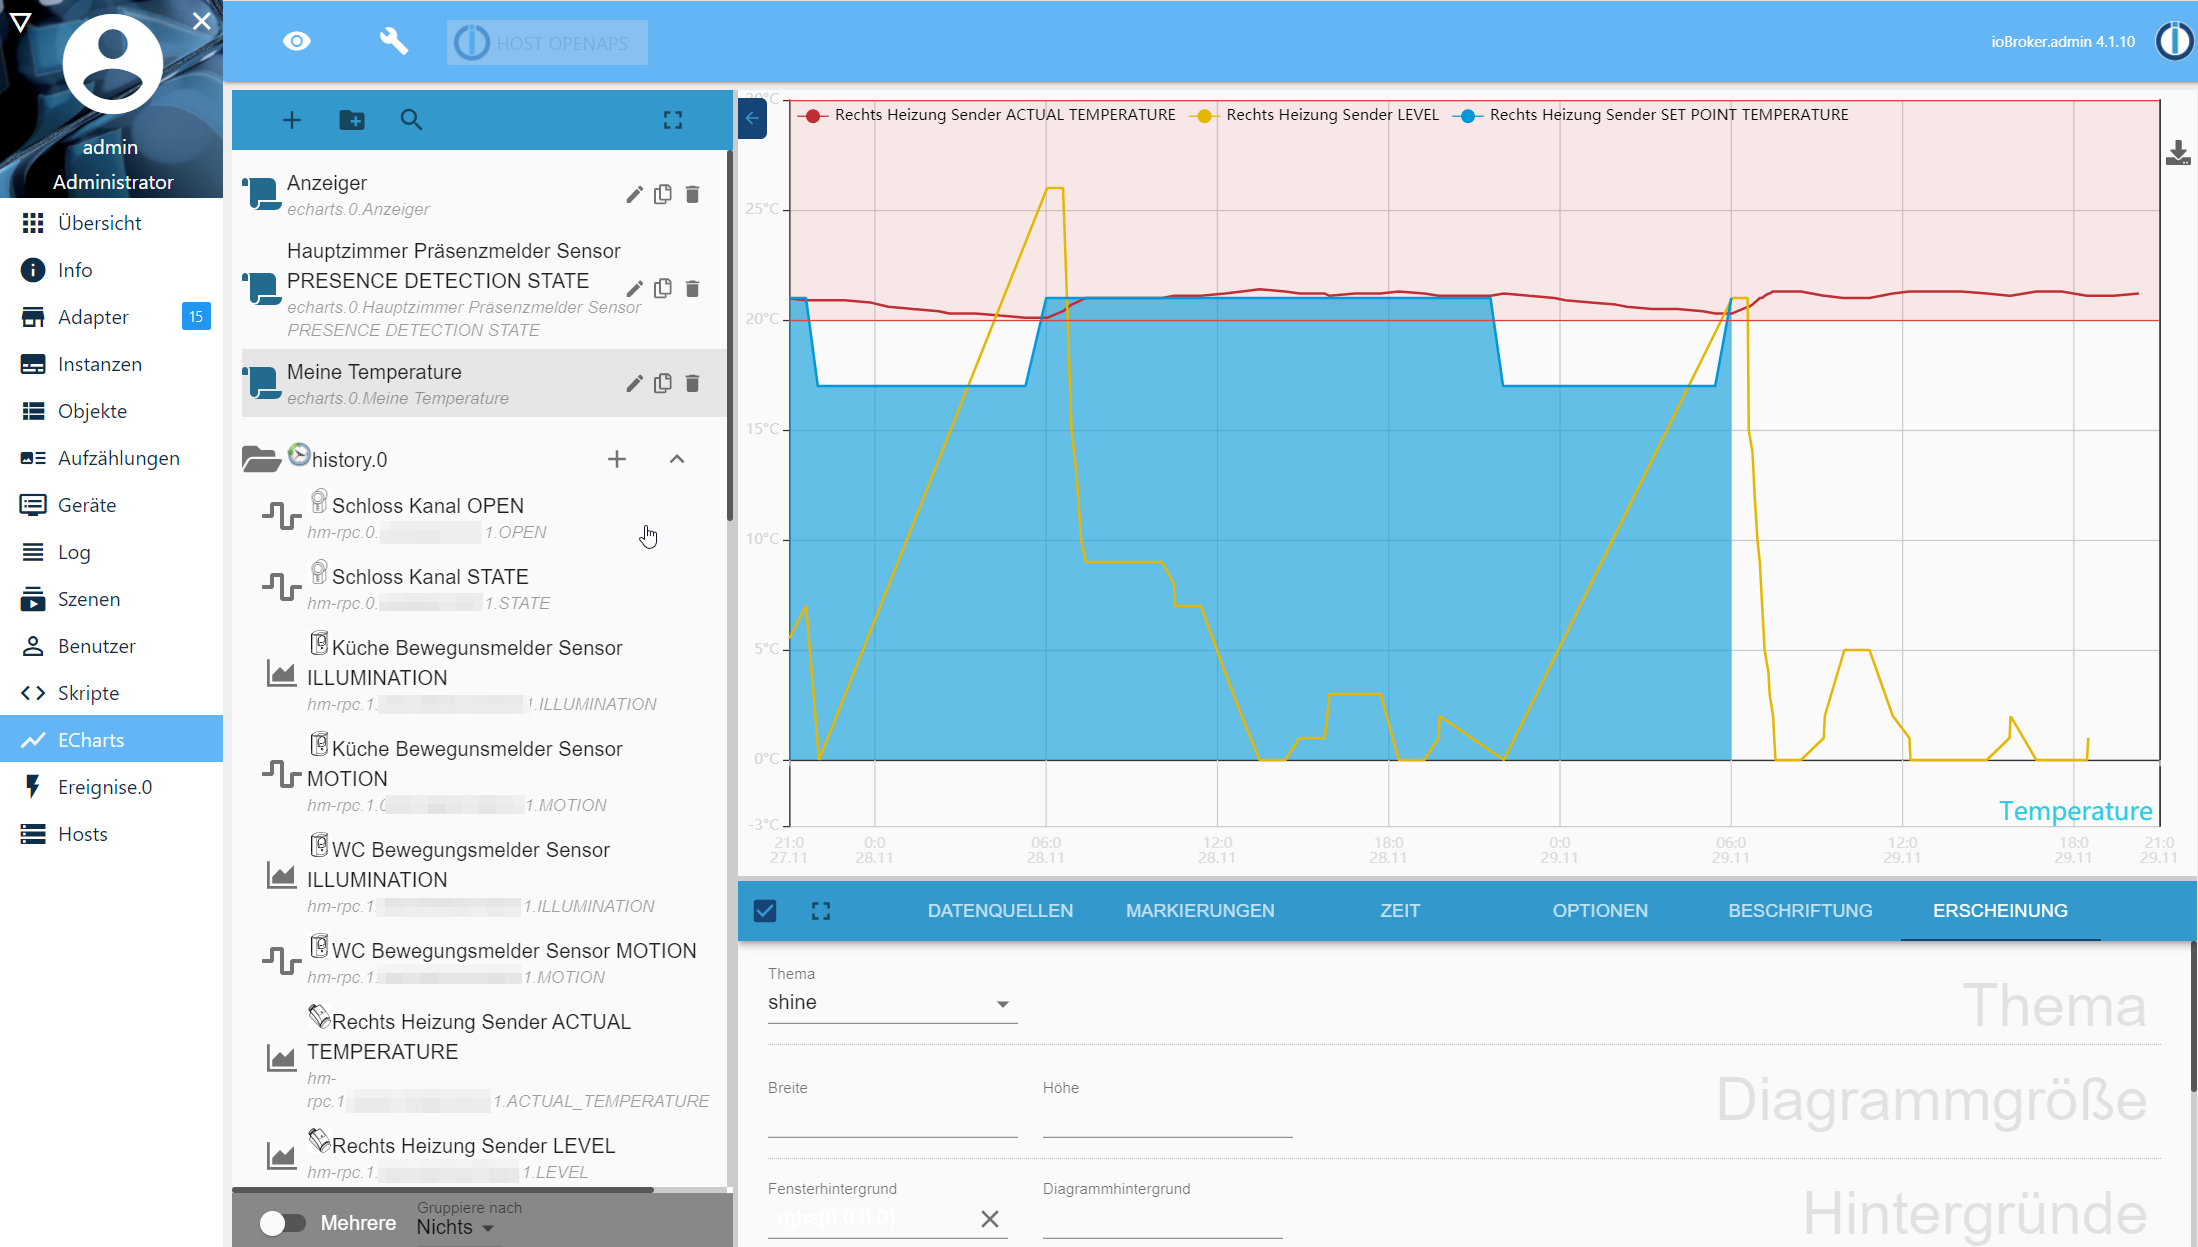
Moin zusammen,
gibt es die Möglichkeit die Schriftgröße der Legende für die dargestellten Daten zu ändern? Die Einstellung kann ich bei dem schönen Adapter nicht finden.
Wenn ich ein Theme wähle, ändert sich die Darstellung des Diagramms auch nicht. Was mache ich falsch? Der Fehler sitzt wahrscheinlich vor dem Monitor :)
Gruß + vielen Dank
-
Moin zusammen,
gibt es die Möglichkeit die Schriftgröße der Legende für die dargestellten Daten zu ändern? Die Einstellung kann ich bei dem schönen Adapter nicht finden.
Wenn ich ein Theme wähle, ändert sich die Darstellung des Diagramms auch nicht. Was mache ich falsch? Der Fehler sitzt wahrscheinlich vor dem Monitor :)
Gruß + vielen Dank
@funnsurfer geht noch nicht.
Issue habe ich erstellt:
https://forum.iobroker.net/topic/39172/test-echarts-adapter/52?_=1614584046099
https://github.com/ioBroker/ioBroker.echarts/issues/29Host: NUC8i3 mit Proxmox:
- ioBroker CT Debian 13, npm 10.9.4, nodejs 22.21.0
- Slave: Pi4
-
@funnsurfer geht noch nicht.
Issue habe ich erstellt:
https://forum.iobroker.net/topic/39172/test-echarts-adapter/52?_=1614584046099
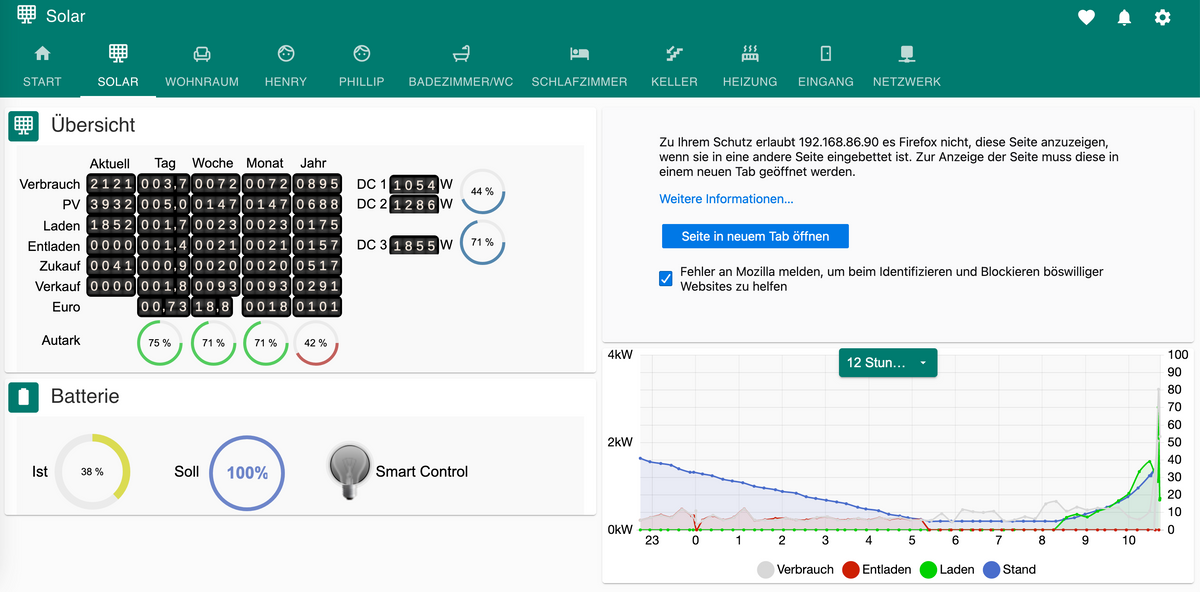
https://github.com/ioBroker/ioBroker.echarts/issues/29Hat hier schonmal jemand versucht die Charts über iframe einzubetten? Ich benutze jarvis und da blockiert der Browser das Chart oben rechts. Unten links ist ein Chart aus der Visu eingebttet.
-
Hat hier schonmal jemand versucht die Charts über iframe einzubetten? Ich benutze jarvis und da blockiert der Browser das Chart oben rechts. Unten links ist ein Chart aus der Visu eingebttet.
-
@stephan1827 Ich habe genau dasselbe Problem beim einbinden über IFrame in VIS
Das Problem hatte ich auch mal mit Lovelace und Flot.
Da lag es daran, dass die eine Instanz mittels Ssl verschlüsselt war und die andere nicht.
Nachdem beides auf Ssl gestellt war, lief es dann. -
Das Problem hatte ich auch mal mit Lovelace und Flot.
Da lag es daran, dass die eine Instanz mittels Ssl verschlüsselt war und die andere nicht.
Nachdem beides auf Ssl gestellt war, lief es dann. -
@dskrt ich hab irgendwie im Hinterkopf, das nur HTTP funktioniert, bin mir aber unsicher. Wäre aber nen Versuch wert...
UDM Pro, Intel NUC - ioBroker in Proxmox-VM, PiHole+Grafana&Influx+TasmoAdmin in LXCs, Raspberry Pi3 (als CCU), Zigbee-Stick Sonoff, Synology DS918+
-
@dskrt ich hab irgendwie im Hinterkopf, das nur HTTP funktioniert, bin mir aber unsicher. Wäre aber nen Versuch wert...
-
Das Problem hatte ich auch mal mit Lovelace und Flot.
Da lag es daran, dass die eine Instanz mittels Ssl verschlüsselt war und die andere nicht.
Nachdem beides auf Ssl gestellt war, lief es dann.@david-g Es ist definitiv ein Problem zwischen VIS und ECharts, ein Iframe in VIS mit JarVIS oder auch FLOT läuft einwandfrei, sowohl https wie auch http. Irgendwo in ECharts ist eine Option zum setzen von 'allow Iframes, aber wo ? Wer kann helfen ?
-
Moin,
ich versuche mich immer noch an dem Server-Side-Rendering, ich möchte gerne Charts an Telegram versenden. Muss da noch etwas installiert / aktiviert werden? Wenn ich das Beispiel-Script von @Bluefox nehme, passiert bei mir rein gar nichts - es gibt auch keinen Log-Eintrag.Gruß Steffen
ioBroker auf Intel NUC 7CJYH / Debian 13 "Trixie" / States & Objects in JSONL / Repo --> Beta / HM CCU2 V2.61.7 / Siemens LOGO! (0BA7 / 0BA8)
Admin V7.8.24 / Node V22.22.2 / NPM V10.9.7 / JSC V7.1.2 / JSE V9.2.2 -
Moin,
ich versuche mich immer noch an dem Server-Side-Rendering, ich möchte gerne Charts an Telegram versenden. Muss da noch etwas installiert / aktiviert werden? Wenn ich das Beispiel-Script von @Bluefox nehme, passiert bei mir rein gar nichts - es gibt auch keinen Log-Eintrag.Gruß Steffen
@steff sagte in Test eCharts Adapter:
das Beispiel-Script von @Bluefox nehme
hast du dazu mal einen Link?
EDIT:
meinst du das hier: https://github.com/ioBroker/ioBroker.echarts#server-side-renderingkein Support per PN! - Fragen im Forum stellen -
Benutzt das Voting rechts unten im Beitrag wenn er euch geholfen hat.
Das Forum freut sich über eine Spende. Benutzt dazu den Spendenbutton oben rechts. Danke!
der Installationsfixer: curl -fsL https://iobroker.net/fix.sh | bash - -
@steff sagte in Test eCharts Adapter:
das Beispiel-Script von @Bluefox nehme
hast du dazu mal einen Link?
EDIT:
meinst du das hier: https://github.com/ioBroker/ioBroker.echarts#server-side-renderingioBroker auf Intel NUC 7CJYH / Debian 13 "Trixie" / States & Objects in JSONL / Repo --> Beta / HM CCU2 V2.61.7 / Siemens LOGO! (0BA7 / 0BA8)
Admin V7.8.24 / Node V22.22.2 / NPM V10.9.7 / JSC V7.1.2 / JSE V9.2.2 -
@steff sagte in Test eCharts Adapter:
@homoran,
ich habe das hier aus diesem Post genommen Link TextGruß Steffen
das ist ja fast, das gleiche, bzw. eine Umsetzung dessen, was auf github steht:
sendTo('echarts.0', {
    preset:   'echarts.0.myPreset', // the only mandatory attribute

    renderer: 'svg',                // svg | png | jpg | pdf, default: svg

    width: 1024,                    // default 1024
    height: 300,                    // default 300
    background: '#000000',          // Background color
    theme: 'light',                 // Theme type: 'light', 'dark'

    title: 'ioBroker Chart',        // Title of PDF document
    quality: 0.8,                   // quality of JPG
    compressionLevel: 3,            // Compression level of PNG
    filters: 8,                     // Filters of PNG (Bit combination https://github.com/Automattic/node-canvas/blob/master/types/index.d.ts#L10)

    fileOnDisk: '',                 // Path on disk to save the file.
    fileName: '',                   // Path in ioBroker DB to save the files on 'echarts.0'. E.g. if your set "chart.svg", so you can access your picture via http(s)://ip:8082/echarts.0/chart.png
}, result => {
    if (result.error) {
        console.error(result.error);
    } else {
        console.log(result.data);
    }
});
Die Variablen hast du aber angepasst?
(Info: Ich habe das Skript noch nicht probiert!)kein Support per PN! - Fragen im Forum stellen -
Benutzt das Voting rechts unten im Beitrag wenn er euch geholfen hat.
Das Forum freut sich über eine Spende. Benutzt dazu den Spendenbutton oben rechts. Danke!
der Installationsfixer: curl -fsL https://iobroker.net/fix.sh | bash - -
@steff sagte in Test eCharts Adapter:
@homoran,
ich habe das hier aus diesem Post genommen Link TextGruß Steffen
das ist ja fast, das gleiche, bzw. eine Umsetzung dessen, was auf github steht:
sendTo('echarts.0', {
    preset:   'echarts.0.myPreset', // the only mandatory attribute

    renderer: 'svg',                // svg | png | jpg | pdf, default: svg

    width: 1024,                    // default 1024
    height: 300,                    // default 300
    background: '#000000',          // Background color
    theme: 'light',                 // Theme type: 'light', 'dark'

    title: 'ioBroker Chart',        // Title of PDF document
    quality: 0.8,                   // quality of JPG
    compressionLevel: 3,            // Compression level of PNG
    filters: 8,                     // Filters of PNG (Bit combination https://github.com/Automattic/node-canvas/blob/master/types/index.d.ts#L10)

    fileOnDisk: '',                 // Path on disk to save the file.
    fileName: '',                   // Path in ioBroker DB to save the files on 'echarts.0'. E.g. if your set "chart.svg", so you can access your picture via http(s)://ip:8082/echarts.0/chart.png
}, result => {
    if (result.error) {
        console.error(result.error);
    } else {
        console.log(result.data);
    }
});
Die Variablen hast du aber angepasst?
(Info: Ich habe das Skript noch nicht probiert!)@homoran,
ja, habe ich angepasst.
Sieht bei mir momentan so aus:// Chart vorbereiten und an Telegram-Empfänger schicken sendTo('echarts.0', { preset: 'echarts.0.Heizung.Solaranlage', renderer: 'png', fileOnDisk: '/tmp/chart.png' }, result => { if (result.error) { console.error(result.error); } else { console.log(result.data); sendTo('telegram.0', '/tmp/chart.png'); } });ioBroker auf Intel NUC 7CJYH / Debian 13 "Trixie" / States & Objects in JSONL / Repo --> Beta / HM CCU2 V2.61.7 / Siemens LOGO! (0BA7 / 0BA8)
Admin V7.8.24 / Node V22.22.2 / NPM V10.9.7 / JSC V7.1.2 / JSE V9.2.2 -
@homoran,
ja, habe ich angepasst.
Sieht bei mir momentan so aus:// Chart vorbereiten und an Telegram-Empfänger schicken sendTo('echarts.0', { preset: 'echarts.0.Heizung.Solaranlage', renderer: 'png', fileOnDisk: '/tmp/chart.png' }, result => { if (result.error) { console.error(result.error); } else { console.log(result.data); sendTo('telegram.0', '/tmp/chart.png'); } });@steff in /tmp/ liegt nichts?
kein Support per PN! - Fragen im Forum stellen -
Benutzt das Voting rechts unten im Beitrag wenn er euch geholfen hat.
Das Forum freut sich über eine Spende. Benutzt dazu den Spendenbutton oben rechts. Danke!
der Installationsfixer: curl -fsL https://iobroker.net/fix.sh | bash - -
@homoran sagte in Test eCharts Adapter:
@steff in /tmp/ liegt nichts?
Nee, das File wird nicht angelegt.
ioBroker auf Intel NUC 7CJYH / Debian 13 "Trixie" / States & Objects in JSONL / Repo --> Beta / HM CCU2 V2.61.7 / Siemens LOGO! (0BA7 / 0BA8)
Admin V7.8.24 / Node V22.22.2 / NPM V10.9.7 / JSC V7.1.2 / JSE V9.2.2 -
@homoran sagte in Test eCharts Adapter:
@steff in /tmp/ liegt nichts?
Nee, das File wird nicht angelegt.
@steff Hab es gerade getestet und bekomme folgenden Error:
11:25:17.553 error javascript.0 (4830) script.js.serverside_rendering: Cannot find required modules: looks like it is not possible to generate charts on your Hardware/OSkein Support per PN! - Fragen im Forum stellen -
Benutzt das Voting rechts unten im Beitrag wenn er euch geholfen hat.
Das Forum freut sich über eine Spende. Benutzt dazu den Spendenbutton oben rechts. Danke!
der Installationsfixer: curl -fsL https://iobroker.net/fix.sh | bash - -
@steff Hab es gerade getestet und bekomme folgenden Error:
11:25:17.553 error javascript.0 (4830) script.js.serverside_rendering: Cannot find required modules: looks like it is not possible to generate charts on your Hardware/OS

Hey! Du scheinst an dieser Unterhaltung interessiert zu sein, hast aber noch kein Konto.
Hast du es satt, bei jedem Besuch durch die gleichen Beiträge zu scrollen? Wenn du dich für ein Konto anmeldest, kommst du immer genau dorthin zurück, wo du zuvor warst, und kannst dich über neue Antworten benachrichtigen lassen (entweder per E-Mail oder Push-Benachrichtigung). Du kannst auch Lesezeichen speichern und Beiträge positiv bewerten, um anderen Community-Mitgliedern deine Wertschätzung zu zeigen.
Mit deinem Input könnte dieser Beitrag noch besser werden 💗
Registrieren AnmeldenSupport us
383
Online33.0k
Benutzer83.4k
Themen1.3m
Beiträge