Hallo zusammen,
ich habe einen inoffiziellen ioBroker-Adapter für Leapmotor-Elektrofahrzeuge entwickelt und würde mich über Tester freuen, bevor er (hoffentlich bald) ins offizielle Latest-Repository aufgenommen wird. Der PR läuft bereits: https://github.com/ioBroker/ioBroker.repositories/pull/6241
Was der Adapter kann:
Fahrzeugstatus auslesen: Akkustand, Reichweite, Türen/Fenster, Reifendruck, Standort u.v.m.
Fernsteuerung: Sperren/Entsperren, Klimaanlage (Heizen/Kühlen/Lüften), Fenster, Kofferraum, Sonnendach
Ladeverwaltung: Ladelimit setzen, Ladezeitplan konfigurieren
Komfortfunktionen (modellabhängig): Sitzheizung, Lenkradheizung, Wachmodus, Geschwindigkeitsbegrenzung
Eigenes React-Admin-Dashboard mit Fahrzeugbild (inkl. Animation für offene Türen/Laden), Verbrauchsstatistik und Fahrten-Übersicht
Vollständig mehrsprachig (11 Sprachen inkl. Deutsch)
Getestete Modelle:
T03: vollständig getestet (mein eigenes Fahrzeug)
B10: läuft dank einem hilfsbereiten Community-Tester bereits gut, ein paar Statuswerte sind aber technisch bedingt nicht verfügbar (Cloud-API-Einschränkung, keine Adapter-Limitierung)
C10/C16/B05: sollten funktionieren (gleiche Cloud-API-Familie wie B10), aber noch ungetestet – Rückmeldungen willkommen!
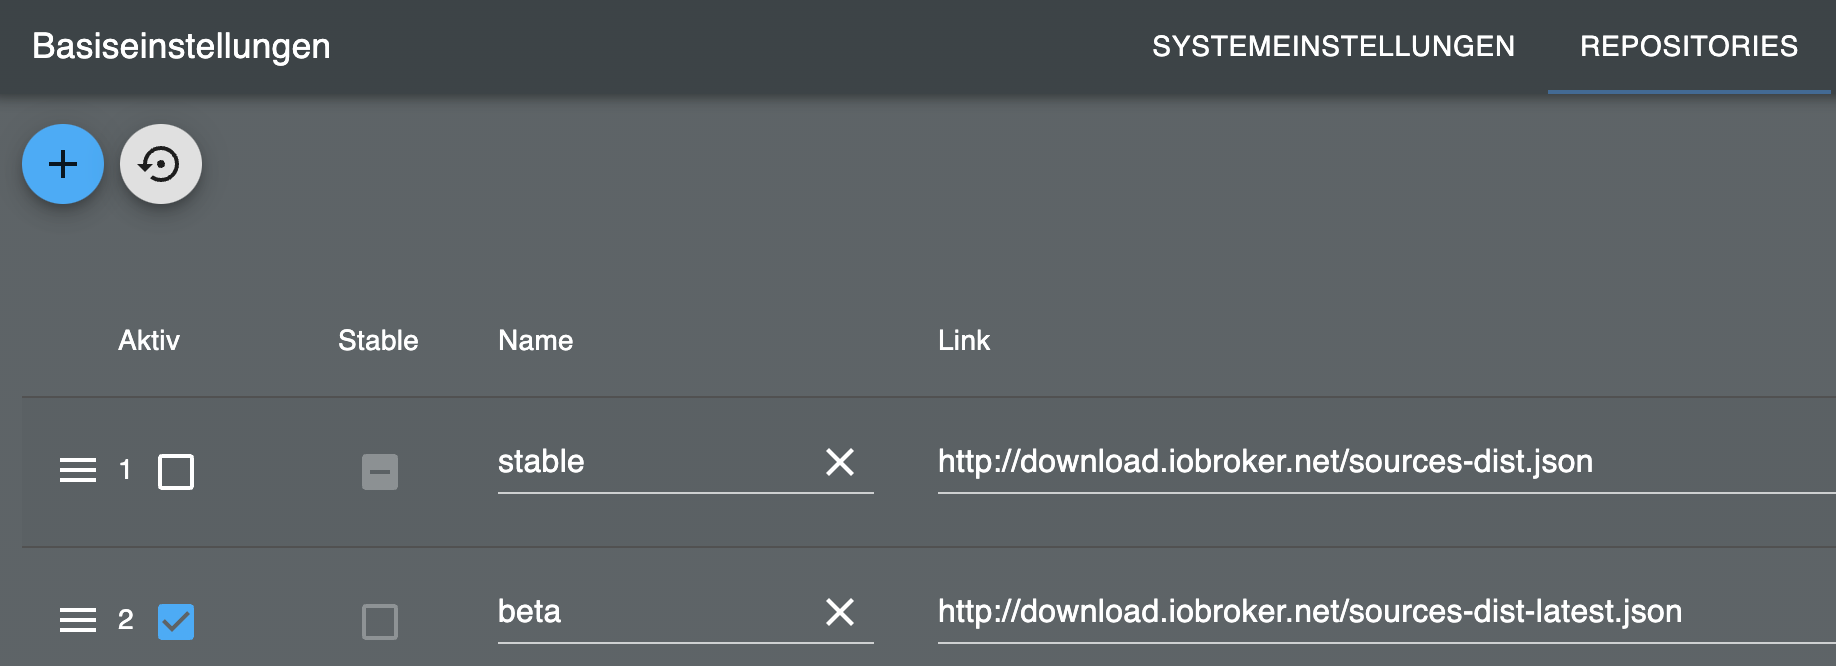
Installation (bis zur offiziellen Aufnahme über GitHub):
iobroker url backfisch88/ioBroker.leapmotor
Wichtig: Bitte einen separaten/zweiten Leapmotor-Account für den Adapter nutzen (siehe README), da die Cloud-Session sonst mit der Handy-App kollidiert.
Feedback, Bug-Reports und besonders Tests mit anderen Modellen als T03 sind sehr willkommen!
https://github.com/backfisch88/ioBroker.leapmotor