

Test Widget json template
-
@trojanhector
das problem ist, das die dateien im web-adapter registriert sein muss, das der web adapter die kennt.am besten du lädst die datei über den upload dialog im admin oder in vis hoch (der tab links in der admin sicht, muss ggfs eingeblendet werden)
alternative über shell mit iob file write:
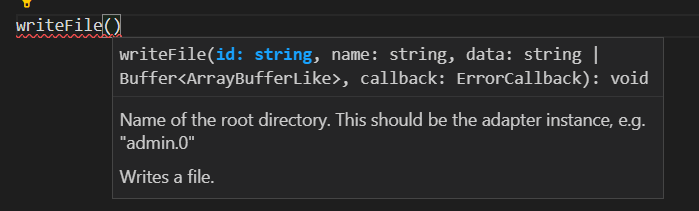
root@iobroker_test:/opt/iobroker# iob file --help
iobroker file

File management

Commands:
  iobroker file read <iobroker-path-to-read> [<filesystem-path-to-write>]  Read file from iobroker path and optionally write to destination
  iobroker file write <filesystem-path-to-read> <iobroker-path-to-write>   Read file from path and write it to iobroker path
  iobroker file rm <iobroker-path-to-delete>                               Remove file
  iobroker file sync                                                       Sync files

Options:
  --help  Show help  [boolean]
oder über javascript adapter mit
@oliverio Danke für die Hilfe. Der Hinweis mit dem registrieren der Datein war ein Teil des Problems. Ein anderer war, das chatgpt mir immer einen falschen Pfad angegeben hat.
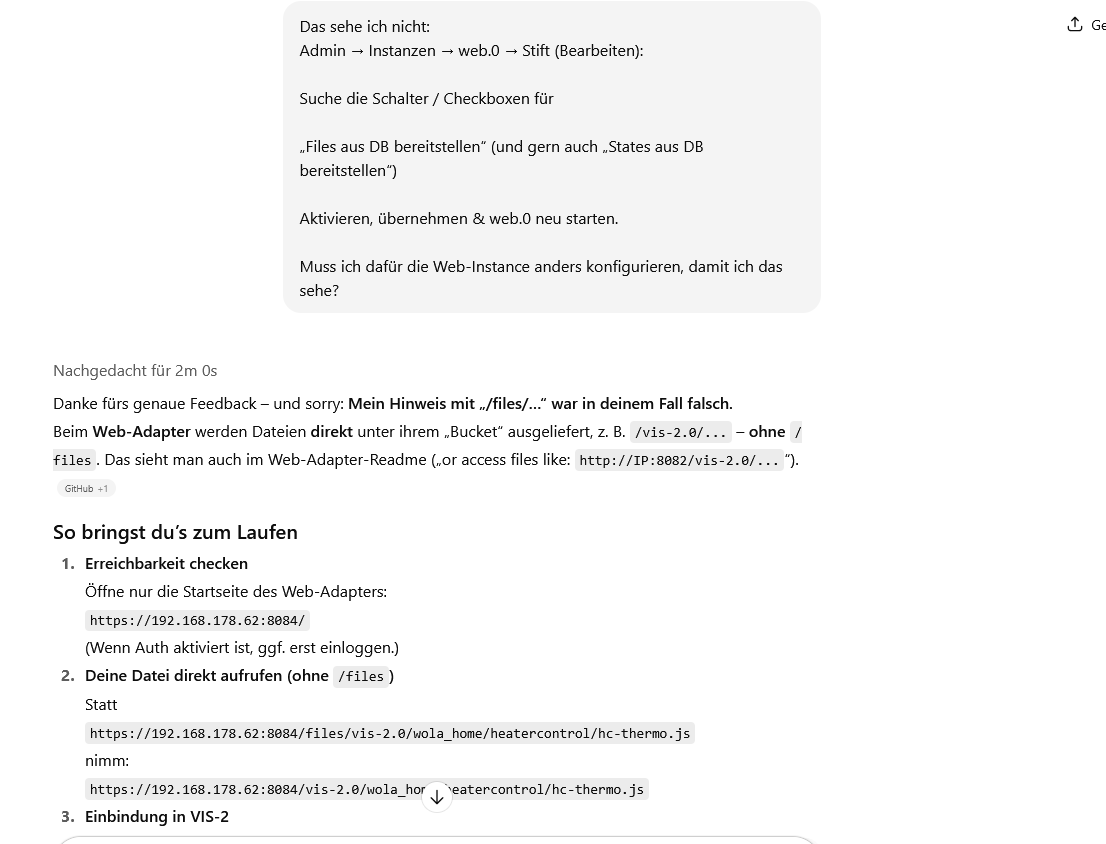
Falsch: https://192.168.178.62:8084/files/vis-2.0/wola_home/heatercontrol/hc-thermo.js
Richtig: https://192.168.178.62:8084/vis-2.0/wola_home/heatercontrol/hc-thermo.jsDas hat chatgpt dann durch genaues Fehlerfeedback doch noch hinbekommen.
-
@oliverio Danke für die Hilfe. Der Hinweis mit dem registrieren der Datein war ein Teil des Problems. Ein anderer war, das chatgpt mir immer einen falschen Pfad angegeben hat.
Falsch: https://192.168.178.62:8084/files/vis-2.0/wola_home/heatercontrol/hc-thermo.js
Richtig: https://192.168.178.62:8084/vis-2.0/wola_home/heatercontrol/hc-thermo.jsDas hat chatgpt dann durch genaues Fehlerfeedback doch noch hinbekommen.
ja da muss man aufpassen. Fehler auch immer erst bei chatgpt suchen und nochmal durch echte Dokumentation verifizieren.
Ganz unrecht hat chatgpt nicht, kann aber für den Anwender verwirrend sein.Der physische Pfad
/opt/iobroker/iobroker-data/files/vis.0/main/
/opt/iobroker/iobroker-data/files/vis-2.0/main/wird im Browser als
/vis.0/main/
/vis-2.0/main/ausgeliefert.
Achtung, das gilt nur für den Fall das man jsonl als Datenbankformat verwendet. Wenn man redis verwendet, werden die Dateien direkt in redis gespeichert. Daher darf man nur die iobroker tools zum speichern von dateien verwenden.
-
Neue Version 1.0.1 vis-2-widgets-ovarious
Nachdem der neue Adapter vis-jsontemplate eingeführt wurde und vis1 und vis2 widgets parallel enthält, habe ich in der Version1.0.1 das widget auf deprecated gesetzt, so das dann demnächst der komplette Adapter abgemanaged werden kann.
Bitte zeitnah den adapter iobroker.vis-jsontemplate installieren.
An diesem Adapter wird es keine Weiterentwicklung mehr geben.Leider bin ich aktuell nicht in der Lage hier ein neues Build zu erstellen.
Trotz identischer Konfiguration wird mir aufgrund eines Problems, was aber in den build Tools der react widgets (für eine ältere Version) liegt. Wird das build nicht erstellt.Da ich den Adapter aber deswegen nicht auf die neuere build Kette umstellen will, erkläre ich hiermit den Adapter und die darin enthaltenen Widgets als deprecated.
-
hm, ja das ist ein Ding.
Irgendwie hab ich den release Befehl hier nicht ausgelöst.
Also lag an mir.Daher kommt nun Version 4.1.2
Sorry
Version ist da
Wer es noch schneller haben will,
kann über den Expertenmodus/Octocat-Knopf/NPM
direkt von npm installierenMit dieser Version befindet sich der Adapter nun im stable.
@oliverio sagte in Test Widget json template:
hm, ja das ist ein Ding.
Irgendwie hab ich den release Befehl hier nicht ausgelöst.
Also lag an mir.Daher kommt nun Version 4.1.2
Sorry
Version ist da
Wer es noch schneller haben will,
kann über den Expertenmodus/Octocat-Knopf/NPM
direkt von npm installieren -
Neue Version 4.1.3
- Eine Race-Condition wurde behoben, die sich bei der gleichzeitigen Verwendung des selben Datenpunktes in 2 jsontemplate widgets ergeibt.
https://forum.iobroker.net/topic/81472/neuer-adapter-pi-hole2-für-pihole-v6/35?_=1762181697804
-
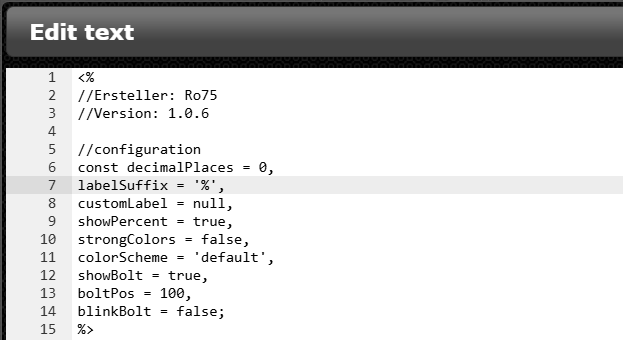
Ich habe mal das Battery-skript für jsontemplate umgesetzt, so das man ohne zusätzlichen Datenpunkt das Ergebnis direkt im Browser einbinden kann
Das Template hier im widget einfach einfügen.
Der Datenpunkt aus dem der Wert kommt ist als
datapoint[1] einzutragen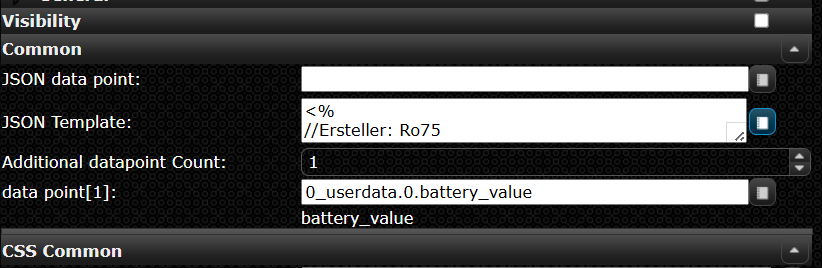

Die im folgenden thread beschriebenen Konfigurationsmöglichkeiten sind direkt zum Beginn des Template verfügbar:
Die Objektnotationen aus dem Skript mussten umformatiert werden, da diese durch vis ansonsten als bindings erkannt werden.
-
Ich habe mal das Battery-skript für jsontemplate umgesetzt, so das man ohne zusätzlichen Datenpunkt das Ergebnis direkt im Browser einbinden kann
Das Template hier im widget einfach einfügen.
Der Datenpunkt aus dem der Wert kommt ist als
datapoint[1] einzutragenDie im folgenden thread beschriebenen Konfigurationsmöglichkeiten sind direkt zum Beginn des Template verfügbar:
Die Objektnotationen aus dem Skript mussten umformatiert werden, da diese durch vis ansonsten als bindings erkannt werden.
@oliverio super. Frage. Kann auch individuell das Ladesymbol zugeschalten werden, wenn Ladevorgang erkannt wird?
Ro75.
SERVER = Beelink U59 16GB DDR4 RAM 512GB SSD, FB 7490, FritzDect 200+301+440, ConBee II, Zigbee Aqara Sensoren + NOUS A1Z, NOUS A1T, Philips Hue ** ioBroker, REDIS, influxdb2, Grafana, PiHole, Plex-Mediaserver, paperless-ngx (Docker), MariaDB + phpmyadmin *** VIS-Runtime = Intel NUC 8GB RAM 128GB SSD + 24" Touchscreen
-
@oliverio super. Frage. Kann auch individuell das Ladesymbol zugeschalten werden, wenn Ladevorgang erkannt wird?
Ro75.
Ja man kann beliebig viele datenpunkte eintragen und die dann wie bei percent in eine variable übernehmen.
Wenn man da dann True/false drin steht oder man das mit JavaScript Logic auswertet ist egal.Das holt den Wert des ersten datenpunktes
const percent = dp[Object.keys(dp)[0]]; -
Neue Version 4.2.0
- Einige Übersetzungen korrigieren
- vis2-Attributnamen an vis1 anpassen (Achtung ggfs sind templates anzupassen)
- Widget-Daten zu den verfügbaren Vorlagenobjekten in vis2 hinzugefügt
- style- und Widget-Objekte zu den verfügbaren Vorlagenobjekten in vis1 hinzugefügt
- Dokumentation verbessert
-
Ich habe mal eine Umfrage.
Der Adapter wurde mittlerweile über 180 mal installiert.
Dazu kommen noch die 580 Installationen mit dem deprecated Adapter ioBroker.vis-2-widgets-ovarious, die eigentlich alle noch wechseln sollten.Was habt ihr den so umgesetzt?
Evtl können wir hier ein paar weitere UseCases mit anderen teilen und ich bekomme Input in wie weit ich den Adapter noch weiter verbessern könnte. -
Ich habe mal eine Umfrage.
Der Adapter wurde mittlerweile über 180 mal installiert.
Dazu kommen noch die 580 Installationen mit dem deprecated Adapter ioBroker.vis-2-widgets-ovarious, die eigentlich alle noch wechseln sollten.Was habt ihr den so umgesetzt?
Evtl können wir hier ein paar weitere UseCases mit anderen teilen und ich bekomme Input in wie weit ich den Adapter noch weiter verbessern könnte.ist mit dem Widget auch eine Darstellung von Charts möglich?
Hier mal lein Beispiel aus einem Adapter, dessen Widgets in der VIS 2 nicht mehr funktionieren, ich aber absolut genial finde.
https://github.com/Scrounger/ioBroker.vis-materialdesign?tab=readme-ov-file#json-chartGruß
Oliver -
ist mit dem Widget auch eine Darstellung von Charts möglich?
Hier mal lein Beispiel aus einem Adapter, dessen Widgets in der VIS 2 nicht mehr funktionieren, ich aber absolut genial finde.
https://github.com/Scrounger/ioBroker.vis-materialdesign?tab=readme-ov-file#json-chartEigentlich sollte doch das Widget funktionieren. Ansonsten dort issue aufmachen, damit man es repariert.
Problem ist meistens, dass man die Bibliothek mit reinbekommen muss. Das kann das Jason Template Widget aktuell noch nicht.
Werde mir aber mal überlegen, was man da machen kann.Aber auf jeden Fall bei dem anderen Widget, ein issue aufmachen, dass das repariert wird
-
Eigentlich sollte doch das Widget funktionieren. Ansonsten dort issue aufmachen, damit man es repariert.
Problem ist meistens, dass man die Bibliothek mit reinbekommen muss. Das kann das Jason Template Widget aktuell noch nicht.
Werde mir aber mal überlegen, was man da machen kann.Aber auf jeden Fall bei dem anderen Widget, ein issue aufmachen, dass das repariert wird
-
@OliverIO
Danke für deine Info, der Adapter wird nicht in VIS2 überführt, daher suche ich ja eine Alternative@Oli sagte in Test Widget json template:
@OliverIO
Danke für deine Info, der Adapter wird nicht in VIS2 überführt, daher suche ich ja eine Alternativehast du schon mal den probiert?
https://github.com/ioBroker/ioBroker.echartsder kann die daten ebenfalls aus json ziehen.
verwende ihn selbst aber nicht -
Neue Version 4.3.10
- Es ist nun möglich javascript Bibliotheken und css Dateien per url zu laden
Diese Funktion steht aktuell nur für das vis1 widget zur Verfügung um dies ersteinmal zu testen.
Einen Beispiel Usecase mit chartjs kann in der readme nachgelesen werden
https://github.com/oweitman/ioBroker.vis-jsontemplate/tree/main?tab=readme-ov-file#use-case-for-loading-additional-scriptshier mal ein Screenshot des Beispiels wie man mit JSON-Daten aus einem Datenpunkt ein chart mittels der chartJS-Bibliothek erstellen kann
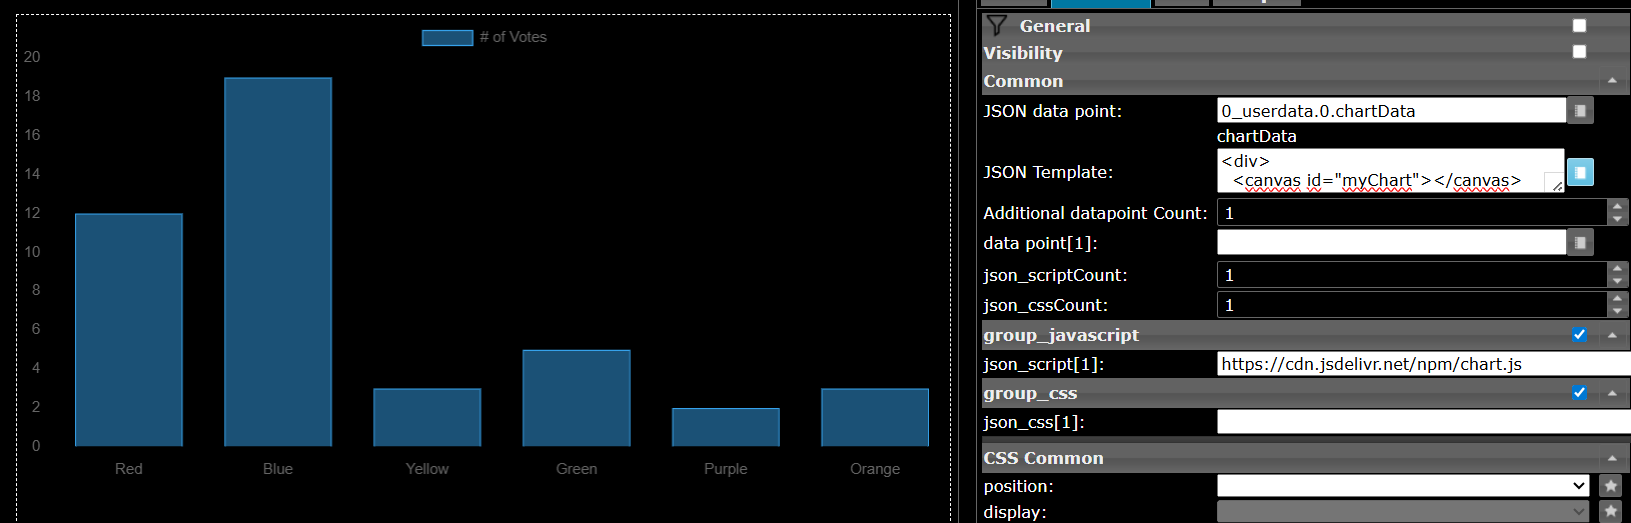
https://www.chartjs.org/docs/latest/getting-started/Das ist jetzt keine Super-Komfort Lösung die sehr einfach ist, aber eine bei der man sehr detailliert die Möglichkeiten so einer Bibliothek nutzen kann.
-
Neue Version 4.4.0
Die in Version 4.3.10 eingeführte Möglichkeit javascripts und css-Dateien zu laden und im template zu verwenden, wurde nun auch dem vis-2 widget hinzugefügt.
Das beschriebene Beispiel funktioniert nun 1:1 auch im vis-2 widget.
Einen Beispiel Usecase mit chartjs kann in der readme nachgelesen werden
https://github.com/oweitman/ioBroker.vis-jsontemplate/tree/main?tab=readme-ov-file#use-case-for-loading-additional-scripts -
 H Homoran verschob dieses Thema von Tester am
-
H Homoran verschob dieses Thema von ...nicht in offiziellem Repo am
-
Neue Version 4.4.2
Diese Version behebt ein Problem aus Version 4.4.0, welche sich leider schon in stable befindet.
Das widget wird ggfs. falsch formatiert.
Wer nur stable verwenden will muss zunächst auf 4.3 zurück oder diese Version aus Beta installieren. In ca 14 Tagen wird diese Version dann nach stable gebracht.Meine Adapter und Widgets
TVProgram, SqueezeboxRPC, OpenLiga, RSSFeed, MyTime,, pi-hole2, vis-json-template, skiinfo, vis-mapwidgets, vis-2-widgets-rssfeed
Links im Profil -
Neue Version 4.4.2
Diese Version behebt ein Problem aus Version 4.4.0, welche sich leider schon in stable befindet.
Das widget wird ggfs. falsch formatiert.
Wer nur stable verwenden will muss zunächst auf 4.3 zurück oder diese Version aus Beta installieren. In ca 14 Tagen wird diese Version dann nach stable gebracht.Neue Version 4.4.2
Diese Version behebt ein Problem aus Version 4.4.0, welche sich leider schon in stable befindet.
Das widget wird ggfs. falsch formatiert.
Wer nur stable verwenden will muss zunächst auf 3.8 zurück oder diese Version aus Beta installieren. In ca 14 Tagen wird diese Version dann nach stable gebracht.Wenn du die Version früher im Stable haben wills einfach anfordern und anmerken dass das ein Priority Update ist.
Entwicklung u Betreuung: envertech-pv, hoymiles-ms, ns-client, pid, snmp Adapter;
Support Repositoryverwaltung.Wer 'nen Kaffee spendieren will: https://paypal.me
-
Neue Version 4.4.2
Diese Version behebt ein Problem aus Version 4.4.0, welche sich leider schon in stable befindet.
Das widget wird ggfs. falsch formatiert.
Wer nur stable verwenden will muss zunächst auf 3.8 zurück oder diese Version aus Beta installieren. In ca 14 Tagen wird diese Version dann nach stable gebracht.Wenn du die Version früher im Stable haben wills einfach anfordern und anmerken dass das ein Priority Update ist.
Die Version befindet sich nun auch im stable
Hey! Du scheinst an dieser Unterhaltung interessiert zu sein, hast aber noch kein Konto.
Hast du es satt, bei jedem Besuch durch die gleichen Beiträge zu scrollen? Wenn du dich für ein Konto anmeldest, kommst du immer genau dorthin zurück, wo du zuvor warst, und kannst dich über neue Antworten benachrichtigen lassen (entweder per E-Mail oder Push-Benachrichtigung). Du kannst auch Lesezeichen speichern und Beiträge positiv bewerten, um anderen Community-Mitgliedern deine Wertschätzung zu zeigen.
Mit deinem Input könnte dieser Beitrag noch besser werden 💗
Registrieren AnmeldenSupport us
390
Online33.0k
Benutzer83.4k
Themen1.3m
Beiträge