

Stromverbrauch protokollieren
-
Ok, wenn ihr meint dass das mit einer CSV nichts ist, dann halt so.
Ich habe das Skript nachgebaut:
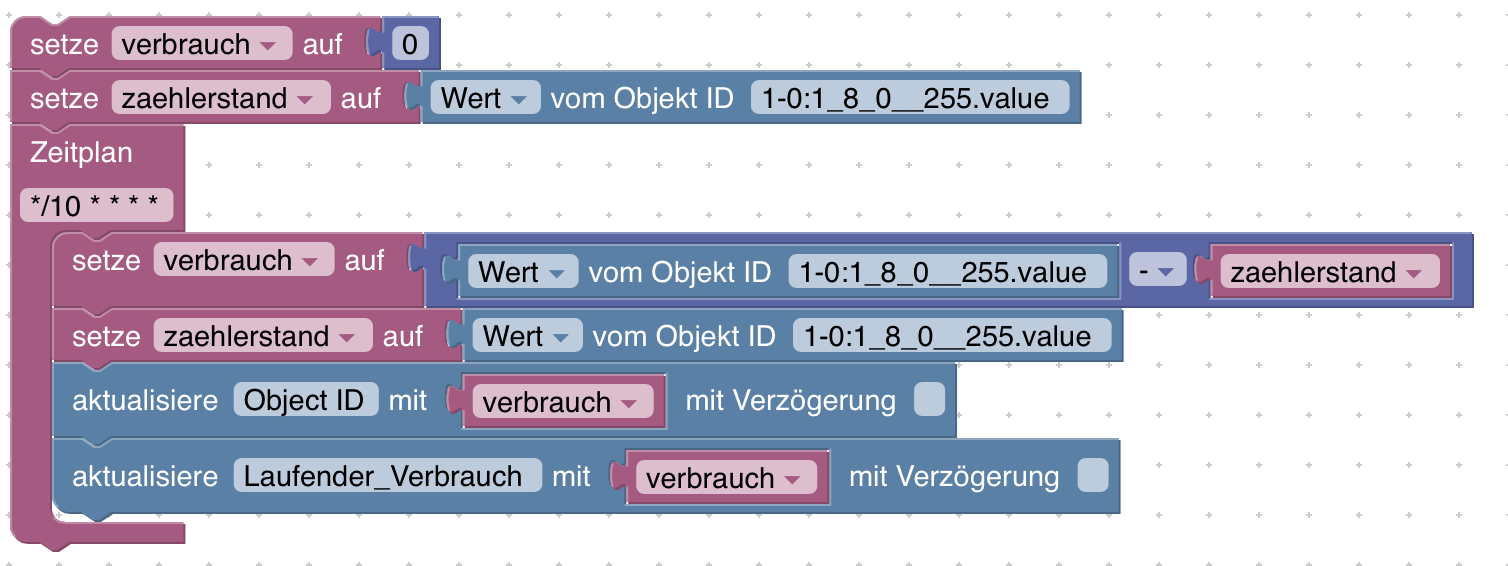
Bei der letzten Zeile habe ich eine Weile gebraucht. Laufender_Verbrauch habe ich ewig gesucht und das mit dem Datenpunkt "unterhalb 0_userdata.0 hab ich auch nicht verstanden was das sein soll. Aber irgendwann hab ich mir fast gedacht, dass das zusammenhängen muss. Dann hab ich 0_userdata gefunden und konnte da tatsächlich einen Datenpunkt anlegen. Zustandstyp Number ist richtig, oder?
Dann lasse ich das Skript mal laufen und beobachte diesen Datenpunkt.
Dann muss ich halt mal schauen wie ich daraus dann ein Diagramm erstellen kann.Danke euch schon mal.
Edit:
Ich bekomme Warnmeldungen im Log:
2023-01-05 18:10:00.008 - warn: javascript.0 (519) State "Object ID" not found
2023-01-05 18:10:00.010 - warn: javascript.0 (519) at setState (/usr/local/iobroker/node_modules/iobroker.javascript/lib/sandbox.js:1719:20)
2023-01-05 18:10:00.010 - warn: javascript.0 (519) at Object. (script.js.Stromzaehler_CSV:9:3)
2023-01-05 18:10:00.010 - warn: javascript.0 (519) at Job.job (/usr/local/iobroker/node_modules/iobroker.javascript/lib/sandbox.js:1595:34)
2023-01-05 18:10:00.010 - warn: javascript.0 (519) at Job.invoke (/usr/local/iobroker/node_modules/node-schedule/lib/Job.js:171:15)
2023-01-05 18:10:00.010 - warn: javascript.0 (519) at /usr/local/iobroker/node_modules/node-schedule/lib/Invocation.js:268:28
2023-01-05 18:10:00.010 - warn: javascript.0 (519) at Timeout._onTimeout (/usr/local/iobroker/node_modules/node-schedule/lib/Invocation.js:228:7)
2023-01-05 18:10:00.011 - warn: javascript.0 (519) at listOnTimeout (node:internal/timers:564:17)
2023-01-05 18:10:00.011 - warn: javascript.0 (519) at processTimers (node:internal/timers:507:7)
Das ist doch wohl nicht normal, oder? Und das Skript muss ich noch ein bisschen umbenennen. Daran sollte es aber nicht liegen.
mfg
Special_B
@special_b sagte in Stromverbrauch protokollieren:
Das ist doch wohl nicht normal, oder?
doch!
wenn man keine ID zuweist ist das so. -
@special_b sagte in Stromverbrauch protokollieren:
Das ist doch wohl nicht normal, oder?
doch!
wenn man keine ID zuweist ist das so. -
@special_b sagte in Stromverbrauch protokollieren:
In Blockly
da hast du den Baustein aktualisiere ohne Datenpunkt ID
-
Ok, wenn ihr meint dass das mit einer CSV nichts ist, dann halt so.
Ich habe das Skript nachgebaut:
Bei der letzten Zeile habe ich eine Weile gebraucht. Laufender_Verbrauch habe ich ewig gesucht und das mit dem Datenpunkt "unterhalb 0_userdata.0 hab ich auch nicht verstanden was das sein soll. Aber irgendwann hab ich mir fast gedacht, dass das zusammenhängen muss. Dann hab ich 0_userdata gefunden und konnte da tatsächlich einen Datenpunkt anlegen. Zustandstyp Number ist richtig, oder?
Dann lasse ich das Skript mal laufen und beobachte diesen Datenpunkt.
Dann muss ich halt mal schauen wie ich daraus dann ein Diagramm erstellen kann.Danke euch schon mal.
Edit:
Ich bekomme Warnmeldungen im Log:
2023-01-05 18:10:00.008 - warn: javascript.0 (519) State "Object ID" not found
2023-01-05 18:10:00.010 - warn: javascript.0 (519) at setState (/usr/local/iobroker/node_modules/iobroker.javascript/lib/sandbox.js:1719:20)
2023-01-05 18:10:00.010 - warn: javascript.0 (519) at Object. (script.js.Stromzaehler_CSV:9:3)
2023-01-05 18:10:00.010 - warn: javascript.0 (519) at Job.job (/usr/local/iobroker/node_modules/iobroker.javascript/lib/sandbox.js:1595:34)
2023-01-05 18:10:00.010 - warn: javascript.0 (519) at Job.invoke (/usr/local/iobroker/node_modules/node-schedule/lib/Job.js:171:15)
2023-01-05 18:10:00.010 - warn: javascript.0 (519) at /usr/local/iobroker/node_modules/node-schedule/lib/Invocation.js:268:28
2023-01-05 18:10:00.010 - warn: javascript.0 (519) at Timeout._onTimeout (/usr/local/iobroker/node_modules/node-schedule/lib/Invocation.js:228:7)
2023-01-05 18:10:00.011 - warn: javascript.0 (519) at listOnTimeout (node:internal/timers:564:17)
2023-01-05 18:10:00.011 - warn: javascript.0 (519) at processTimers (node:internal/timers:507:7)
Das ist doch wohl nicht normal, oder? Und das Skript muss ich noch ein bisschen umbenennen. Daran sollte es aber nicht liegen.
mfg
Special_B
@special_b
Ich befürchte, da fehlt noch 'ne ganze Menge grundsätzliches Verständnis. Aber keine Sorge - das kriegen wir schon hin.Lösche zunächst mal den ersten „Aktualisiere“ Block.
Der soll ja einen DP aktualisieren den es gar nicht gibt. -
@special_b
Ich befürchte, da fehlt noch 'ne ganze Menge grundsätzliches Verständnis. Aber keine Sorge - das kriegen wir schon hin.Lösche zunächst mal den ersten „Aktualisiere“ Block.
Der soll ja einen DP aktualisieren den es gar nicht gibt.@codierknecht
Danke. Ja, da fehlt mir eine Menge grundsätzliches. Ich bin kein Programmierer und kenne mich mit dem Zeugs überhaupt nicht aus.Ich hab jetzt meinen ersten aktualisiere Block gelöscht, ja der hat keinen Sinn gemacht. Sehe ich jetzt auch. In einer Minute werde ich sehen ob jetzt wieder Fehler kommen.
Edit: Sieht gut aus. Jetzt muss ich mich mit Flot vertraut machen. Oder doch was anderes? Was würdet ihr mir empfehlen?
mfg
Special_B
-
So,
nachdem das Skript nun schon einen ganzen Tag lief und funktioniert, habe ich nun das Skript um eine Durchschnittsberechnung erweitert. Ich habe die Auswertung einfach nur jede Stunde laufen lassen. Schaut euch einfach das Skript mal an:
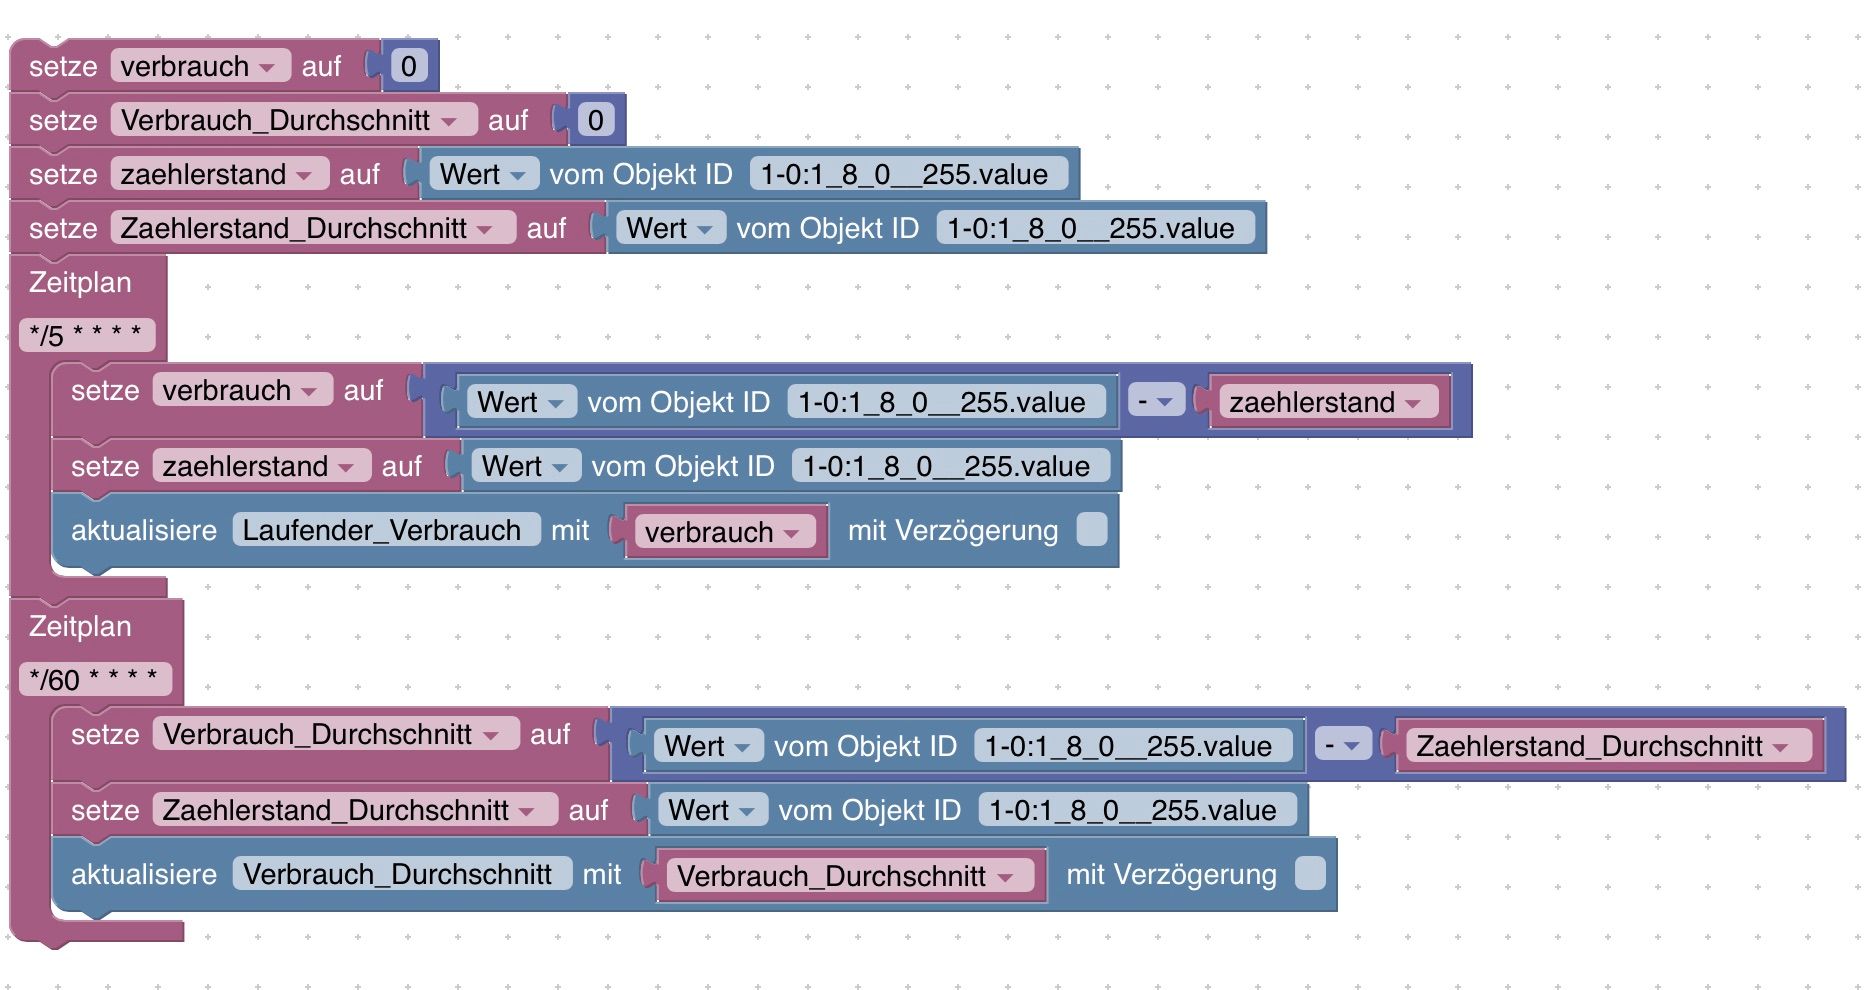
Oder wie würdet ihr das machen?
mfg
Special_B
-
Noch was, was mir nicht ganz so gefällt:
Das ist mein aktueller Stromverbrauch.
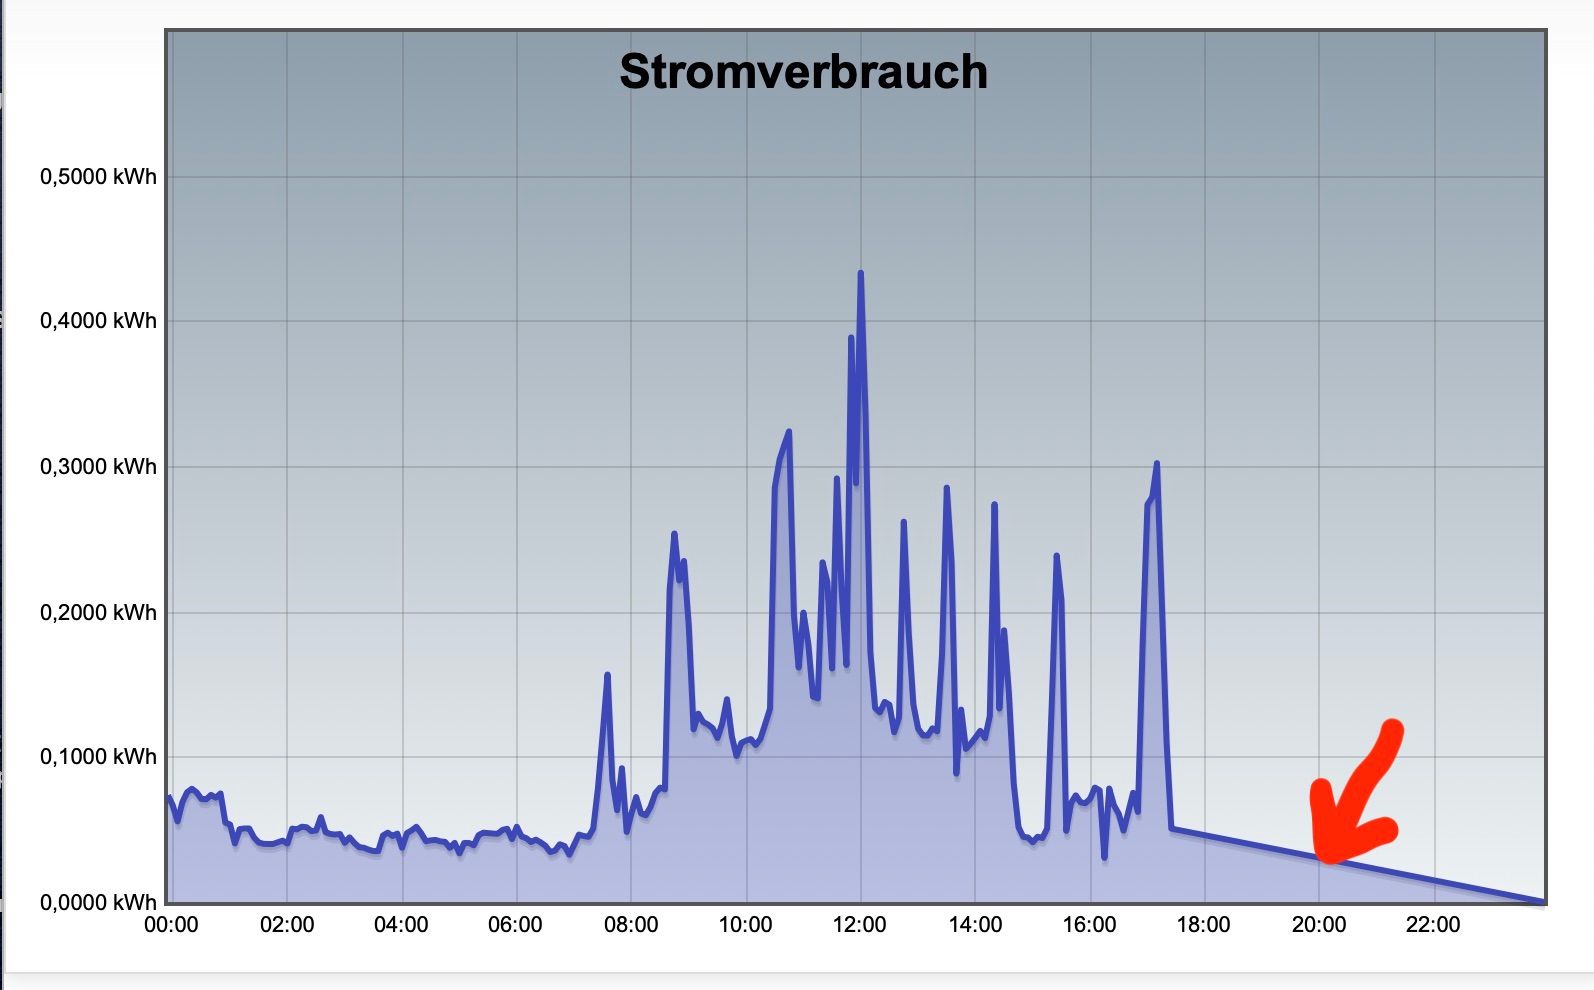
Gibt es eine Möglichkeit, die markierte Linie zu entfernen solange diese Werte noch nicht vorliegen?
mfg
Special_B
@special_b sagte in Stromverbrauch protokollieren:
Gibt es eine Möglichkeit, die markierte Linie zu entfernen solange diese Werte noch nicht vorliegen?
Ja!
NULL Werte ignorieren
-
@special_b sagte in Stromverbrauch protokollieren:
Gibt es eine Möglichkeit, die markierte Linie zu entfernen solange diese Werte noch nicht vorliegen?
Ja!
NULL Werte ignorieren
Danke, aber der Strich bleibt. Er geht jetzt nur waagerecht rüber. Oder muss ich da noch wo anders als in History was machen?
Die Durchschnittsberechnung hat natürlich auch nicht richtig funktioniert, da hätte ich vorher schon drauf kommen müssen. Jetzt scheint es aber zu funktionieren.mfg
Special_B
-
Danke, aber der Strich bleibt. Er geht jetzt nur waagerecht rüber. Oder muss ich da noch wo anders als in History was machen?
Die Durchschnittsberechnung hat natürlich auch nicht richtig funktioniert, da hätte ich vorher schon drauf kommen müssen. Jetzt scheint es aber zu funktionieren.mfg
Special_B
@special_b sagte in Stromverbrauch protokollieren:
Oder muss ich da noch wo anders als in History was machen?
wieso History? in flot!
@special_b sagte in Stromverbrauch protokollieren:
Die Durchschnittsberechnung hat natürlich auch nicht richtig funktioniert,
natürlich!
hat nix mit Visualisierung zu tun -
@special_b sagte in Stromverbrauch protokollieren:
Oder muss ich da noch wo anders als in History was machen?
wieso History? in flot!
@special_b sagte in Stromverbrauch protokollieren:
Die Durchschnittsberechnung hat natürlich auch nicht richtig funktioniert,
natürlich!
hat nix mit Visualisierung zu tun -
@homoran
🙈🙈🙈 Meinte ich doch. Da hab ich das geändert aber die Linie ist nicht weg. Na gut, damit könnte ich eventuell leben.mfg
Special_B
@special_b was hast du denn als Aggregation?
hilft bei Änderung?bei mir hört sie brav auf.
-
@special_b was hast du denn als Aggregation?
hilft bei Änderung?bei mir hört sie brav auf.
@homoran
Nein, bei Änderung hilft auch nichts.Ich habe bei Art minmax drin (auch die anderen Möglichkeiten bringen keine Änderung), Chart Typ ist Linie. Wenn ich dort Streudiagramm einstelle, sehe ich dass bis Tagesende kein Punkt kommt außer ganz am Rand. Dort ist noch ein Punkt. Dieser Punkt ist auch da, wenn ich beim Liniendiagramm die Punkte aktiviere.
Bei Zeit ist eingestellt: Art: relative, Ende ist Tagesende, Umfang ist 1 Tag, Autoupdate alle 5 Minuten (so wie halt die Daten aus dem Blockly Script kommen), Schritttyp ist Sekunden. Wobei Anzahl auch keine Änderung bringt weil im Feld darunter nichts eingegeben ist. Benutze X-Ticks ist auch nichts eingetragen.
mfg
Special_B
-
@homoran
Nein, bei Änderung hilft auch nichts.Ich habe bei Art minmax drin (auch die anderen Möglichkeiten bringen keine Änderung), Chart Typ ist Linie. Wenn ich dort Streudiagramm einstelle, sehe ich dass bis Tagesende kein Punkt kommt außer ganz am Rand. Dort ist noch ein Punkt. Dieser Punkt ist auch da, wenn ich beim Liniendiagramm die Punkte aktiviere.
Bei Zeit ist eingestellt: Art: relative, Ende ist Tagesende, Umfang ist 1 Tag, Autoupdate alle 5 Minuten (so wie halt die Daten aus dem Blockly Script kommen), Schritttyp ist Sekunden. Wobei Anzahl auch keine Änderung bringt weil im Feld darunter nichts eingegeben ist. Benutze X-Ticks ist auch nichts eingetragen.
mfg
Special_B
@special_b und welche Datenbank?
-
@special_b und welche Datenbank?
-
@special_b seltsam!
hab ich auch fast alles.
Wenn in deiner Nacherzählung kein Fehler drin, oder der Fehler nicht übersehen wurde weiß ich auch nichts mehr -
@special_b seltsam!
hab ich auch fast alles.
Wenn in deiner Nacherzählung kein Fehler drin, oder der Fehler nicht übersehen wurde weiß ich auch nichts mehr@homoran
Ich denke es liegt an dem Punkt am Ende des Diagramms, der immer auf Höhe des letzten Wertes liegt. Woher der allerdings kommt, ist mir ein Rätsel.Na gut, dann werde ich wohl damit leben müssen. Ist jetzt ja kein Weltuntergang.
Danke.
mfg
Special_B
Hey! Du scheinst an dieser Unterhaltung interessiert zu sein, hast aber noch kein Konto.
Hast du es satt, bei jedem Besuch durch die gleichen Beiträge zu scrollen? Wenn du dich für ein Konto anmeldest, kommst du immer genau dorthin zurück, wo du zuvor warst, und kannst dich über neue Antworten benachrichtigen lassen (entweder per E-Mail oder Push-Benachrichtigung). Du kannst auch Lesezeichen speichern und Beiträge positiv bewerten, um anderen Community-Mitgliedern deine Wertschätzung zu zeigen.
Mit deinem Input könnte dieser Beitrag noch besser werden 💗
Registrieren AnmeldenSupport us
314
Online33.0k
Benutzer83.3k
Themen1.3m
Beiträge