


-
@Mic sagte in [Vorlage] Google Charts Beispiel:
@Negalein
Super, so soll das sein
Ich überlege gerade, ob man nicht auch das "Line History Chart" vom Materials Design Widget Adapter von @Scrounger nutzen könnte alternativ. Also noch zu prüfen, ob das Widghet ausschließlich "History"-Datenpunkte akzeptiert oder auch eigene zur Darstellung.
Hab ein neues Widget hinzugefügt, JSON Chart. Als Quelle wird ein DP mit json string benötigt und man kann bar und line Charts mischen.
Alle verwendbraren Properties sind hier beschrieben:
https://github.com/Scrounger/ioBroker.vis-materialdesign#json-chartBeispiel:
{
	"axisLabels": ["Jan", "Feb", "Mrz", "asdsd"],
	"graphs": [
		{
			"data": ["80.4879", "40", "10", "30"],
			"legendText": "legend data 1",
			"type": "bar",
			"color": "blue",
			"barColorHover": "blue",
			"displayOrder": "2",
			"tooltip_AppendText": " %",
			"yAxis_appendix": " %",
			"tooltip_MaxDigits": "1",
			"yAxis_min": "0",
			"yAxis_max": "100",
			"yAxis_color": "red",
			"datalabel_maxDigits": "1"
		},
		{
			"data": ["35", "25", "88.1221243132", "10"],
			"legendText": "legend data 2",
			"type": "line",
			"displayOrder": "1",
			"line_Tension": "0.51",
			"line_Thikness": "1",
			"line_UseFillColor": "true",
			"tooltip_MaxDigits": "1",
			"tooltip_AppendText": " $",
			"yAxis_appendix": " $",
			"yAxis_position": "right",
			"yAxis_title_text": "axis title",
			"yAxis_title_color": "red",
			"yAxis_title_fontSize": "40",
			"yAxis_title_fontFamily": "Alegreya-BlackItalic",
			"yAxis_gridLines_show": "false"
		},
		{
			"data": ["23", "76", "66", "12"],
			"legendText": "legend data 3",
			"type": "bar",
			"displayOrder": "2",
			"tooltip_AppendText": " %",
			"yAxis_appendix": " %",
			"tooltip_MaxDigits": "1",
			"yAxis_min": "0",
			"yAxis_max": "100",
			"yAxis_color": "red",
			"datalabel_maxDigits": "1",
			"yAxis_id": "0"
		}
	]
}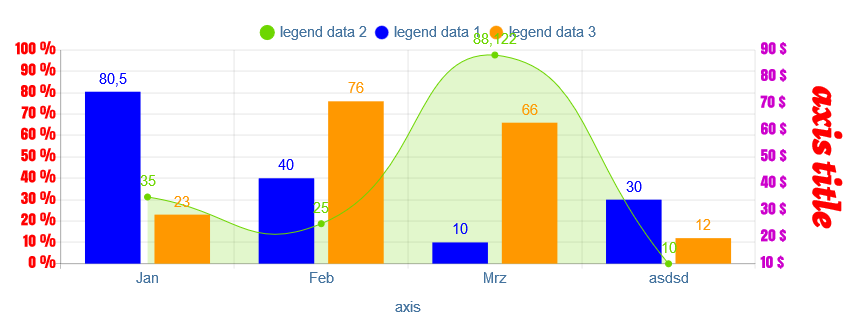
Bitte teste den aktuellen master -> v0.2.70.
Widget hat einen Debug Modus:
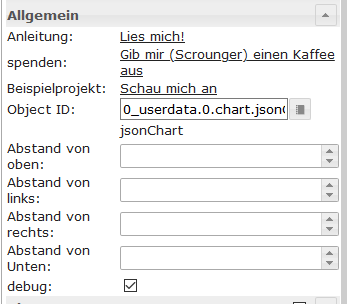
Wenn dir Fehler aufallen bitte debug modus aktivieren und consolen log vom browser mit posten.
@Scrounger sagte in Test Adapter Material Design Widgets v0.2.x:
Hab ein neues Widget hinzugefügt, JSON Chart.
Super Sache, vielen Dank hierfür

Funktioniert auch soweit gut bei mir.Ein paar Vorschläge:
-
Tippfehler Property
line_Thikness, Thikness --> Thickness -
y-Achsen-Layout: Wünschenswert wäre noch Option "Achsenberschriftung anzeigen true/false", also wie bei x-Achse. Als Workaround geht aber: Farbe auf transparent setzen.
-
Würde gerne beim Hochwert (y-Achse) Minimum- und Maximum-Grenzen setzen, damit ich mehreren Linien dieselben Min/Max-Grenzen geben kann.
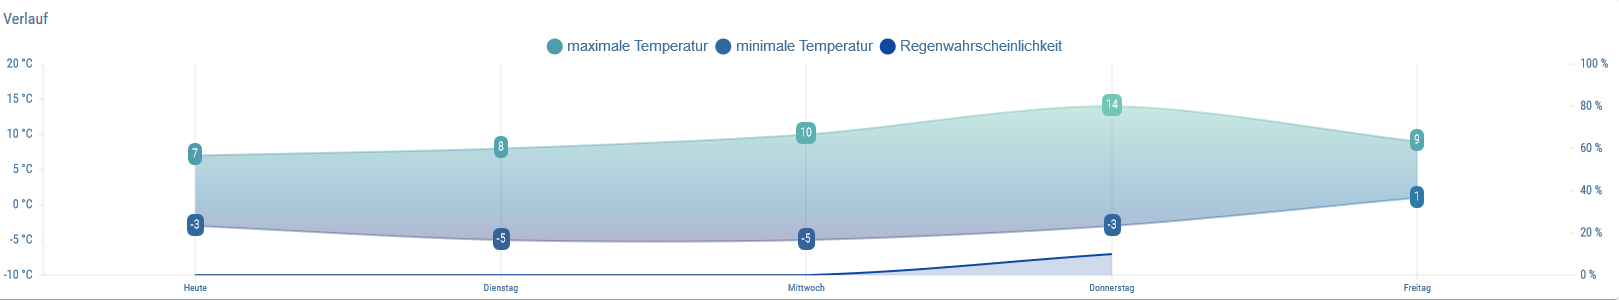
Use Case: Ich zeige die nächsten 7 Tage des daswetter-Adapters an. So sollte es etwa aussehen (nur ein Beispiel, Farben nicht gut gewählt usw.):
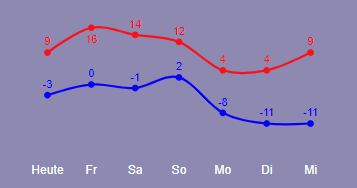
So sieht es aus:
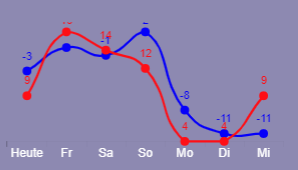
D.h. ich möchte beiden Linien dieselben Min/Max-Grenzen für die y-Achse zuordnen, daher wären Properties wieline_boundMinundline_boundMaxals JSON-Option sehr nice.
(die Ermittlung der min/max-Werte mache ich über JS - also kein Thema für das Widget)
Möchtest du Github-Issues jeweils für diese Punkte, oder passt das hier? Lege ich gerne an im Fall.
-
-
@Scrounger sagte in Test Adapter Material Design Widgets v0.2.x:
Hab ein neues Widget hinzugefügt, JSON Chart.
Super Sache, vielen Dank hierfür
Funktioniert auch soweit gut bei mir.Ein paar Vorschläge:
-
Tippfehler Property
line_Thikness, Thikness --> Thickness -
y-Achsen-Layout: Wünschenswert wäre noch Option "Achsenberschriftung anzeigen true/false", also wie bei x-Achse. Als Workaround geht aber: Farbe auf transparent setzen.
-
Würde gerne beim Hochwert (y-Achse) Minimum- und Maximum-Grenzen setzen, damit ich mehreren Linien dieselben Min/Max-Grenzen geben kann.
Use Case: Ich zeige die nächsten 7 Tage des daswetter-Adapters an. So sollte es etwa aussehen (nur ein Beispiel, Farben nicht gut gewählt usw.):
So sieht es aus:
D.h. ich möchte beiden Linien dieselben Min/Max-Grenzen für die y-Achse zuordnen, daher wären Properties wieline_boundMinundline_boundMaxals JSON-Option sehr nice.
(die Ermittlung der min/max-Werte mache ich über JS - also kein Thema für das Widget)
Möchtest du Github-Issues jeweils für diese Punkte, oder passt das hier? Lege ich gerne an im Fall.
@Mic sagte in Test Adapter Material Design Widgets v0.2.x:
- Tippfehler Property
line_Thikness, Thikness --> Thickness
korrigier ich
- y-Achsen-Layout: Wünschenswert wäre noch Option "Achsenberschriftung anzeigen true/false", also wie bei x-Achse. Als Workaround geht aber: Farbe auf transparent setzen.
gibt schon:

- Würde gerne beim Hochwert (y-Achse) Minimum- und Maximum-Grenzen setzen, damit ich mehreren Linien dieselben Min/Max-Grenzen geben kann.
gibts schon:

würde in deinem Fall beiden die gleiche
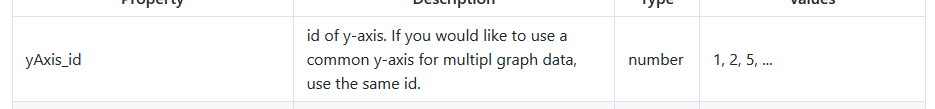
geben -> gemeinsame y-achse
-
-
@Mic sagte in Test Adapter Material Design Widgets v0.2.x:
- Tippfehler Property
line_Thikness, Thikness --> Thickness
korrigier ich
- y-Achsen-Layout: Wünschenswert wäre noch Option "Achsenberschriftung anzeigen true/false", also wie bei x-Achse. Als Workaround geht aber: Farbe auf transparent setzen.
gibt schon:
- Würde gerne beim Hochwert (y-Achse) Minimum- und Maximum-Grenzen setzen, damit ich mehreren Linien dieselben Min/Max-Grenzen geben kann.
gibts schon:
würde in deinem Fall beiden die gleiche
geben -> gemeinsame y-achse
- Tippfehler Property
-
@Scrounger
Perfekt, danke für die Hilfe, hast ja schon wirklich alles bedacht und implementiert. Schön auch die PropertyyAxis_id, dann muss man nichts zusätzlich programmieren.
-
@Scrounger sagte in Test Adapter Material Design Widgets v0.2.x:
Hab ein neues Widget hinzugefügt, JSON Chart.
Super Sache, vielen Dank hierfür
Funktioniert auch soweit gut bei mir.Ein paar Vorschläge:
-
Tippfehler Property
line_Thikness, Thikness --> Thickness -
y-Achsen-Layout: Wünschenswert wäre noch Option "Achsenberschriftung anzeigen true/false", also wie bei x-Achse. Als Workaround geht aber: Farbe auf transparent setzen.
-
Würde gerne beim Hochwert (y-Achse) Minimum- und Maximum-Grenzen setzen, damit ich mehreren Linien dieselben Min/Max-Grenzen geben kann.
Use Case: Ich zeige die nächsten 7 Tage des daswetter-Adapters an. So sollte es etwa aussehen (nur ein Beispiel, Farben nicht gut gewählt usw.):
So sieht es aus:
D.h. ich möchte beiden Linien dieselben Min/Max-Grenzen für die y-Achse zuordnen, daher wären Properties wieline_boundMinundline_boundMaxals JSON-Option sehr nice.
(die Ermittlung der min/max-Werte mache ich über JS - also kein Thema für das Widget)
Möchtest du Github-Issues jeweils für diese Punkte, oder passt das hier? Lege ich gerne an im Fall.
@Mic sagte in Test Adapter Material Design Widgets v0.2.x:
Use Case: Ich zeige die nächsten 7 Tage des daswetter-Adapters an. So sollte es etwa aussehen (nur ein Beispiel, Farben nicht gut gewählt usw.):
Hab noch eingebaut, dass man Arrays für colors verwenden kann. Damit kann man dann Temperaturverläufe farbig darstellen.
Anbei ein Beispiel, wo ich die chroma-js lib nutze um das zu realisieren:
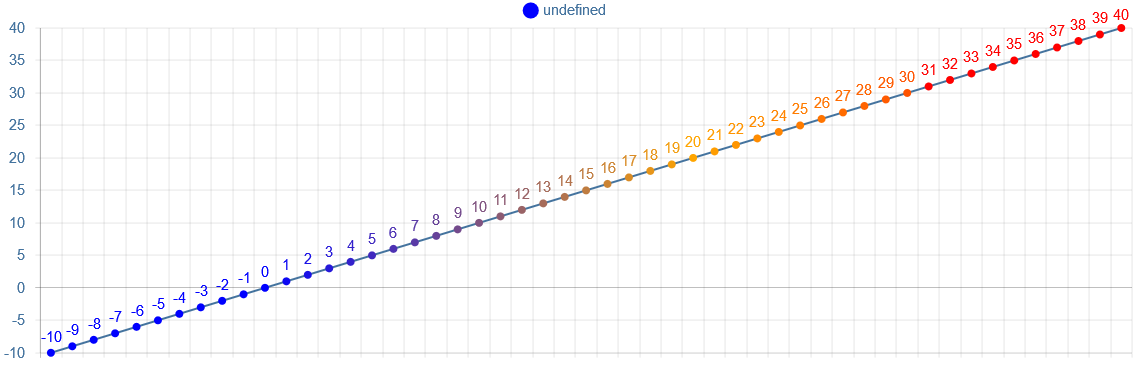
Skript:
const chroma = require("chroma-js")

let chart = {}
let values = []
let axisLabels = []
let colors = [];

for (var i = -10; i <= 40; i++) {
    axisLabels.push('');
    values.push(i);

    colors.push(getColor(i));
}

chart = {
    axisLabels: axisLabels,
    graphs: [{
        data: values,
        type: 'line',
        datalabel_color: colors,
        line_PointColor: colors,
        line_PointColorBorder: colors
    }]
}

function getColor(temp) {
    let scale = chroma.scale(['blue', 'orange', 'red']);

    let tempMax = 30;
    let tempMin = -10;


    if (temp > tempMax) {
        return scale(1).hex();
    } else if (temp < tempMin) {
        return scale(0).hex();
    } else {
        return scale(temp / (tempMax - tempMin)).hex();
    }
}

setState('0_userdata.0.chart.tempColors', JSON.stringify(chart), true);
Verlauf für die Linienfarbe wird aktuell von der API nicht unterstützt, issue gibt es aber schon dazu:https://github.com/chartjs/Chart.js/issues/4895
Funktioniert mit der aktuellen master von git -> v0.2.71
-
-
Hi,
ich bin gerade dabei etwas zum Repo beizutragen und wollte fragen, wie man seine eigenen Änderungen im ioBroker testet? Pushe ich die Änderungen erst in meinen Fork und installiere diesen dann mit ioBroker?
Und wie fasse ich die ganzen einzelnen.js-Dateien zuwidgets.min.jszusammen?
Edit: verschoben, da Frage Fehlerbehbung betrifft und nicht Widget Einstellung
-
Hi,
ich bin gerade dabei etwas zum Repo beizutragen und wollte fragen, wie man seine eigenen Änderungen im ioBroker testet? Pushe ich die Änderungen erst in meinen Fork und installiere diesen dann mit ioBroker?
Und wie fasse ich die ganzen einzelnen.js-Dateien zuwidgets.min.jszusammen?Edit: verschoben, da Frage Fehlerbehbung betrifft und nicht Widget Einstellung
-
@KLVN sagte in Test Adapter Material Design Widgets v0.2.x:
Und wie fasse ich die ganzen einzelnen
.js-Dateien zuwidgets.min.jszusammen?Lass die Daten am besten raus, das führe ich dann zusammen.
@Scrounger Danke, habe deine Anmerkungen gerade ausgebessert.
Wie kann ich meine Änderungen vorher testen? Ich weiß nicht, wie man die ganzen .min-Files erstellt und dabei sind es genau die, die ich beim Testen brauche. Die erste Änderung mit dem Tippfehler konnte ich noch auf unschöne Art in der .min fixen, aber eine weitere Sache, die ich gerne implementieren würde, hat auf diese Weise nicht so gefruchtet. -
@Scrounger Danke, habe deine Anmerkungen gerade ausgebessert.
Wie kann ich meine Änderungen vorher testen? Ich weiß nicht, wie man die ganzen .min-Files erstellt und dabei sind es genau die, die ich beim Testen brauche. Die erste Änderung mit dem Tippfehler konnte ich noch auf unschöne Art in der .min fixen, aber eine weitere Sache, die ich gerne implementieren würde, hat auf diese Weise nicht so gefruchtet.Zu erst die .min. Dateien dürfen nicht manuell bearbeitet werden!
Ich verwende VS Code mit dem Plugin Minify, dass jedesmal nach dem speichern die *.min Dateien automatisch aus allen Dateien des Ordners erzeugt.
Alternativ kannst du auch in der *.html Datei die Verweise auf die *.js Dateien setzten - ist für den Beginn sicher einfacher. Wichtig Reihenfolge beachten, die helper .js dateinen müssen als erstes importiert werden.Wie man die Änderungen testen kann ist hier beschrieben:
https://github.com/ioBroker/ioBroker.docs/blob/master/docs/de/dev/adaptervis.md -
@Scrounger sagte in Test Adapter Material Design Widgets v0.2.x:
Hab ein neues Widget hinzugefügt, JSON Chart.
Super Sache, vielen Dank hierfür
Funktioniert auch soweit gut bei mir.Ein paar Vorschläge:
-
Tippfehler Property
line_Thikness, Thikness --> Thickness -
y-Achsen-Layout: Wünschenswert wäre noch Option "Achsenberschriftung anzeigen true/false", also wie bei x-Achse. Als Workaround geht aber: Farbe auf transparent setzen.
-
Würde gerne beim Hochwert (y-Achse) Minimum- und Maximum-Grenzen setzen, damit ich mehreren Linien dieselben Min/Max-Grenzen geben kann.
Use Case: Ich zeige die nächsten 7 Tage des daswetter-Adapters an. So sollte es etwa aussehen (nur ein Beispiel, Farben nicht gut gewählt usw.):
So sieht es aus:
D.h. ich möchte beiden Linien dieselben Min/Max-Grenzen für die y-Achse zuordnen, daher wären Properties wieline_boundMinundline_boundMaxals JSON-Option sehr nice.
(die Ermittlung der min/max-Werte mache ich über JS - also kein Thema für das Widget)
Möchtest du Github-Issues jeweils für diese Punkte, oder passt das hier? Lege ich gerne an im Fall.
@Mic
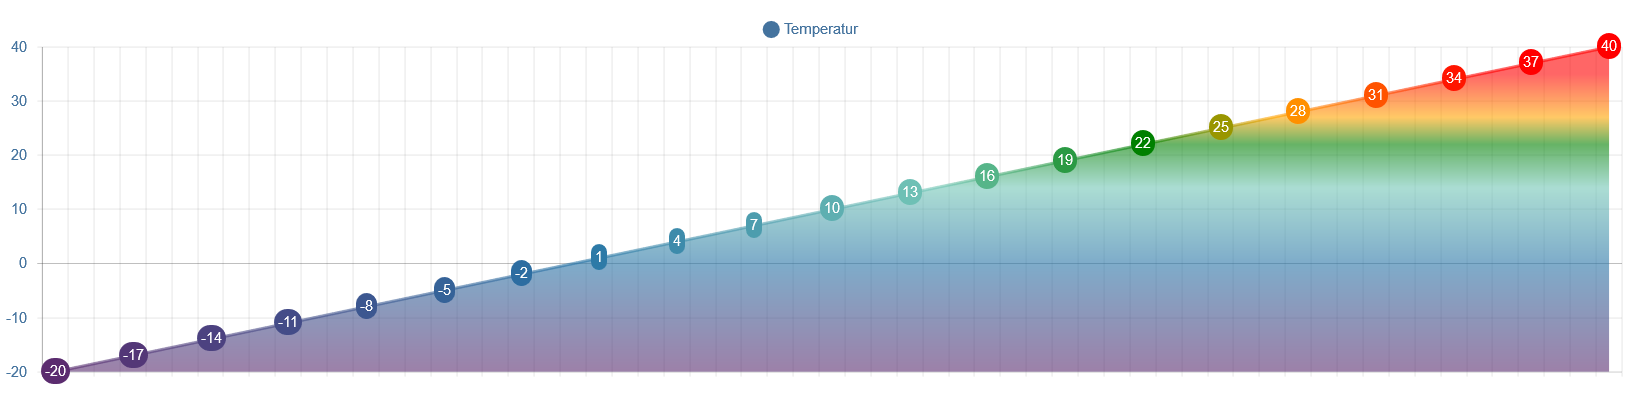
Hab nochmal nen bissle weiter am JSON Chart gebastelt. Jetzt kann man damit auch Farbverläufe für Line und Füllfarbe verwenden.Anbei ein Beispiel:
Skript:
const chromaJs = require("chroma-js")

let chart = {}
let values = []
let axisLabels = []
let colors = [];

let fakeLine = [];

let gradientChartColors = [                                                                           // Gradient Farben für Charts, value = Temperatur
    { value: -20, color: '#5b2c6f' },
    { value: 0, color: '#2874a6' },
    { value: 14, color: '#73c6b6' },
    { value: 22, color: '#008000' },
    { value: 27, color: '#FFA500' },
    { value: 35, color: '#FF0000' }
]

let gradientColors = getGradientColors(-20, 40, gradientChartColors);

for (var i = -20; i <= 40; i++) {
    axisLabels.push('');

    let val = randomIntFromInterval(-15, 40)

    values.push(i);
    colors.push(gradientColors.getColorByValue(i));


    fakeLine.push(-20);
}

chart = {
    axisLabels: axisLabels,
    graphs: [
        {
            data: values,
            type: 'line',
            datalabel_color: 'white',
            datalabel_backgroundColor: colors,
            datalabel_offset: -12,
            // line_PointColor: colors,
            // line_PointColorBorder: colors,
            line_pointSize: 0,
            line_Thickness: 3,
            datalabel_show: true,
            datalabel_borderRadius: 15,
            legendText: 'Temperatur',
            yAxis_id: 0,
            yAxis_gridLines_show: true,
            yAxis_gridLines_border_show: true,
            yAxis_gridLines_ticks_show: true,
            yAxis_showTicks: false,
            yAxis_zeroLineWidth: 0.4,
            line_UseFillColor: true,
            datalabel_steps: 3,
            use_gradient_color: true,
            gradient_color: gradientChartColors,
            use_line_gradient_fill_color: true,
            line_gradient_fill_color: gradientColors.getGradientWithOpacity(60),
            line_FillBetweenLines: '+1'
        },
        {
            data: fakeLine,
            type: 'line',
            datalabel_color: 'transparent',
            datalabel_backgroundColor: colors,
            // line_PointColor: colors,
            // line_PointColorBorder: colors,
            line_pointSize: 0,
            line_Thickness: 0,
            datalabel_borderRadius: 15,
            yAxis_id: 0,
            datalabel_show: false,
        }
    ]
}

function getGradientColors(min, max, colorValArray) {
    let delta = max - min;

    let chromaColors = []
    let chromaDomains = [];

    for (const item of colorValArray) {
        chromaColors.push(item.color);
        chromaDomains.push(item.value / delta);
    }
    let chroma = chromaJs.scale(chromaColors).domain(chromaDomains);

    return {
        getColorByValue: function (val) {
            if (val > max) {
                return chroma(1).hex();
            } else if (val < min) {
                return chroma(0).hex();
            } else {
                return chroma(val / delta).hex();
            }
        },
        getGradientWithOpacity: function (opacity) {
            colorValArray.forEach(item => {
                item.color = chromaJs(item.color).alpha(opacity / 100).hex();
            });
            return colorValArray;
        }
    }
}

function randomIntFromInterval(min, max) { // min and max included
    return Math.floor(Math.random() * (max - min + 1) + min);
}

setState('0_userdata.0.chart.tempColors', JSON.stringify(chart), true);
Funktioniert mit der aktuellen master von git -> v0.2.74
Weiter kann man jetzt auf Füllfarbe zwischen zwei Linien realisieren, sieht dann z.B. so aus.
Ein Beispiel dazu ist auch im obigen Skript - property
line_FillBetweenLines -
-
@Mic
Hab nochmal nen bissle weiter am JSON Chart gebastelt. Jetzt kann man damit auch Farbverläufe für Line und Füllfarbe verwenden.Anbei ein Beispiel:
Skript:
const chromaJs = require("chroma-js")

let chart = {}
let values = []
let axisLabels = []
let colors = [];

let fakeLine = [];

let gradientChartColors = [                                                                           // Gradient Farben für Charts, value = Temperatur
    { value: -20, color: '#5b2c6f' },
    { value: 0, color: '#2874a6' },
    { value: 14, color: '#73c6b6' },
    { value: 22, color: '#008000' },
    { value: 27, color: '#FFA500' },
    { value: 35, color: '#FF0000' }
]

let gradientColors = getGradientColors(-20, 40, gradientChartColors);

for (var i = -20; i <= 40; i++) {
    axisLabels.push('');

    let val = randomIntFromInterval(-15, 40)

    values.push(i);
    colors.push(gradientColors.getColorByValue(i));


    fakeLine.push(-20);
}

chart = {
    axisLabels: axisLabels,
    graphs: [
        {
            data: values,
            type: 'line',
            datalabel_color: 'white',
            datalabel_backgroundColor: colors,
            datalabel_offset: -12,
            // line_PointColor: colors,
            // line_PointColorBorder: colors,
            line_pointSize: 0,
            line_Thickness: 3,
            datalabel_show: true,
            datalabel_borderRadius: 15,
            legendText: 'Temperatur',
            yAxis_id: 0,
            yAxis_gridLines_show: true,
            yAxis_gridLines_border_show: true,
            yAxis_gridLines_ticks_show: true,
            yAxis_showTicks: false,
            yAxis_zeroLineWidth: 0.4,
            line_UseFillColor: true,
            datalabel_steps: 3,
            use_gradient_color: true,
            gradient_color: gradientChartColors,
            use_line_gradient_fill_color: true,
            line_gradient_fill_color: gradientColors.getGradientWithOpacity(60),
            line_FillBetweenLines: '+1'
        },
        {
            data: fakeLine,
            type: 'line',
            datalabel_color: 'transparent',
            datalabel_backgroundColor: colors,
            // line_PointColor: colors,
            // line_PointColorBorder: colors,
            line_pointSize: 0,
            line_Thickness: 0,
            datalabel_borderRadius: 15,
            yAxis_id: 0,
            datalabel_show: false,
        }
    ]
}

function getGradientColors(min, max, colorValArray) {
    let delta = max - min;

    let chromaColors = []
    let chromaDomains = [];

    for (const item of colorValArray) {
        chromaColors.push(item.color);
        chromaDomains.push(item.value / delta);
    }
    let chroma = chromaJs.scale(chromaColors).domain(chromaDomains);

    return {
        getColorByValue: function (val) {
            if (val > max) {
                return chroma(1).hex();
            } else if (val < min) {
                return chroma(0).hex();
            } else {
                return chroma(val / delta).hex();
            }
        },
        getGradientWithOpacity: function (opacity) {
            colorValArray.forEach(item => {
                item.color = chromaJs(item.color).alpha(opacity / 100).hex();
            });
            return colorValArray;
        }
    }
}

function randomIntFromInterval(min, max) { // min and max included
    return Math.floor(Math.random() * (max - min + 1) + min);
}

setState('0_userdata.0.chart.tempColors', JSON.stringify(chart), true);
Funktioniert mit der aktuellen master von git -> v0.2.74
Weiter kann man jetzt auf Füllfarbe zwischen zwei Linien realisieren, sieht dann z.B. so aus.
Ein Beispiel dazu ist auch im obigen Skript - property
line_FillBetweenLines@Scrounger Sieht Spannend aus. Hast du schon ein Beispiel wie man aus einem DP mit SQL Historie das neue Chart befüllen kann?
Proxmox-ioBroker-Redis-HA Doku: https://forum.iobroker.net/topic/47478/dokumentation-einer-proxmox-iobroker-redis-ha-umgebung
-
@Scrounger Sieht Spannend aus. Hast du schon ein Beispiel wie man aus einem DP mit SQL Historie das neue Chart befüllen kann?
@darkiop
Nein hab bis jetzt dafür noch keinen UseCase.
Grundsätzlich kann man wie hier beschrieben vorgehen:
https://forum.iobroker.net/topic/2344/script-um-sql-auszulesenUnd Daten muss man danach nur noch richtig formatieren und an den JSON Chart übergeben.
So mal die Theorie ;-)Hätte auch den Vorteil ggü. dem Line Chart, dass die ganze Datenaufbereitung serverseitg dann läuft - mhh vielleicht doch grad ein UseCase gefunden

-
Hi,
ich versuche den "Line History Chart" einzubinden und stoße dabei auf folgendes Probelem:
- Obwohl beide Datenpunkte meiner Meinung nach richtig angelegt sind, wird mir nur einer angezeigt
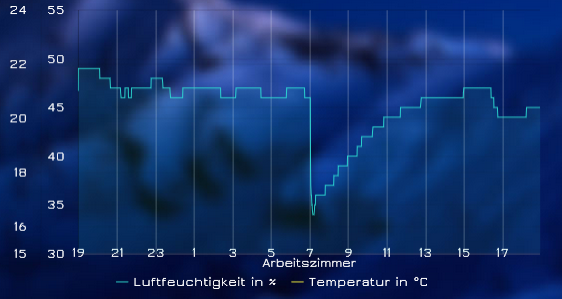
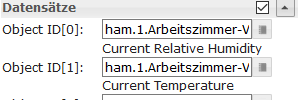
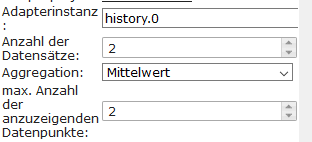
Hat jemand einen Rat?
-
-
Hallo zusammen,
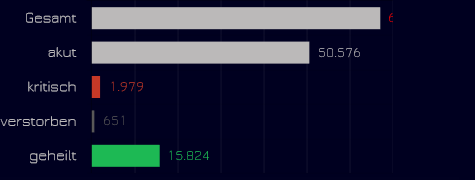
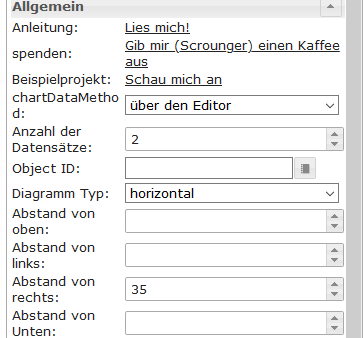
habe mir ein Bar-Chart erstellt. Leider bekomme ich die Werte bei den größten Datensätzen nicht angezeigt, da sie die Breite des Widgets überschreiten. Gibt es dazu einen Tipp oder ist das ein Bug?
Es geht um die abgeschnittenen Werte "Gesamt". Ein Überlagern durch andere Widgets kann ausgeschlossen werden.
VG -
Hallo zusammen,
habe mir ein Bar-Chart erstellt. Leider bekomme ich die Werte bei den größten Datensätzen nicht angezeigt, da sie die Breite des Widgets überschreiten. Gibt es dazu einen Tipp oder ist das ein Bug?
Es geht um die abgeschnittenen Werte "Gesamt". Ein Überlagern durch andere Widgets kann ausgeschlossen werden.
VG -
hallo @Scrounger
kann man den minimal bzw maximal Wert auch mit gebrochenen Zahlen festlegen?
Für dieselpreise würde ich gern min. 0,95 und max 1,30 angeben. Mit ganzen Zahlen lässt es sich grafisch nicht ganz so schön darstellen. -
@sveni_lee
Welches Widget? Wo willst du was eingeben?
Sorry aber ich versteh die Frage nicht.
Hello! It looks like you're interested in this conversation, but you don't have an account yet.
Getting fed up of having to scroll through the same posts each visit? When you register for an account, you'll always come back to exactly where you were before, and choose to be notified of new replies (either via email, or push notification). You'll also be able to save bookmarks and upvote posts to show your appreciation to other community members.
With your input, this post could be even better 💗
Register LoginSupport us
249
Online33.0k
Users83.4k
Topics1.3m
Posts