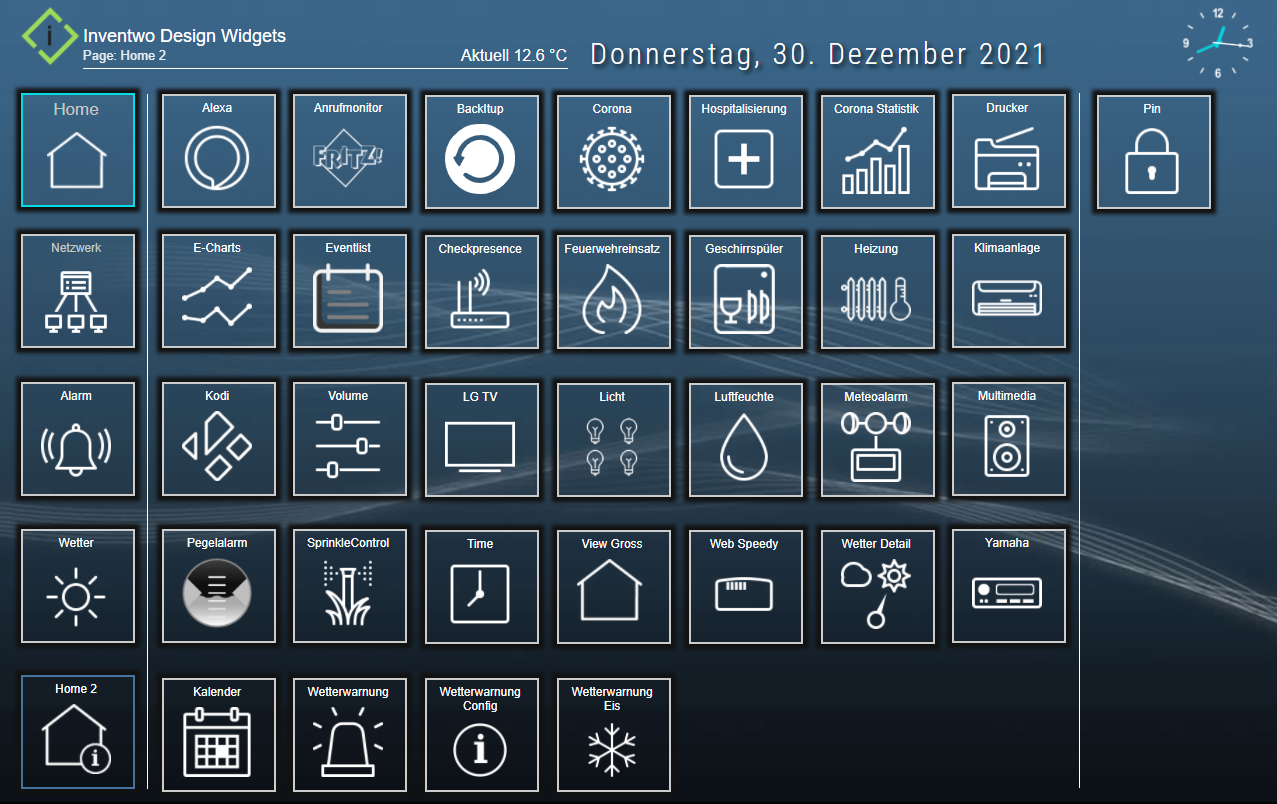
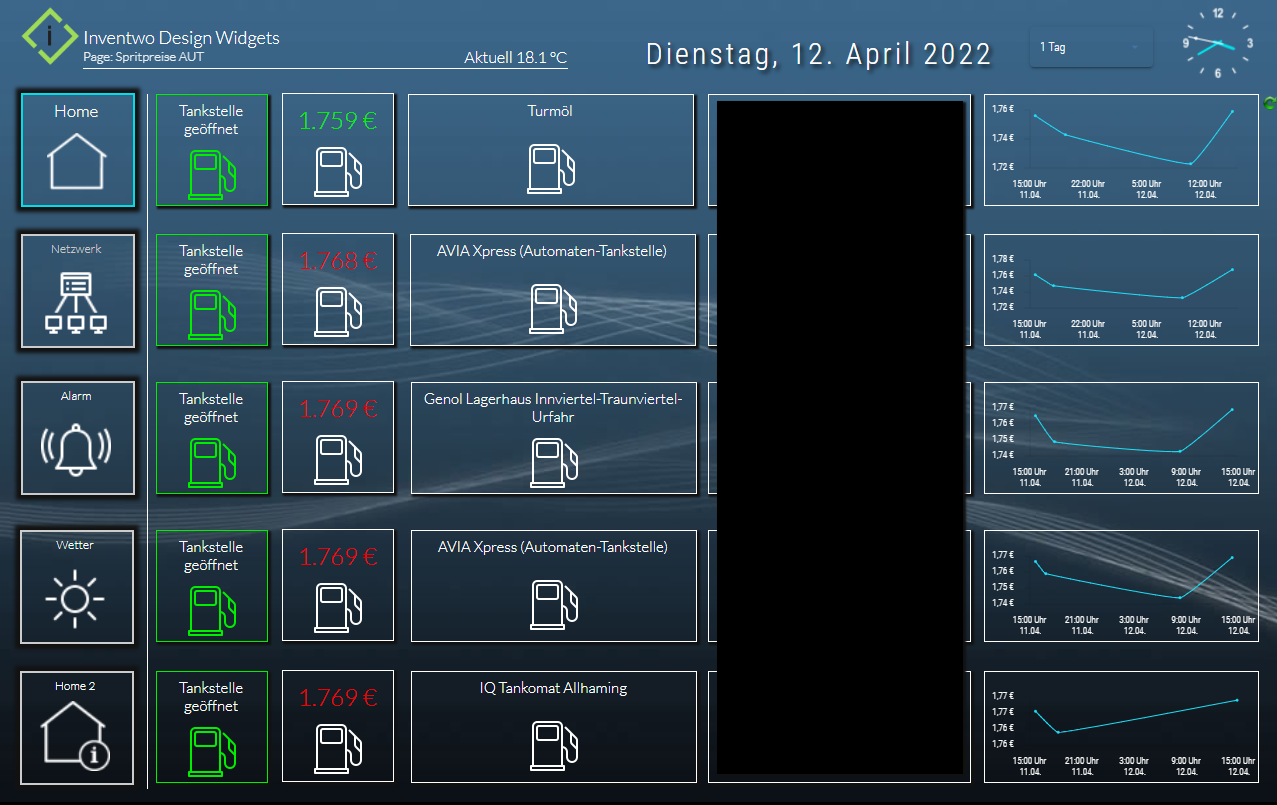
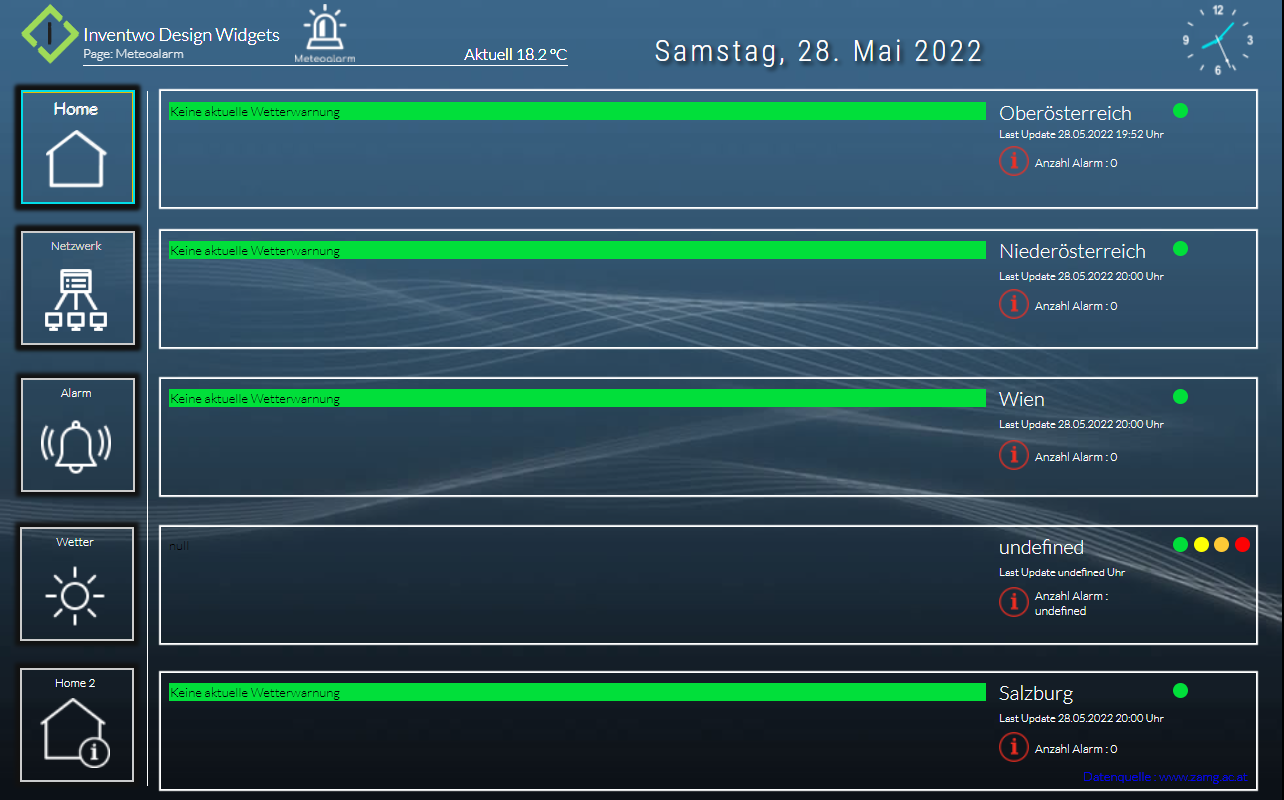
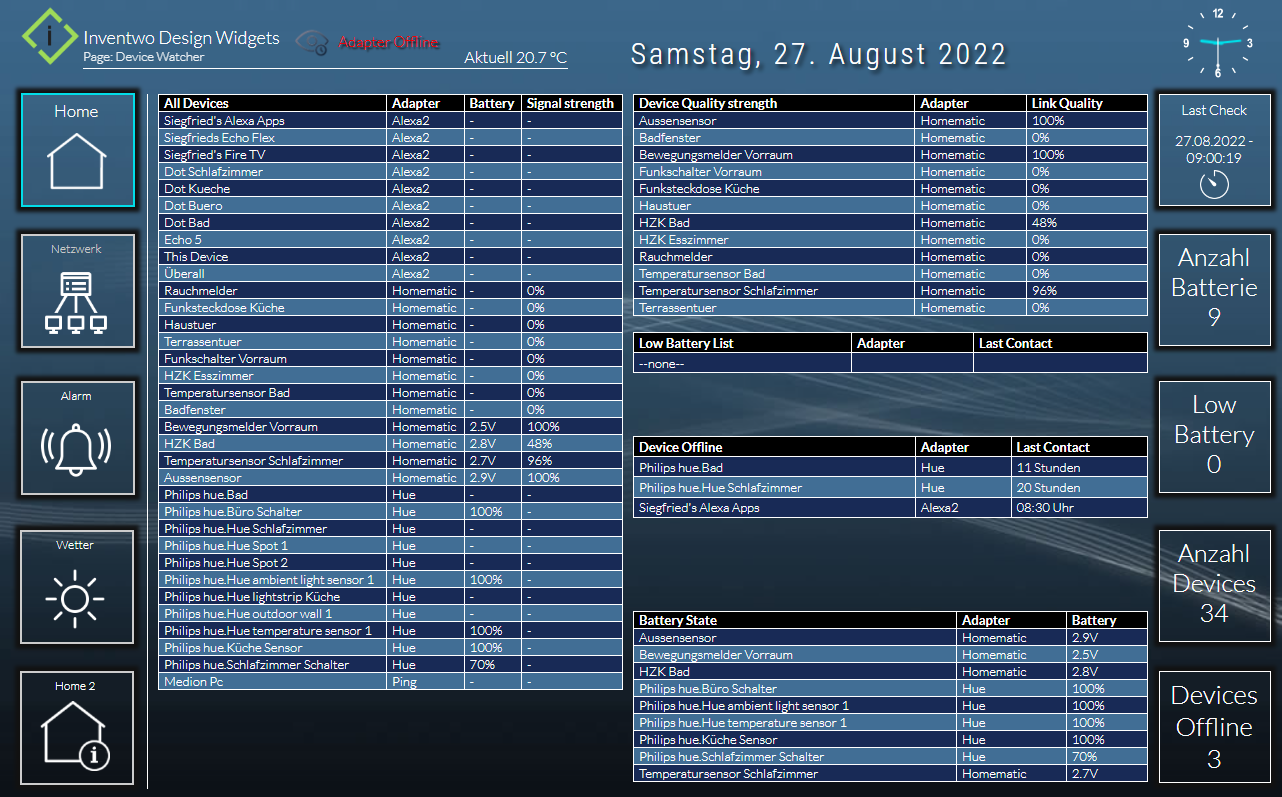
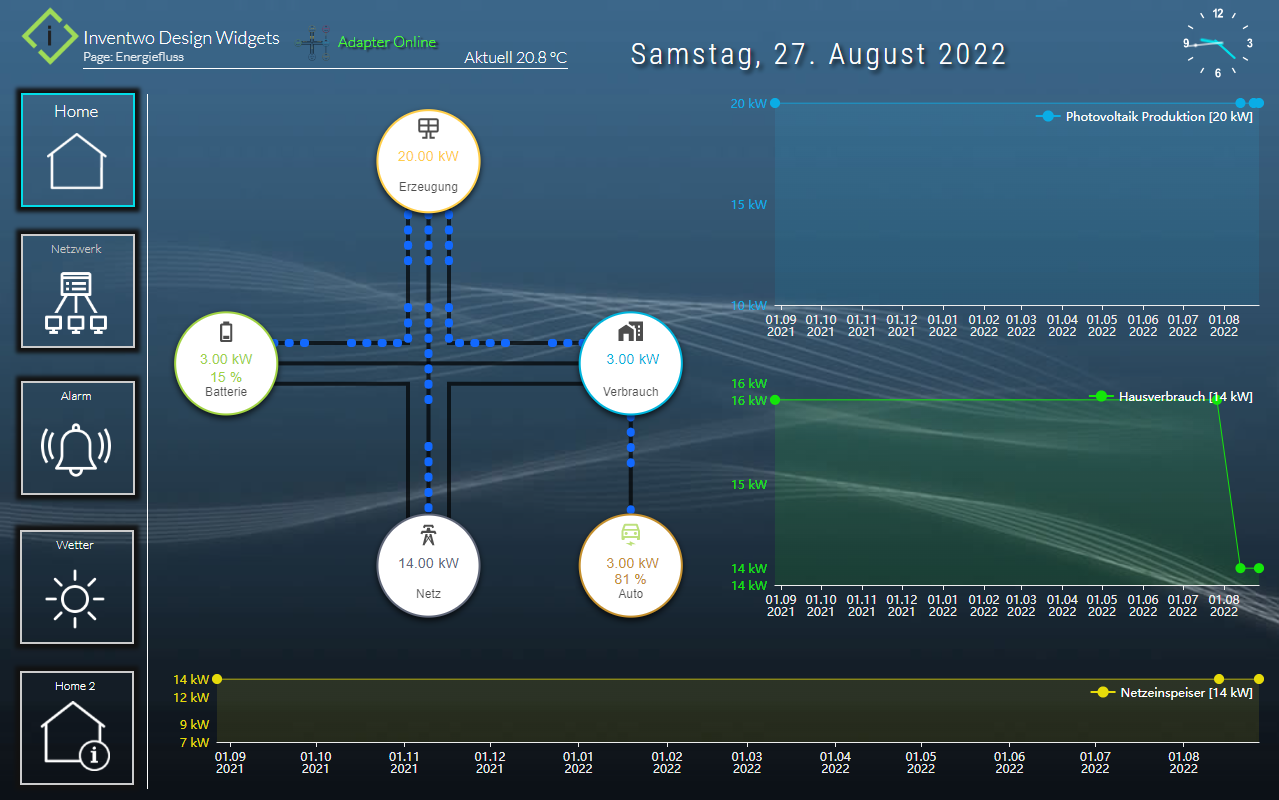
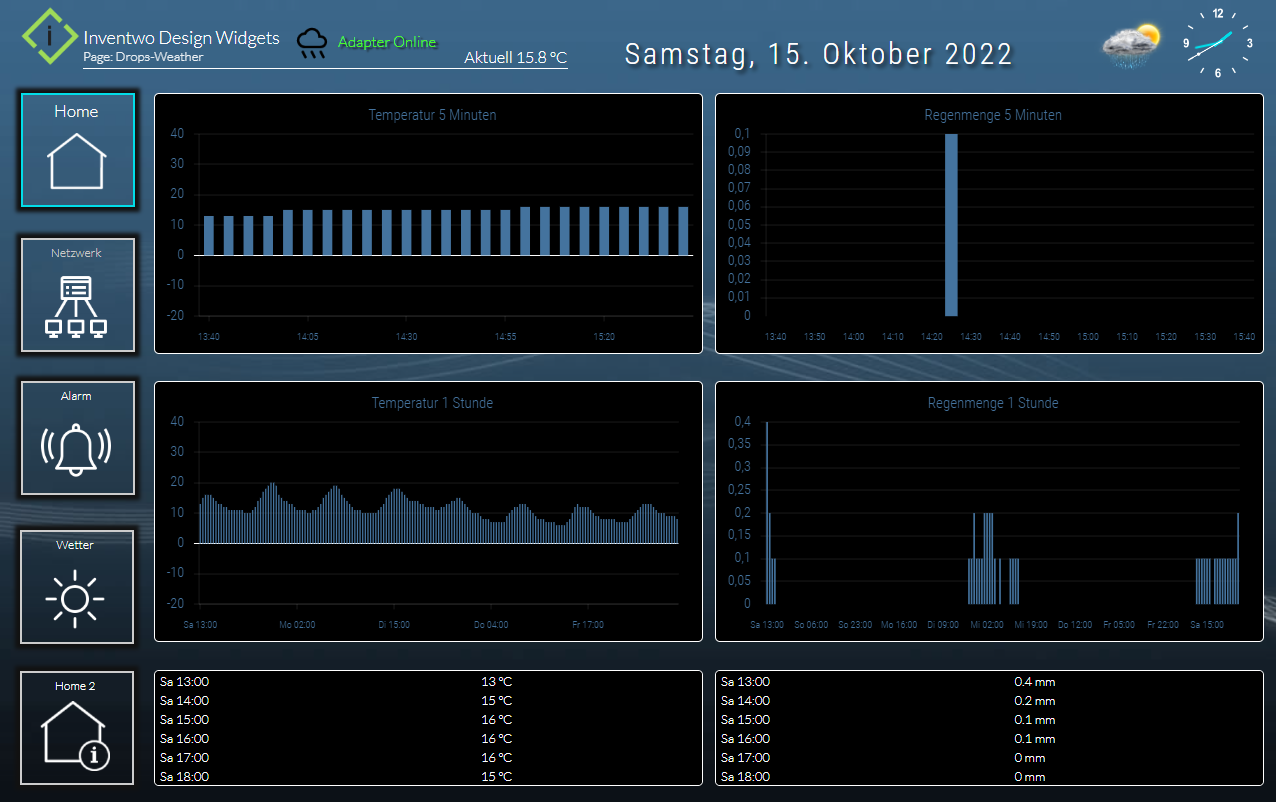
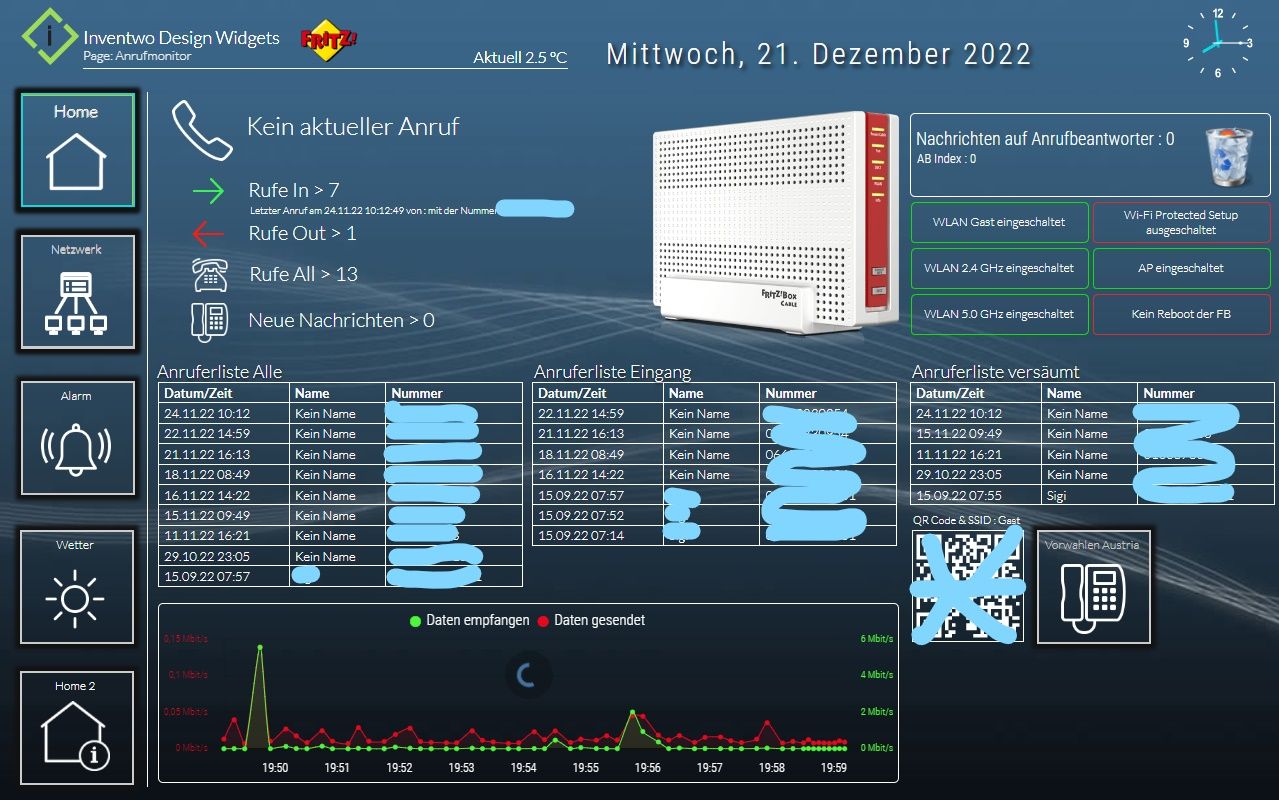
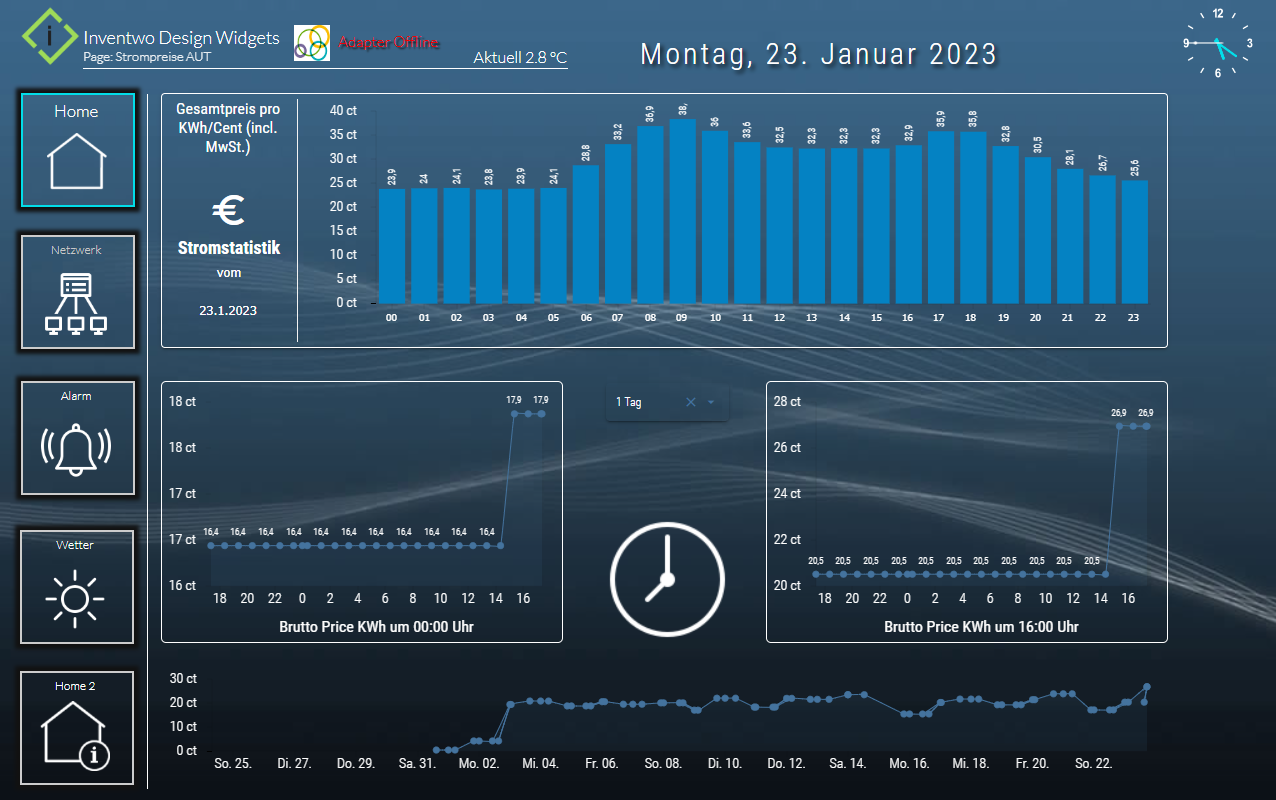
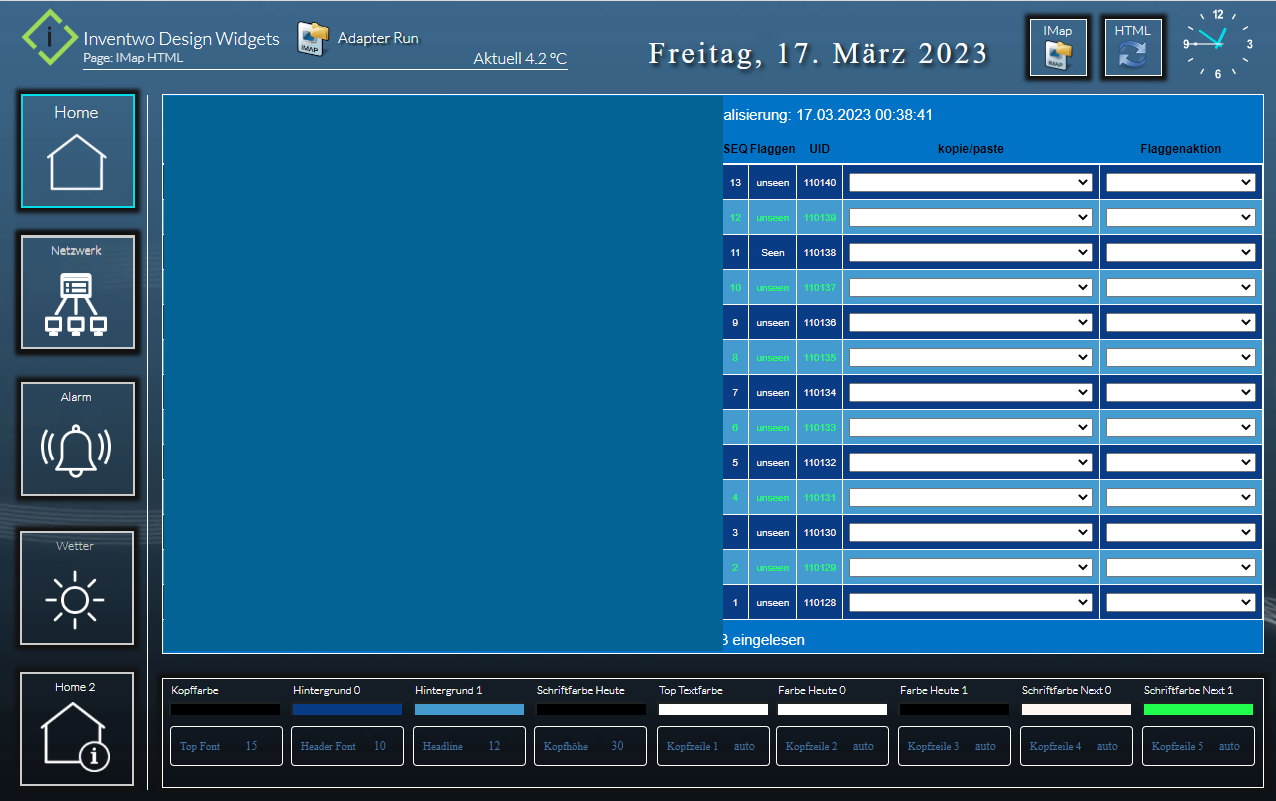
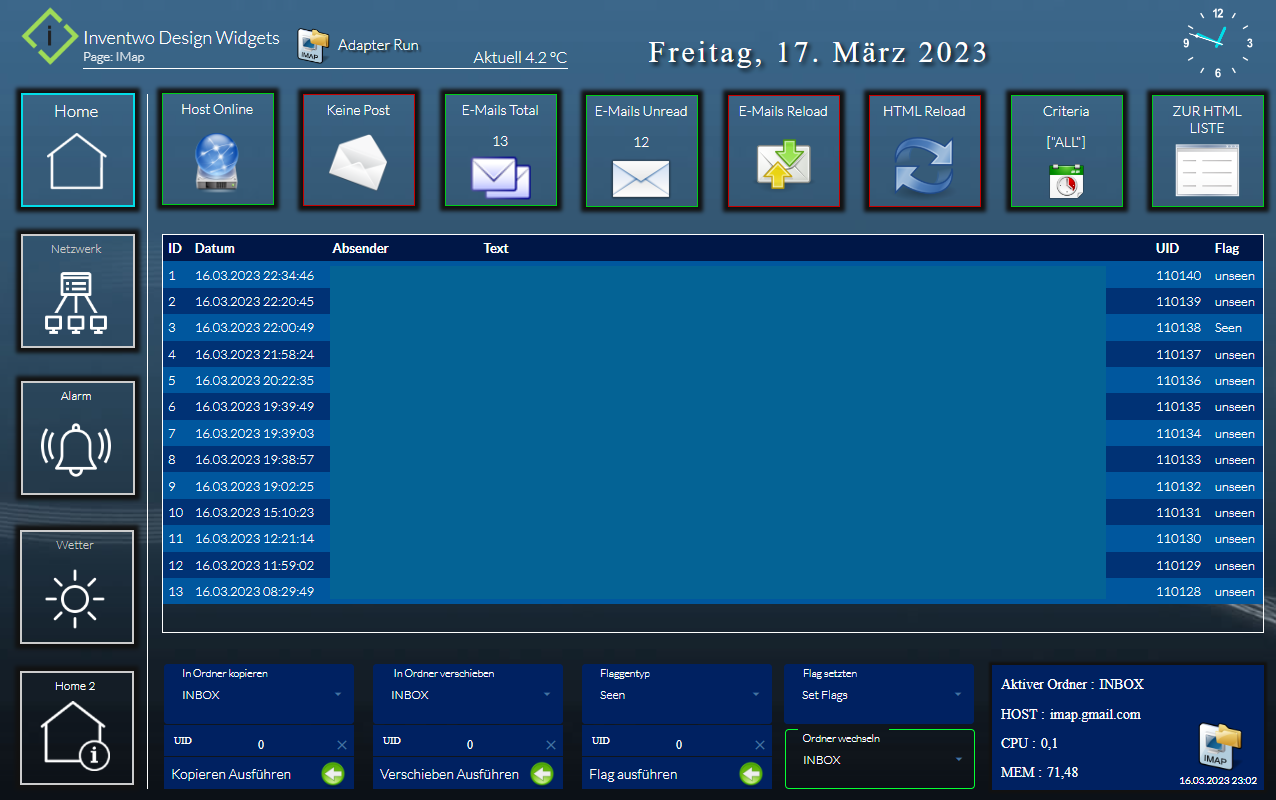
NEWS
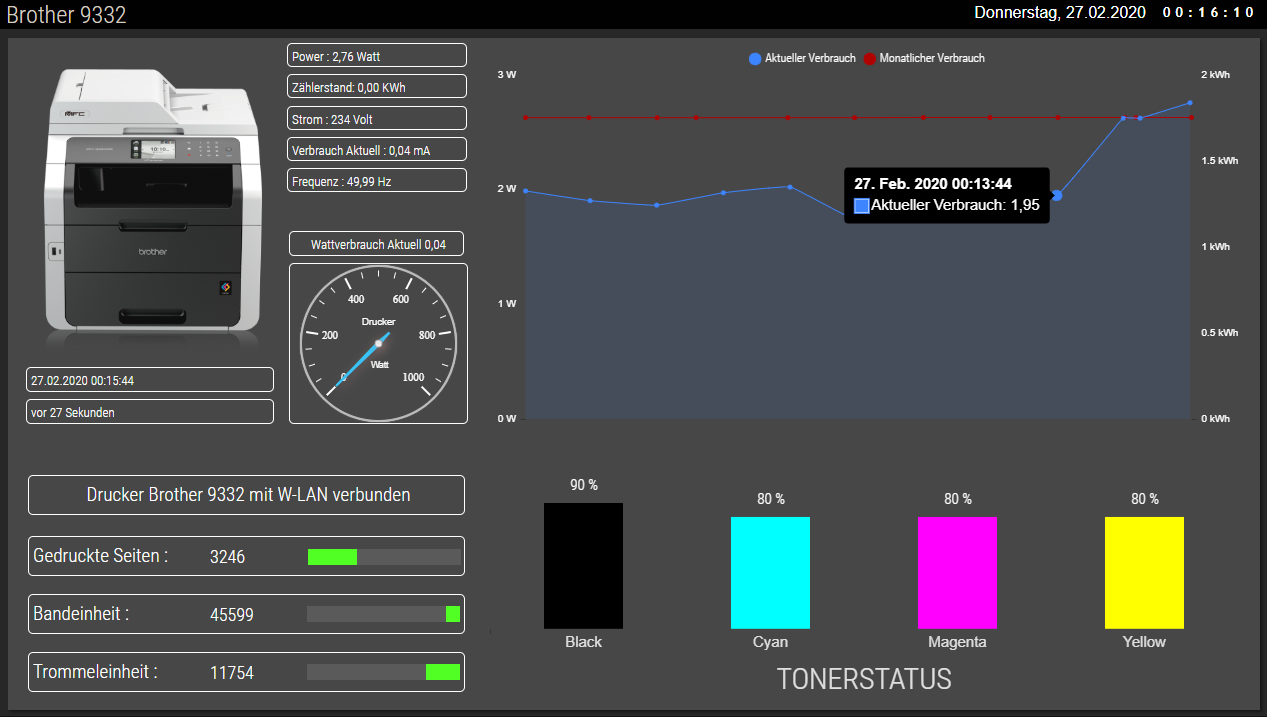
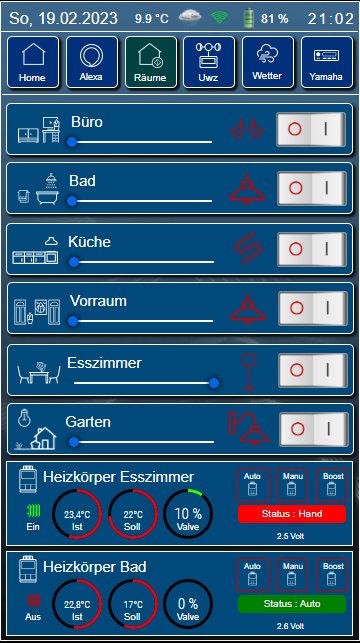
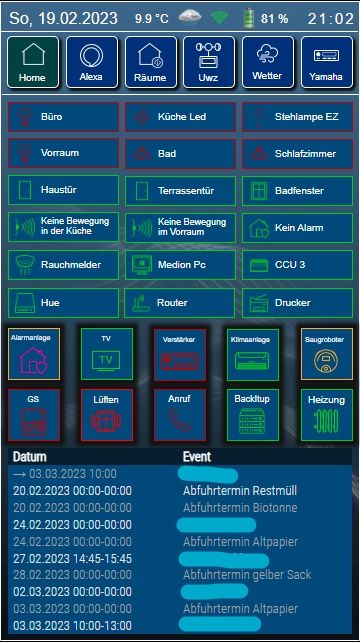
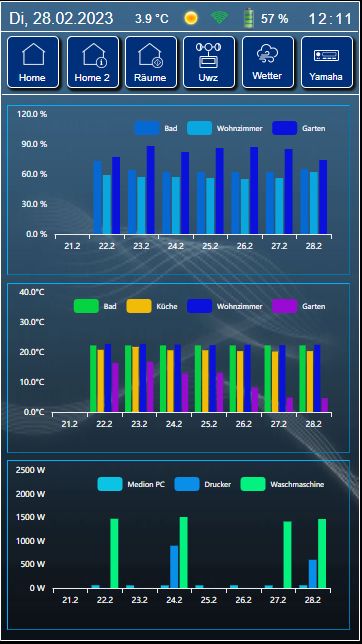
VIS von Sigi234
-
@Malz1902 sagte in VIS von Sigi234:
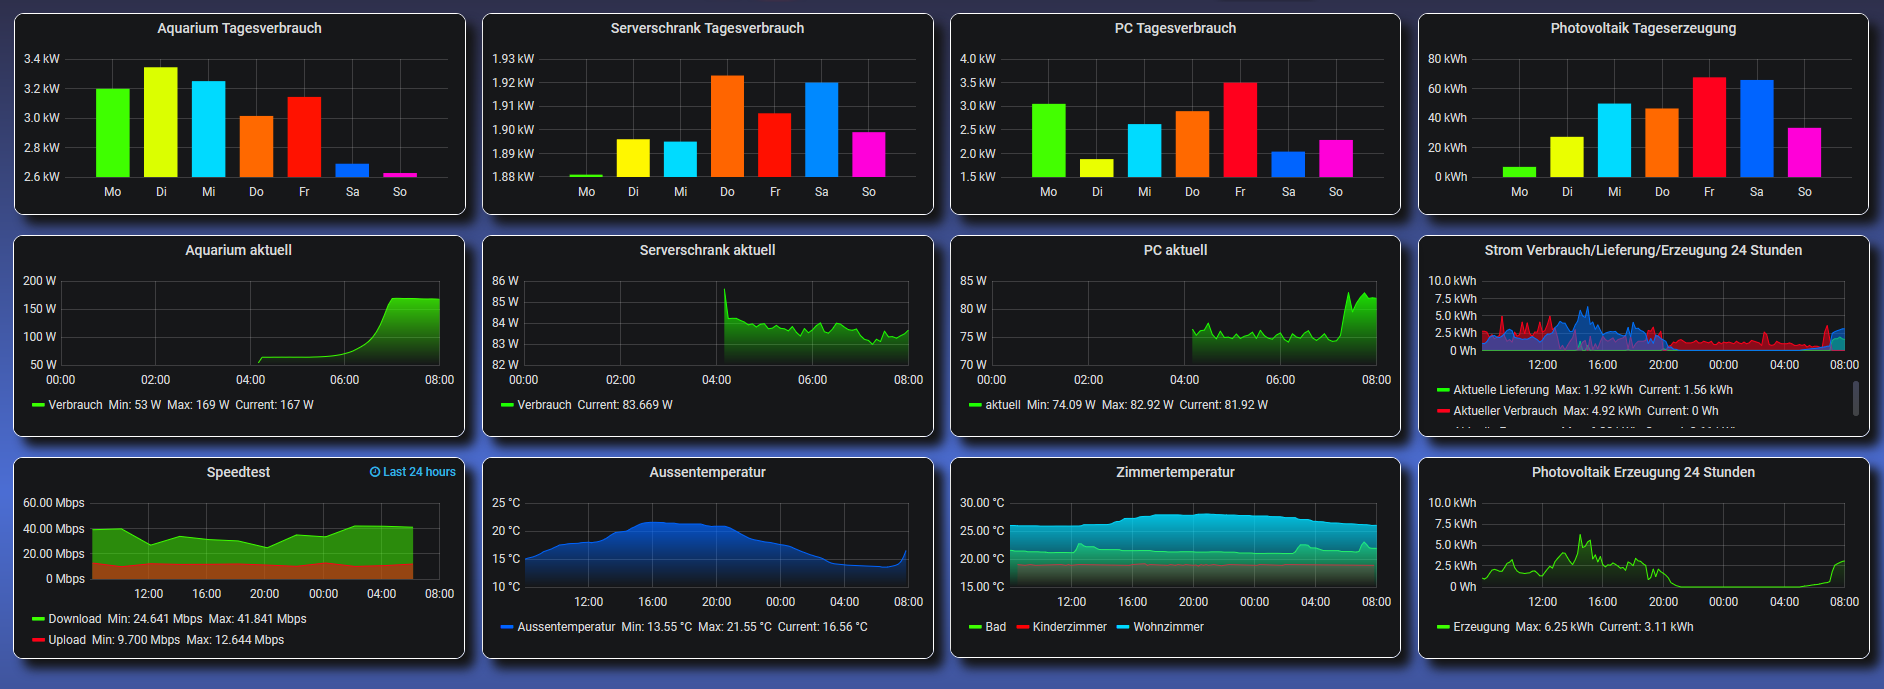
ich suche ne schöne View für meinen Stromverbrauch
Ich visualisiere das mit Grafana.
Geht aber auch mit Flot.
Und dann die einzelnen Flots als Iframe einbinden.
-
Du bringst mich gerade auf ne Super Idee den Stromverbrauch für den Serverschrank auch noch zu splitten. Nutzt du dafür nen extra Zähler oder wie machst Du das?
@Malz1902 sagte in VIS von Sigi234:
Nutzt du dafür nen extra Zähler oder wie machst Du das?
mit den TP-Link HS110 Steckdosen
-
@Malz1902 sagte in VIS von Sigi234:
ich suche ne schöne View für meinen Stromverbrauch
Ich visualisiere das mit Grafana.
Geht aber auch mit Flot.
Und dann die einzelnen Flots als Iframe einbinden.

@Negalein sagte in VIS von Sigi234:
@Malz1902 sagte in VIS von Sigi234:
ich suche ne schöne View für meinen Stromverbrauch
Ich visualisiere das mit Grafana.
Geht aber auch mit Flot.
Und dann die einzelnen Flots als Iframe einbinden.

Sieht sehr gut aus, ich nutze selber auch grafana. Wie stellst du die auslaufende Füllfarbe ein?
-
@Negalein sagte in VIS von Sigi234:
@Malz1902 sagte in VIS von Sigi234:
ich suche ne schöne View für meinen Stromverbrauch
Ich visualisiere das mit Grafana.
Geht aber auch mit Flot.
Und dann die einzelnen Flots als Iframe einbinden.

Sieht sehr gut aus, ich nutze selber auch grafana. Wie stellst du die auslaufende Füllfarbe ein?
@saeft_2003 sagte in VIS von Sigi234:
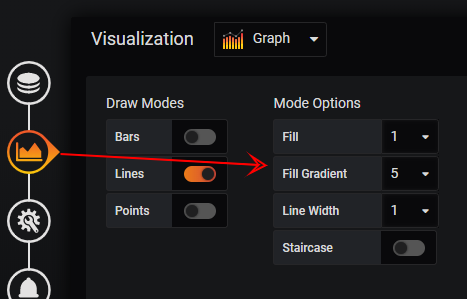
Wie stellst du die auslaufende Füllfarbe ein?
mit einer Kombi aus Fill und Fill Gradient
Sieht sehr gut aus
Danke
-
@saeft_2003 sagte in VIS von Sigi234:
Wie stellst du die auslaufende Füllfarbe ein?
mit einer Kombi aus Fill und Fill Gradient

Sieht sehr gut aus
Danke
Ok danke für die Info, dass muss ich heute Abend mal ausprobieren!
-
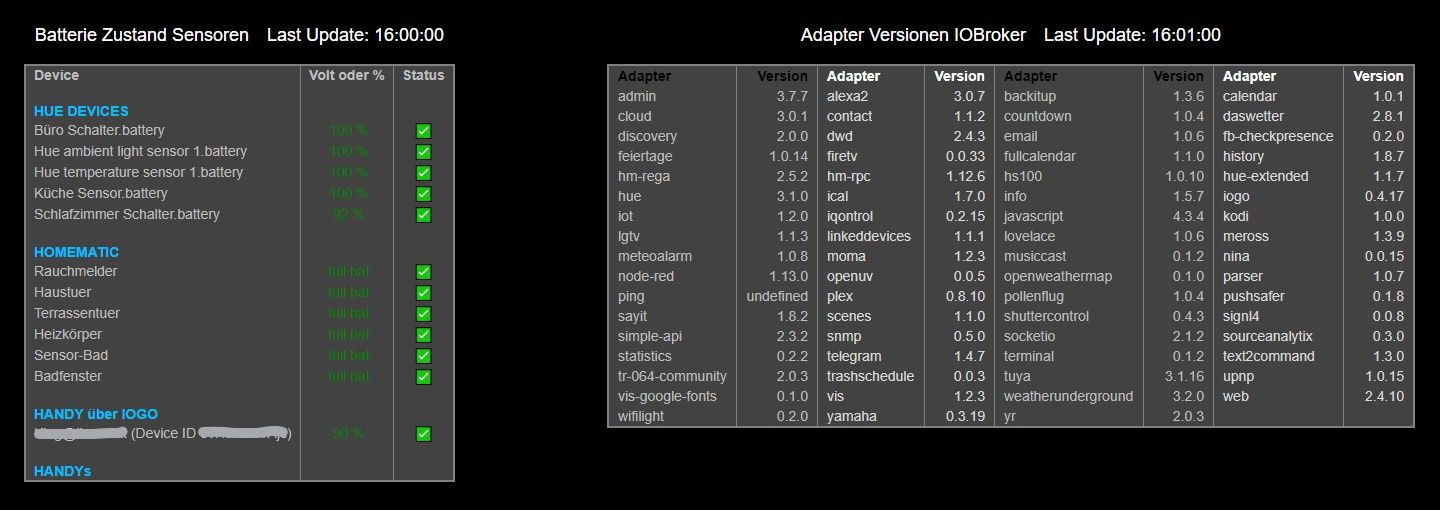
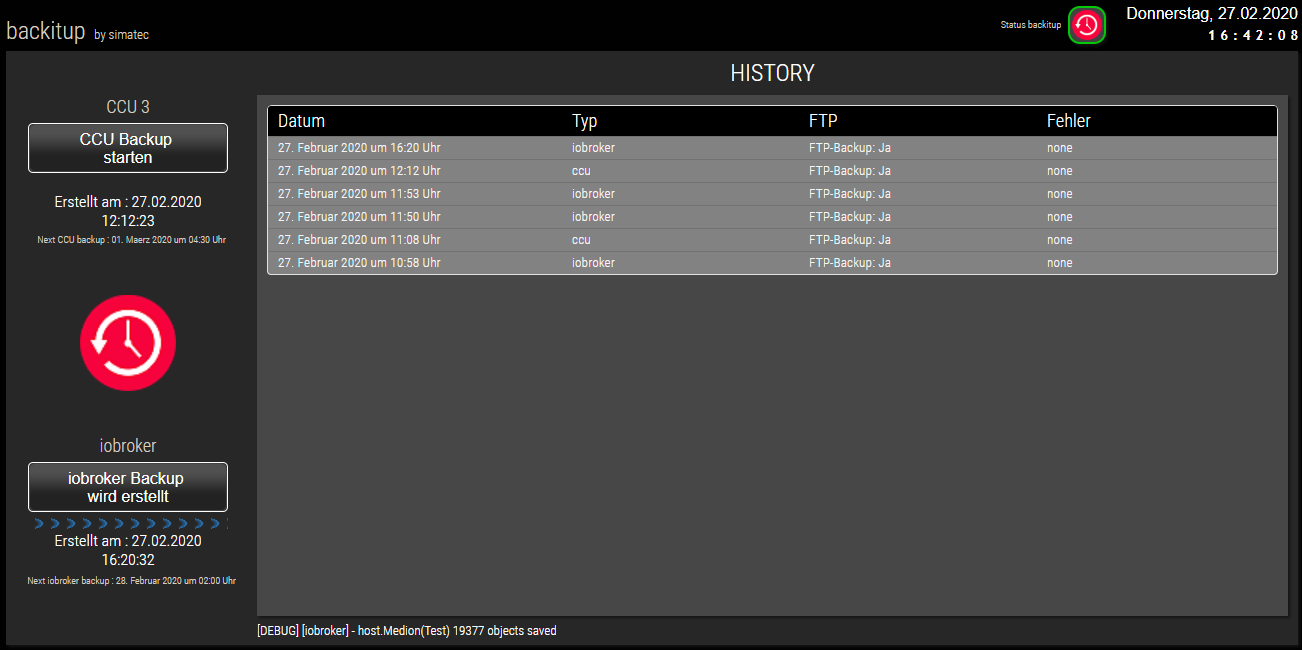
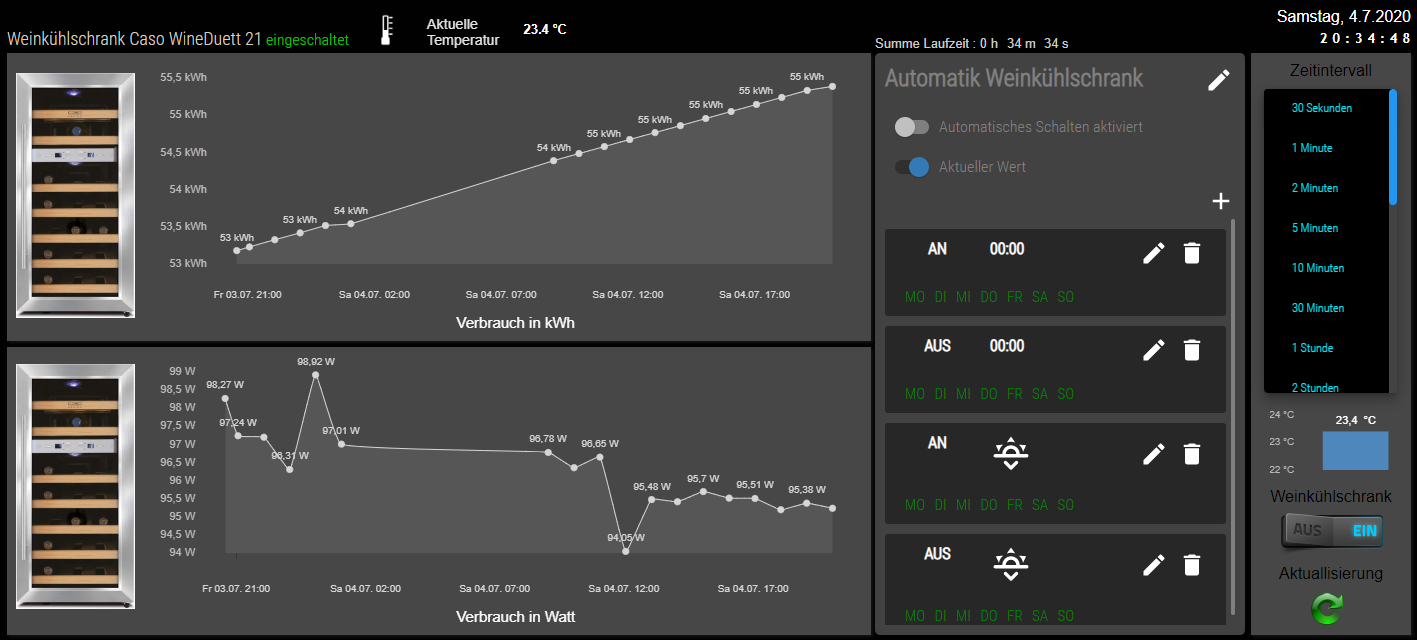
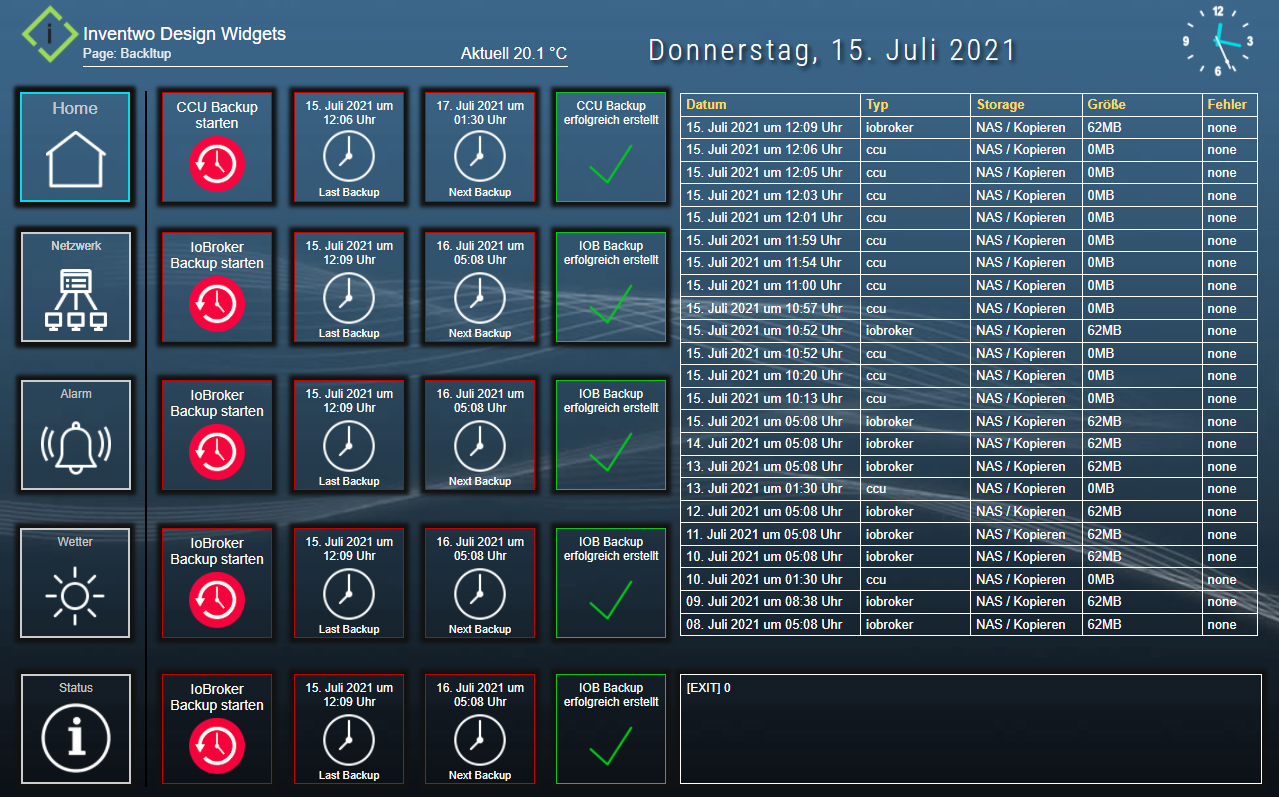
View backitup:
@sigi234 sagte in VIS von Sigi234:
View backitup:
Hallo Sigi, mega VIS die du da hast. Da sie mir so gut gefällt wollte ich die Backup vis übernehmen aber bei mir funktioniert der Animations-Balken nicht. Brauche ich dafür eine spezielle Instanz?
Grüße
-
@sigi234 sagte in VIS von Sigi234:
View backitup:
Hallo Sigi, mega VIS die du da hast. Da sie mir so gut gefällt wollte ich die Backup vis übernehmen aber bei mir funktioniert der Animations-Balken nicht. Brauche ich dafür eine spezielle Instanz?
Grüße
@Bluelinux sagte in VIS von Sigi234:
@sigi234 sagte in VIS von Sigi234:
View backitup:
Hallo Sigi, mega VIS die du da hast. Da sie mir so gut gefällt wollte ich die Backup vis übernehmen aber bei mir funktioniert der Animations-Balken nicht. Brauche ich dafür eine spezielle Instanz?
Grüße
https://forum.iobroker.net/topic/30363/projekt-mdcss-v2-material-design-css-version-2
-
@Holger-Etzel sagte in VIS von Sigi234:
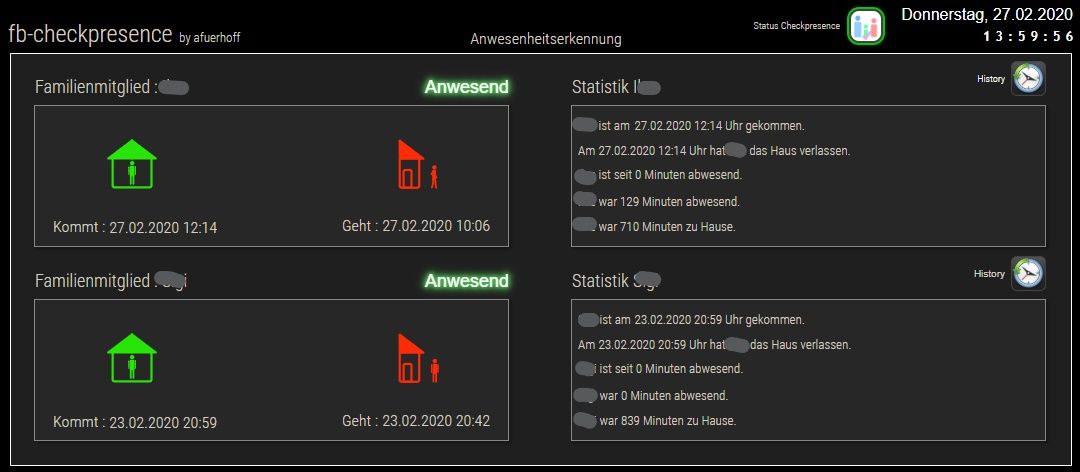
@sigi234 Hallo, wäre es auch möglich die Bilder für die View fb-checkpresence Anwesend/Abwesend zu bekommen?
DankeDie sind bei einen Icon Set dabei. Kann jetzt nicht nachsehen wie sie heißen. Brauchst aber nur auswählen und oben links auf das Info Icon klicken und dann ev. nachinstallieren.
icons-mfd-svg
@sigi234 danke, habs gefunden
-
@Malz1902 sagte in VIS von Sigi234:
ich suche ne schöne View für meinen Stromverbrauch
Ich visualisiere das mit Grafana.
Geht aber auch mit Flot.
Und dann die einzelnen Flots als Iframe einbinden.

@Negalein welches Plugin ist das bei Grafana? hab da auch erst mit angefangen.. kannst du mir die am besten exportieren, dann kann ich schauen wie das eingestellt ist.. auch mit den Wochentagen.. ???
-
@Negalein welches Plugin ist das bei Grafana? hab da auch erst mit angefangen.. kannst du mir die am besten exportieren, dann kann ich schauen wie das eingestellt ist.. auch mit den Wochentagen.. ???
@ilovegym sagte in VIS von Sigi234:
welches Plugin ist das bei Grafana? hab da auch erst mit angefangen.. kannst du mir die am besten exportieren, dann kann ich schauen wie das eingestellt ist.. auch mit den Wochentagen.. ???
Das mit den Wochentagen ist mit dem Graph Panel gemacht.
Ich hab dir mal das ganze Dashboard exportiert. Hoffe es hat geklappt.
{ "annotations": { "list": [ { "builtIn": 1, "datasource": "-- Grafana --", "enable": true, "hide": true, "iconColor": "rgba(0, 211, 255, 1)", "name": "Annotations & Alerts", "type": "dashboard" } ] }, "editable": true, "gnetId": null, "graphTooltip": 0, "id": 2, "links": [], "panels": [ { "aliasColors": { "Di": "rgb(255, 247, 0)", "Dienstag": "rgb(255, 221, 0)", "Do": "rgb(255, 101, 0)", "Donnerstag": "rgb(255, 126, 0)", "Fr": "rgb(255, 16, 0)", "Freitag": "rgb(255, 0, 31)", "Mi": "rgb(0, 219, 255)", "Mittwoch": "rgb(0, 100, 255)", "Mo": "rgb(63, 255, 0)", "Montag": "rgb(61, 255, 0)", "Sa": "rgb(0, 137, 255)", "Samstag": "rgb(0, 95, 255)", "So": "rgb(255, 0, 218)", "Sonntag": "rgb(255, 0, 215)" }, "bars": true, "dashLength": 10, "dashes": false, "datasource": null, "fill": 1, "fillGradient": 0, "gridPos": { "h": 7, "w": 7, "x": 0, "y": 0 }, "hiddenSeries": false, "hideTimeOverride": true, "id": 24, "interval": "", "legend": { "avg": false, "current": false, "max": false, "min": false, "show": false, "total": false, "values": false }, "lines": false, "linewidth": 1, "nullPointMode": "connected", "options": { "dataLinks": [] }, "percentage": false, "pluginVersion": "6.6.2", "pointradius": 2, "points": false, "renderer": "flot", "seriesOverrides": [], "spaceLength": 10, "stack": false, "steppedLine": false, "targets": [ { "alias": "Mo", "groupBy": [ { "params": [ "$__interval" ], "type": "time" }, { "params": [ "null" ], "type": "fill" } ], "measurement": "sourceanalytix.0.hs100__0__10_0_1_80__power.consumption.current_year.this_week.01_Monday", "orderByTime": "ASC", "policy": "default", "refId": "A", "resultFormat": "time_series", "select": [ [ { "params": [ "value" ], "type": "field" }, { "params": [], "type": "mean" } ] ], "tags": [] }, { "alias": "Di", "groupBy": [ { "params": [ "$__interval" ], "type": "time" }, { "params": [ "null" ], "type": "fill" } ], "measurement": "sourceanalytix.0.hs100__0__10_0_1_80__power.consumption.current_year.this_week.02_Tuesday", "orderByTime": "ASC", "policy": "default", "refId": "B", "resultFormat": "time_series", "select": [ [ { "params": [ "value" ], "type": "field" }, { "params": [], "type": "mean" } ] ], "tags": [] }, { "alias": "Mi", "groupBy": [ { "params": [ "$__interval" ], "type": "time" }, { "params": [ "null" ], "type": "fill" } ], "measurement": "sourceanalytix.0.hs100__0__10_0_1_80__power.consumption.current_year.this_week.03_Wednesday", "orderByTime": "ASC", "policy": "default", "refId": "C", "resultFormat": "time_series", "select": [ [ { "params": [ "value" ], "type": "field" }, { "params": [], "type": "mean" } ] ], "tags": [] }, { "alias": "Do", "groupBy": [ { "params": [ "$__interval" ], "type": "time" }, { "params": [ "null" ], "type": "fill" } ], "measurement": "sourceanalytix.0.hs100__0__10_0_1_80__power.consumption.current_year.this_week.04_Thursday", "orderByTime": "ASC", "policy": "default", "refId": "D", "resultFormat": "time_series", "select": [ [ { "params": [ "value" ], "type": "field" }, { "params": [], "type": "mean" } ] ], "tags": [] }, { "alias": "Fr", "groupBy": [ { "params": [ "$__interval" ], "type": "time" }, { "params": [ "null" ], "type": "fill" } ], "measurement": "sourceanalytix.0.hs100__0__10_0_1_80__power.consumption.current_year.this_week.05_Friday", "orderByTime": "ASC", "policy": "default", "refId": "E", "resultFormat": "time_series", "select": [ [ { "params": [ "value" ], "type": "field" }, { "params": [], "type": "mean" } ] ], "tags": [] }, { "alias": "Sa", "groupBy": [ { "params": [ "$__interval" ], "type": "time" }, { "params": [ "null" ], "type": "fill" } ], "measurement": "sourceanalytix.0.hs100__0__10_0_1_80__power.consumption.current_year.this_week.06_Saturday", "orderByTime": "ASC", "policy": "default", "refId": "F", "resultFormat": "time_series", "select": [ [ { "params": [ "value" ], "type": "field" }, { "params": [], "type": "mean" } ] ], "tags": [] }, { "alias": "So", "groupBy": [ { "params": [ "$__interval" ], "type": "time" }, { "params": [ "null" ], "type": "fill" } ], "measurement": "sourceanalytix.0.hs100__0__10_0_1_80__power.consumption.current_year.this_week.07_Sunday", "orderByTime": "ASC", "policy": "default", "refId": "G", "resultFormat": "time_series", "select": [ [ { "params": [ "value" ], "type": "field" }, { "params": [], "type": "mean" } ] ], "tags": [] } ], "thresholds": [], "timeFrom": "7d", "timeRegions": [], "timeShift": null, "title": "Serverschrank Tagesverbrauch", "tooltip": { "shared": false, "sort": 0, "value_type": "individual" }, "transparent": true, "type": "graph", "xaxis": { "buckets": null, "mode": "series", "name": null, "show": true, "values": [ "max" ] }, "yaxes": [ { "format": "kwatt", "label": null, "logBase": 1, "max": null, "min": null, "show": true }, { "format": "short", "label": null, "logBase": 1, "max": null, "min": null, "show": false } ], "yaxis": { "align": false, "alignLevel": null } }, { "aliasColors": { "Di": "rgb(219, 255, 0)", "Do": "rgb(255, 105, 0)", "Fr": "rgb(255, 18, 0)", "Mi": "rgb(0, 218, 255)", "Mo": "rgb(63, 255, 0)", "Sa": "rgb(0, 101, 255)", "So": "rgb(255, 0, 211)", "Tagesverbrauch": "dark-blue" }, "bars": true, "dashLength": 10, "dashes": false, "datasource": null, "fill": 1, "fillGradient": 0, "gridPos": { "h": 7, "w": 7, "x": 7, "y": 0 }, "hiddenSeries": false, "hideTimeOverride": true, "id": 20, "legend": { "alignAsTable": false, "avg": false, "current": false, "hideEmpty": false, "hideZero": false, "max": false, "min": false, "show": false, "total": false, "values": false }, "lines": false, "linewidth": 1, "nullPointMode": "connected", "options": { "dataLinks": [] }, "percentage": false, "pluginVersion": "6.6.2", "pointradius": 6, "points": false, "renderer": "flot", "seriesOverrides": [], "spaceLength": 10, "stack": false, "steppedLine": false, "targets": [ { "alias": "Mo", "groupBy": [ { "params": [ "$__interval" ], "type": "time" }, { "params": [ "null" ], "type": "fill" } ], "measurement": "sourceanalytix.0.hs100__0__10_0_1_77__power.consumption.current_year.this_week.01_Monday", "orderByTime": "ASC", "policy": "default", "refId": "A", "resultFormat": "time_series", "select": [ [ { "params": [ "value" ], "type": "field" }, { "params": [], "type": "mean" } ] ], "tags": [] }, { "alias": "Di", "groupBy": [ { "params": [ "$__interval" ], "type": "time" }, { "params": [ "null" ], "type": "fill" } ], "measurement": "sourceanalytix.0.hs100__0__10_0_1_77__power.consumption.current_year.this_week.02_Tuesday", "orderByTime": "ASC", "policy": "default", "refId": "B", "resultFormat": "time_series", "select": [ [ { "params": [ "value" ], "type": "field" }, { "params": [], "type": "mean" } ] ], "tags": [] }, { "alias": "Mi", "groupBy": [ { "params": [ "$__interval" ], "type": "time" }, { "params": [ "null" ], "type": "fill" } ], "measurement": "sourceanalytix.0.hs100__0__10_0_1_77__power.consumption.current_year.this_week.03_Wednesday", "orderByTime": "ASC", "policy": "default", "refId": "C", "resultFormat": "time_series", "select": [ [ { "params": [ "value" ], "type": "field" }, { "params": [], "type": "mean" } ] ], "tags": [] }, { "alias": "Do", "groupBy": [ { "params": [ "$__interval" ], "type": "time" }, { "params": [ "null" ], "type": "fill" } ], "measurement": "sourceanalytix.0.hs100__0__10_0_1_77__power.consumption.current_year.this_week.04_Thursday", "orderByTime": "ASC", "policy": "default", "refId": "D", "resultFormat": "time_series", "select": [ [ { "params": [ "value" ], "type": "field" }, { "params": [], "type": "mean" } ] ], "tags": [] }, { "alias": "Fr", "groupBy": [ { "params": [ "$__interval" ], "type": "time" }, { "params": [ "null" ], "type": "fill" } ], "measurement": "sourceanalytix.0.hs100__0__10_0_1_77__power.consumption.current_year.this_week.05_Friday", "orderByTime": "ASC", "policy": "default", "refId": "E", "resultFormat": "time_series", "select": [ [ { "params": [ "value" ], "type": "field" }, { "params": [], "type": "mean" } ] ], "tags": [] }, { "alias": "Sa", "groupBy": [ { "params": [ "$__interval" ], "type": "time" }, { "params": [ "null" ], "type": "fill" } ], "measurement": "sourceanalytix.0.hs100__0__10_0_1_77__power.consumption.current_year.this_week.06_Saturday", "orderByTime": "ASC", "policy": "default", "refId": "F", "resultFormat": "time_series", "select": [ [ { "params": [ "value" ], "type": "field" }, { "params": [], "type": "mean" } ] ], "tags": [] }, { "alias": "So", "groupBy": [ { "params": [ "$__interval" ], "type": "time" }, { "params": [ "null" ], "type": "fill" } ], "measurement": "sourceanalytix.0.hs100__0__10_0_1_77__power.consumption.current_year.this_week.07_Sunday", "orderByTime": "ASC", "policy": "default", "refId": "G", "resultFormat": "time_series", "select": [ [ { "params": [ "value" ], "type": "field" }, { "params": [], "type": "mean" } ] ], "tags": [] } ], "thresholds": [], "timeFrom": "7d", "timeRegions": [], "timeShift": null, "title": "Aquarium Tagesverbrauch", "tooltip": { "shared": false, "sort": 0, "value_type": "individual" }, "transparent": true, "type": "graph", "xaxis": { "buckets": null, "mode": "series", "name": null, "show": true, "values": [ "max" ] }, "yaxes": [ { "format": "kwatt", "label": "", "logBase": 1, "max": null, "min": null, "show": true }, { "format": "short", "label": null, "logBase": 1, "max": null, "min": null, "show": false } ], "yaxis": { "align": true, "alignLevel": 0 } }, { "aliasColors": { "Di": "rgb(234, 255, 0)", "Do": "rgb(255, 105, 0)", "Fr": "rgb(255, 0, 29)", "Mi": "rgb(0, 219, 255)", "Mo": "rgb(67, 255, 0)", "Sa": "rgb(0, 100, 255)", "So": "rgb(255, 0, 216)" }, "bars": true, "dashLength": 10, "dashes": false, "datasource": null, "fill": 1, "fillGradient": 0, "gridPos": { "h": 7, "w": 7, "x": 14, "y": 0 }, "hiddenSeries": false, "hideTimeOverride": true, "id": 16, "legend": { "alignAsTable": false, "avg": false, "current": false, "hideEmpty": false, "hideZero": false, "max": false, "min": false, "show": false, "total": false, "values": false }, "lines": false, "linewidth": 1, "nullPointMode": "connected", "options": { "dataLinks": [] }, "percentage": false, "pointradius": 2, "points": false, "renderer": "flot", "seriesOverrides": [], "spaceLength": 10, "stack": false, "steppedLine": false, "targets": [ { "alias": "Mo", "groupBy": [ { "params": [ "$__interval" ], "type": "time" }, { "params": [ "null" ], "type": "fill" } ], "measurement": "sourceanalytix.0.hs100__0__10_0_1_79__power.consumption.current_year.this_week.01_Monday", "orderByTime": "ASC", "policy": "default", "refId": "A", "resultFormat": "time_series", "select": [ [ { "params": [ "value" ], "type": "field" }, { "params": [], "type": "mean" } ] ], "tags": [] }, { "alias": "Di", "groupBy": [ { "params": [ "$__interval" ], "type": "time" }, { "params": [ "null" ], "type": "fill" } ], "measurement": "sourceanalytix.0.hs100__0__10_0_1_79__power.consumption.current_year.this_week.02_Tuesday", "orderByTime": "ASC", "policy": "default", "refId": "B", "resultFormat": "time_series", "select": [ [ { "params": [ "value" ], "type": "field" }, { "params": [], "type": "mean" } ] ], "tags": [] }, { "alias": "Mi", "groupBy": [ { "params": [ "$__interval" ], "type": "time" }, { "params": [ "null" ], "type": "fill" } ], "measurement": "sourceanalytix.0.hs100__0__10_0_1_79__power.consumption.current_year.this_week.03_Wednesday", "orderByTime": "ASC", "policy": "default", "refId": "C", "resultFormat": "time_series", "select": [ [ { "params": [ "value" ], "type": "field" }, { "params": [], "type": "mean" } ] ], "tags": [] }, { "alias": "Do", "groupBy": [ { "params": [ "$__interval" ], "type": "time" }, { "params": [ "null" ], "type": "fill" } ], "measurement": "sourceanalytix.0.hs100__0__10_0_1_79__power.consumption.current_year.this_week.04_Thursday", "orderByTime": "ASC", "policy": "default", "refId": "D", "resultFormat": "time_series", "select": [ [ { "params": [ "value" ], "type": "field" }, { "params": [], "type": "mean" } ] ], "tags": [] }, { "alias": "Fr", "groupBy": [ { "params": [ "$__interval" ], "type": "time" }, { "params": [ "null" ], "type": "fill" } ], "measurement": "sourceanalytix.0.hs100__0__10_0_1_79__power.consumption.current_year.this_week.05_Friday", "orderByTime": "ASC", "policy": "default", "refId": "E", "resultFormat": "time_series", "select": [ [ { "params": [ "value" ], "type": "field" }, { "params": [], "type": "mean" } ] ], "tags": [] }, { "alias": "Sa", "groupBy": [ { "params": [ "$__interval" ], "type": "time" }, { "params": [ "null" ], "type": "fill" } ], "measurement": "sourceanalytix.0.hs100__0__10_0_1_79__power.consumption.current_year.this_week.06_Saturday", "orderByTime": "ASC", "policy": "default", "refId": "F", "resultFormat": "time_series", "select": [ [ { "params": [ "value" ], "type": "field" }, { "params": [], "type": "mean" } ] ], "tags": [] }, { "alias": "So", "groupBy": [ { "params": [ "$__interval" ], "type": "time" }, { "params": [ "null" ], "type": "fill" } ], "measurement": "sourceanalytix.0.hs100__0__10_0_1_79__power.consumption.current_year.this_week.07_Sunday", "orderByTime": "ASC", "policy": "default", "refId": "G", "resultFormat": "time_series", "select": [ [ { "params": [ "value" ], "type": "field" }, { "params": [], "type": "mean" } ] ], "tags": [] } ], "thresholds": [], "timeFrom": "7d", "timeRegions": [], "timeShift": null, "title": "PC Tagesverbrauch", "tooltip": { "shared": false, "sort": 0, "value_type": "individual" }, "transparent": true, "type": "graph", "xaxis": { "buckets": null, "mode": "series", "name": null, "show": true, "values": [ "max" ] }, "yaxes": [ { "format": "kwatt", "label": null, "logBase": 1, "max": null, "min": null, "show": true }, { "format": "short", "label": null, "logBase": 1, "max": null, "min": null, "show": false } ], "yaxis": { "align": false, "alignLevel": null } }, { "aliasColors": { "Di": "rgb(234, 255, 0)", "Do": "rgb(255, 105, 0)", "Fr": "rgb(255, 0, 29)", "Mi": "rgb(0, 219, 255)", "Mo": "rgb(67, 255, 0)", "Sa": "rgb(0, 100, 255)", "So": "rgb(255, 0, 216)" }, "bars": true, "dashLength": 10, "dashes": false, "datasource": null, "fill": 1, "fillGradient": 0, "gridPos": { "h": 7, "w": 7, "x": 0, "y": 7 }, "hiddenSeries": false, "hideTimeOverride": true, "id": 27, "legend": { "alignAsTable": false, "avg": false, "current": false, "hideEmpty": false, "hideZero": false, "max": false, "min": false, "show": false, "total": false, "values": false }, "lines": false, "linewidth": 1, "nullPointMode": "connected", "options": { "dataLinks": [] }, "percentage": false, "pointradius": 2, "points": false, "renderer": "flot", "seriesOverrides": [], "spaceLength": 10, "stack": false, "steppedLine": false, "targets": [ { "alias": "Mo", "groupBy": [ { "params": [ "$__interval" ], "type": "time" }, { "params": [ "null" ], "type": "fill" } ], "measurement": "sourceanalytix.0.fronius__0__inverter__1__PAC.consumption.current_year.this_week.01_Monday", "orderByTime": "ASC", "policy": "default", "refId": "A", "resultFormat": "time_series", "select": [ [ { "params": [ "value" ], "type": "field" }, { "params": [], "type": "mean" } ] ], "tags": [] }, { "alias": "Di", "groupBy": [ { "params": [ "$__interval" ], "type": "time" }, { "params": [ "null" ], "type": "fill" } ], "measurement": "sourceanalytix.0.fronius__0__inverter__1__PAC.consumption.current_year.this_week.02_Tuesday", "orderByTime": "ASC", "policy": "default", "refId": "B", "resultFormat": "time_series", "select": [ [ { "params": [ "value" ], "type": "field" }, { "params": [], "type": "mean" } ] ], "tags": [] }, { "alias": "Mi", "groupBy": [ { "params": [ "$__interval" ], "type": "time" }, { "params": [ "null" ], "type": "fill" } ], "measurement": "sourceanalytix.0.fronius__0__inverter__1__PAC.consumption.current_year.this_week.03_Wednesday", "orderByTime": "ASC", "policy": "default", "refId": "C", "resultFormat": "time_series", "select": [ [ { "params": [ "value" ], "type": "field" }, { "params": [], "type": "mean" } ] ], "tags": [] }, { "alias": "Do", "groupBy": [ { "params": [ "$__interval" ], "type": "time" }, { "params": [ "null" ], "type": "fill" } ], "measurement": "sourceanalytix.0.fronius__0__inverter__1__PAC.consumption.current_year.this_week.04_Thursday", "orderByTime": "ASC", "policy": "default", "refId": "D", "resultFormat": "time_series", "select": [ [ { "params": [ "value" ], "type": "field" }, { "params": [], "type": "mean" } ] ], "tags": [] }, { "alias": "Fr", "groupBy": [ { "params": [ "$__interval" ], "type": "time" }, { "params": [ "null" ], "type": "fill" } ], "measurement": "sourceanalytix.0.fronius__0__inverter__1__PAC.consumption.current_year.this_week.05_Friday", "orderByTime": "ASC", "policy": "default", "refId": "E", "resultFormat": "time_series", "select": [ [ { "params": [ "value" ], "type": "field" }, { "params": [], "type": "mean" } ] ], "tags": [] }, { "alias": "Sa", "groupBy": [ { "params": [ "$__interval" ], "type": "time" }, { "params": [ "null" ], "type": "fill" } ], "measurement": "sourceanalytix.0.fronius__0__inverter__1__PAC.consumption.current_year.this_week.06_Saturday", "orderByTime": "ASC", "policy": "default", "refId": "F", "resultFormat": "time_series", "select": [ [ { "params": [ "value" ], "type": "field" }, { "params": [], "type": "mean" } ] ], "tags": [] }, { "alias": "So", "groupBy": [ { "params": [ "$__interval" ], "type": "time" }, { "params": [ "null" ], "type": "fill" } ], "measurement": "sourceanalytix.0.fronius__0__inverter__1__PAC.consumption.current_year.this_week.07_Sunday", "orderByTime": "ASC", "policy": "default", "refId": "G", "resultFormat": "time_series", "select": [ [ { "params": [ "value" ], "type": "field" }, { "params": [], "type": "mean" } ] ], "tags": [] } ], "thresholds": [], "timeFrom": "7d", "timeRegions": [], "timeShift": null, "title": "Photovoltaik Tageserzeugung", "tooltip": { "shared": false, "sort": 0, "value_type": "individual" }, "transparent": true, "type": "graph", "xaxis": { "buckets": null, "mode": "series", "name": null, "show": true, "values": [ "max" ] }, "yaxes": [ { "format": "kwatth", "label": null, "logBase": 1, "max": null, "min": null, "show": true }, { "format": "short", "label": null, "logBase": 1, "max": null, "min": null, "show": false } ], "yaxis": { "align": false, "alignLevel": null } }, { "aliasColors": { "Erzeugung": "rgb(63, 255, 0)" }, "bars": false, "dashLength": 10, "dashes": false, "datasource": null, "fill": 1, "fillGradient": 5, "gridPos": { "h": 7, "w": 7, "x": 7, "y": 7 }, "hiddenSeries": false, "hideTimeOverride": true, "id": 26, "legend": { "avg": false, "current": true, "max": true, "min": false, "show": true, "total": false, "values": true }, "lines": true, "linewidth": 1, "nullPointMode": "connected", "options": { "dataLinks": [] }, "percentage": false, "pointradius": 2, "points": false, "renderer": "flot", "seriesOverrides": [], "spaceLength": 10, "stack": false, "steppedLine": false, "targets": [ { "alias": "Erzeugung", "groupBy": [ { "params": [ "$__interval" ], "type": "time" }, { "params": [ "0" ], "type": "fill" } ], "measurement": "fronius.0.inverter.1.PAC", "orderByTime": "ASC", "policy": "default", "refId": "A", "resultFormat": "time_series", "select": [ [ { "params": [ "value" ], "type": "field" }, { "params": [], "type": "mean" } ] ], "tags": [] } ], "thresholds": [], "timeFrom": "24h", "timeRegions": [], "timeShift": null, "title": "Photovoltaik Erzeugung 24 Stunden", "tooltip": { "shared": true, "sort": 0, "value_type": "individual" }, "transparent": true, "type": "graph", "xaxis": { "buckets": null, "mode": "time", "name": null, "show": true, "values": [] }, "yaxes": [ { "format": "watth", "label": null, "logBase": 1, "max": null, "min": null, "show": true }, { "format": "short", "label": null, "logBase": 1, "max": null, "min": null, "show": false } ], "yaxis": { "align": false, "alignLevel": null } }, { "aliasColors": { "AKTUELLER_VERBRAUCH.mean": "dark-red", "Aktuelle Erzeugung": "rgb(0, 114, 255)", "Aktuelle Lieferung": "rgb(26, 255, 0)", "Aktueller Verbrauch": "rgb(255, 0, 27)" }, "bars": false, "dashLength": 10, "dashes": false, "datasource": null, "decimals": 2, "fill": 5, "fillGradient": 0, "gridPos": { "h": 7, "w": 7, "x": 14, "y": 7 }, "hiddenSeries": false, "hideTimeOverride": true, "id": 2, "legend": { "alignAsTable": false, "avg": false, "current": true, "hideEmpty": false, "hideZero": false, "max": true, "min": false, "rightSide": false, "show": true, "total": false, "values": true }, "lines": true, "linewidth": 1, "nullPointMode": "connected", "options": { "dataLinks": [] }, "percentage": false, "pointradius": 2, "points": false, "renderer": "flot", "seriesOverrides": [], "spaceLength": 10, "stack": false, "steppedLine": false, "targets": [ { "alias": "Aktuelle Lieferung", "groupBy": [ { "params": [ "$__interval" ], "type": "time" }, { "params": [ "previous" ], "type": "fill" } ], "measurement": "AKTUELLE_LIEFERUNG", "orderByTime": "ASC", "policy": "default", "refId": "A", "resultFormat": "time_series", "select": [ [ { "params": [ "value" ], "type": "field" }, { "params": [], "type": "last" } ] ], "tags": [] }, { "alias": "Aktueller Verbrauch", "groupBy": [ { "params": [ "$__interval" ], "type": "time" }, { "params": [ "previous" ], "type": "fill" } ], "measurement": "AKTUELLER_VERBRAUCH", "orderByTime": "ASC", "policy": "default", "refId": "B", "resultFormat": "time_series", "select": [ [ { "params": [ "value" ], "type": "field" }, { "params": [], "type": "last" } ] ], "tags": [] }, { "alias": "Aktuelle Erzeugung", "groupBy": [ { "params": [ "$__interval" ], "type": "time" }, { "params": [ "previous" ], "type": "fill" } ], "measurement": "fronius.0.inverter.1.PAC", "orderByTime": "ASC", "policy": "default", "refId": "C", "resultFormat": "time_series", "select": [ [ { "params": [ "value" ], "type": "field" }, { "params": [], "type": "last" } ] ], "tags": [] } ], "thresholds": [], "timeFrom": "24h", "timeRegions": [], "timeShift": null, "title": "Strom Verbrauch/Lieferung/Erzeugung 24 Stunden", "tooltip": { "shared": true, "sort": 0, "value_type": "individual" }, "transparent": true, "type": "graph", "xaxis": { "buckets": null, "mode": "time", "name": null, "show": true, "values": [] }, "yaxes": [ { "decimals": null, "format": "watth", "label": null, "logBase": 1, "max": null, "min": "0", "show": true }, { "decimals": null, "format": "watt", "label": null, "logBase": 1, "max": null, "min": "0", "show": false } ], "yaxis": { "align": false, "alignLevel": 0 } }, { "aliasColors": { "Verbrauch": "rgb(29, 255, 0)" }, "bars": false, "dashLength": 10, "dashes": false, "datasource": null, "fill": 5, "fillGradient": 10, "gridPos": { "h": 7, "w": 7, "x": 0, "y": 14 }, "hiddenSeries": false, "hideTimeOverride": true, "id": 22, "legend": { "alignAsTable": false, "avg": false, "current": true, "max": false, "min": false, "show": true, "total": false, "values": true }, "lines": true, "linewidth": 1, "nullPointMode": "connected", "options": { "dataLinks": [] }, "percentage": false, "pointradius": 2, "points": false, "renderer": "flot", "seriesOverrides": [], "spaceLength": 10, "stack": false, "steppedLine": false, "targets": [ { "alias": "Verbrauch", "groupBy": [ { "params": [ "$__interval" ], "type": "time" }, { "params": [ "null" ], "type": "fill" } ], "measurement": "Serverschrank_aktuell", "orderByTime": "ASC", "policy": "default", "refId": "A", "resultFormat": "time_series", "select": [ [ { "params": [ "value" ], "type": "field" }, { "params": [], "type": "mean" } ] ], "tags": [] } ], "thresholds": [], "timeFrom": "now/d", "timeRegions": [], "timeShift": null, "title": "Serverschrank aktuell", "tooltip": { "shared": true, "sort": 0, "value_type": "individual" }, "transparent": true, "type": "graph", "xaxis": { "buckets": null, "mode": "time", "name": null, "show": true, "values": [] }, "yaxes": [ { "format": "watt", "label": "", "logBase": 1, "max": null, "min": null, "show": true }, { "format": "short", "label": null, "logBase": 1, "max": null, "min": null, "show": false } ], "yaxis": { "align": false, "alignLevel": null } }, { "aliasColors": { "Aquarium_aktuell.mean": "rgb(60, 255, 0)", "Verbrauch": "rgb(59, 255, 0)" }, "bars": false, "dashLength": 10, "dashes": false, "datasource": null, "fill": 5, "fillGradient": 10, "gridPos": { "h": 7, "w": 7, "x": 7, "y": 14 }, "hiddenSeries": false, "hideTimeOverride": true, "id": 18, "interval": "", "legend": { "alignAsTable": false, "avg": false, "current": true, "hideEmpty": false, "hideZero": false, "max": true, "min": true, "show": true, "total": false, "values": true }, "lines": true, "linewidth": 1, "nullPointMode": "connected", "options": { "dataLinks": [] }, "percentage": false, "pointradius": 2, "points": false, "renderer": "flot", "repeat": null, "seriesOverrides": [], "spaceLength": 10, "stack": false, "steppedLine": false, "targets": [ { "alias": "Verbrauch", "groupBy": [ { "params": [ "$__interval" ], "type": "time" }, { "params": [ "null" ], "type": "fill" } ], "measurement": "Aquarium_aktuell", "orderByTime": "ASC", "policy": "default", "refId": "A", "resultFormat": "time_series", "select": [ [ { "params": [ "value" ], "type": "field" }, { "params": [], "type": "mean" } ] ], "tags": [] } ], "thresholds": [], "timeFrom": "now/d", "timeRegions": [], "timeShift": null, "title": "Aquarium aktuell", "tooltip": { "shared": true, "sort": 0, "value_type": "individual" }, "transparent": true, "type": "graph", "xaxis": { "buckets": null, "mode": "time", "name": null, "show": true, "values": [] }, "yaxes": [ { "decimals": null, "format": "watt", "label": "", "logBase": 1, "max": null, "min": null, "show": true }, { "format": "short", "label": null, "logBase": 1, "max": null, "min": null, "show": false } ], "yaxis": { "align": false, "alignLevel": null } }, { "aliasColors": { "aktuell": "rgb(29, 255, 0)" }, "bars": false, "dashLength": 10, "dashes": false, "datasource": null, "fill": 5, "fillGradient": 10, "gridPos": { "h": 7, "w": 7, "x": 14, "y": 14 }, "hiddenSeries": false, "hideTimeOverride": true, "id": 14, "legend": { "alignAsTable": false, "avg": false, "current": true, "hideEmpty": false, "hideZero": false, "max": true, "min": true, "show": true, "total": false, "values": true }, "lines": true, "linewidth": 1, "nullPointMode": "connected", "options": { "dataLinks": [] }, "percentage": false, "pointradius": 2, "points": false, "renderer": "flot", "seriesOverrides": [], "spaceLength": 10, "stack": false, "steppedLine": false, "targets": [ { "alias": "aktuell", "groupBy": [ { "params": [ "$__interval" ], "type": "time" }, { "params": [ "null" ], "type": "fill" } ], "measurement": "PC_aktuell", "orderByTime": "ASC", "policy": "default", "refId": "A", "resultFormat": "time_series", "select": [ [ { "params": [ "value" ], "type": "field" }, { "params": [], "type": "mean" } ] ], "tags": [] } ], "thresholds": [], "timeFrom": "now/d", "timeRegions": [], "timeShift": null, "title": "PC aktuell", "tooltip": { "shared": true, "sort": 0, "value_type": "individual" }, "transparent": true, "type": "graph", "xaxis": { "buckets": null, "mode": "time", "name": null, "show": true, "values": [] }, "yaxes": [ { "format": "watt", "label": null, "logBase": 1, "max": null, "min": null, "show": true }, { "format": "short", "label": null, "logBase": 1, "max": null, "min": null, "show": false } ], "yaxis": { "align": false, "alignLevel": null } }, { "aliasColors": { "Aussentemperatur": "rgb(0, 100, 255)", "Temperatur_aussen_aktuell.mean": "rgb(23, 0, 255)" }, "bars": false, "dashLength": 10, "dashes": false, "datasource": null, "decimals": 2, "description": "", "fill": 5, "fillGradient": 10, "gridPos": { "h": 7, "w": 7, "x": 0, "y": 21 }, "hiddenSeries": false, "hideTimeOverride": true, "id": 12, "legend": { "alignAsTable": false, "avg": false, "current": true, "max": true, "min": true, "show": true, "total": false, "values": true }, "lines": true, "linewidth": 1, "nullPointMode": "connected", "options": { "dataLinks": [] }, "percentage": false, "pointradius": 2, "points": false, "renderer": "flot", "seriesOverrides": [], "spaceLength": 10, "stack": false, "steppedLine": false, "targets": [ { "alias": "Aussentemperatur", "groupBy": [ { "params": [ "$__interval" ], "type": "time" }, { "params": [ "null" ], "type": "fill" } ], "measurement": "Aussentemp-Keller", "orderByTime": "ASC", "policy": "default", "refId": "A", "resultFormat": "time_series", "select": [ [ { "params": [ "value" ], "type": "field" }, { "params": [], "type": "mean" } ] ], "tags": [] } ], "thresholds": [], "timeFrom": "24h", "timeRegions": [], "timeShift": null, "title": "Aussentemperatur", "tooltip": { "shared": true, "sort": 0, "value_type": "individual" }, "transparent": true, "type": "graph", "xaxis": { "buckets": null, "mode": "time", "name": null, "show": true, "values": [] }, "yaxes": [ { "decimals": null, "format": "celsius", "label": null, "logBase": 1, "max": null, "min": null, "show": true }, { "format": "short", "label": null, "logBase": 1, "max": null, "min": null, "show": false } ], "yaxis": { "align": false, "alignLevel": null } }, { "aliasColors": { "Bad": "rgb(64, 255, 0)", "Kinderzimmer": "rgb(255, 0, 4)", "Temperatur_Bad.mean": "rgb(65, 255, 0)", "Temperatur_KiZi.mean": "rgb(255, 183, 0)", "Temperatur_WoZi.mean": "rgb(0, 218, 255)", "Wohnzimmer": "rgb(0, 218, 255)" }, "bars": false, "dashLength": 10, "dashes": false, "datasource": null, "decimals": 2, "fill": 5, "fillGradient": 10, "gridPos": { "h": 7, "w": 7, "x": 7, "y": 21 }, "hiddenSeries": false, "hideTimeOverride": true, "id": 10, "legend": { "alignAsTable": false, "avg": false, "current": false, "hideEmpty": false, "hideZero": false, "max": false, "min": false, "show": true, "total": false, "values": false }, "lines": true, "linewidth": 1, "nullPointMode": "connected", "options": { "dataLinks": [] }, "percentage": false, "pointradius": 2, "points": false, "renderer": "flot", "seriesOverrides": [], "spaceLength": 10, "stack": false, "steppedLine": false, "targets": [ { "alias": "Bad", "groupBy": [ { "params": [ "$__interval" ], "type": "time" }, { "params": [ "null" ], "type": "fill" } ], "measurement": "Temperatur_Bad", "orderByTime": "ASC", "policy": "default", "refId": "A", "resultFormat": "time_series", "select": [ [ { "params": [ "value" ], "type": "field" }, { "params": [], "type": "mean" } ] ], "tags": [] }, { "alias": "Kinderzimmer", "groupBy": [ { "params": [ "$__interval" ], "type": "time" }, { "params": [ "null" ], "type": "fill" } ], "measurement": "Temperatur_KiZi", "orderByTime": "ASC", "policy": "default", "refId": "B", "resultFormat": "time_series", "select": [ [ { "params": [ "value" ], "type": "field" }, { "params": [], "type": "mean" } ] ], "tags": [] }, { "alias": "Wohnzimmer", "groupBy": [ { "params": [ "$__interval" ], "type": "time" }, { "params": [ "null" ], "type": "fill" } ], "measurement": "Temperatur_WoZi", "orderByTime": "ASC", "policy": "default", "refId": "C", "resultFormat": "time_series", "select": [ [ { "params": [ "value" ], "type": "field" }, { "params": [], "type": "mean" } ] ], "tags": [] } ], "thresholds": [], "timeFrom": "24h", "timeRegions": [], "timeShift": null, "title": "Zimmertemperatur", "tooltip": { "shared": true, "sort": 0, "value_type": "individual" }, "transparent": true, "type": "graph", "xaxis": { "buckets": null, "mode": "time", "name": null, "show": true, "values": [] }, "yaxes": [ { "decimals": 2, "format": "celsius", "label": null, "logBase": 1, "max": null, "min": null, "show": true }, { "format": "short", "label": null, "logBase": 1, "max": null, "min": null, "show": false } ], "yaxis": { "align": true, "alignLevel": 0 } }, { "aliasColors": { "Download": "rgb(63, 255, 0)", "Upload": "rgb(255, 0, 23)", "Webspeedy Download.mean": "rgb(58, 255, 0)" }, "bars": false, "dashLength": 10, "dashes": false, "datasource": null, "fill": 5, "fillGradient": 0, "gridPos": { "h": 7, "w": 7, "x": 14, "y": 21 }, "hiddenSeries": false, "id": 6, "legend": { "alignAsTable": false, "avg": false, "current": false, "max": true, "min": true, "show": true, "total": false, "values": true }, "lines": true, "linewidth": 1, "nullPointMode": "connected", "options": { "dataLinks": [] }, "percentage": false, "pointradius": 2, "points": false, "renderer": "flot", "seriesOverrides": [], "spaceLength": 10, "stack": false, "steppedLine": false, "targets": [ { "alias": "Download", "groupBy": [ { "params": [ "$__interval" ], "type": "time" }, { "params": [ "null" ], "type": "fill" } ], "measurement": "Webspeedy Download", "orderByTime": "ASC", "policy": "default", "refId": "A", "resultFormat": "time_series", "select": [ [ { "params": [ "value" ], "type": "field" }, { "params": [], "type": "last" } ] ], "tags": [] }, { "alias": "Upload", "groupBy": [ { "params": [ "$__interval" ], "type": "time" }, { "params": [ "null" ], "type": "fill" } ], "measurement": "Webspeedy Upload", "orderByTime": "ASC", "policy": "default", "refId": "B", "resultFormat": "time_series", "select": [ [ { "params": [ "value" ], "type": "field" }, { "params": [], "type": "last" } ] ], "tags": [] } ], "thresholds": [], "timeFrom": "24h", "timeRegions": [], "timeShift": null, "title": "Speedtest", "tooltip": { "shared": true, "sort": 0, "value_type": "individual" }, "transparent": true, "type": "graph", "xaxis": { "buckets": null, "mode": "time", "name": null, "show": true, "values": [] }, "yaxes": [ { "decimals": 2, "format": "Mbits", "label": "", "logBase": 1, "max": null, "min": "0", "show": true }, { "format": "short", "label": null, "logBase": 1, "max": null, "min": null, "show": false } ], "yaxis": { "align": true, "alignLevel": 0 } } ], "refresh": "1m", "schemaVersion": 22, "style": "dark", "tags": [], "templating": { "list": [] }, "time": { "from": "now-24h", "to": "now" }, "timepicker": { "refresh_intervals": [ "5s", "10s", "30s", "1m", "5m", "15m", "30m", "1h", "2h", "1d" ] }, "timezone": "", "title": "Allgemein", "uid": "XMW0dj_Wz", "version": 119 } -
@ilovegym sagte in VIS von Sigi234:
welches Plugin ist das bei Grafana? hab da auch erst mit angefangen.. kannst du mir die am besten exportieren, dann kann ich schauen wie das eingestellt ist.. auch mit den Wochentagen.. ???
Das mit den Wochentagen ist mit dem Graph Panel gemacht.
Ich hab dir mal das ganze Dashboard exportiert. Hoffe es hat geklappt.
{ "annotations": { "list": [ { "builtIn": 1, "datasource": "-- Grafana --", "enable": true, "hide": true, "iconColor": "rgba(0, 211, 255, 1)", "name": "Annotations & Alerts", "type": "dashboard" } ] }, "editable": true, "gnetId": null, "graphTooltip": 0, "id": 2, "links": [], "panels": [ { "aliasColors": { "Di": "rgb(255, 247, 0)", "Dienstag": "rgb(255, 221, 0)", "Do": "rgb(255, 101, 0)", "Donnerstag": "rgb(255, 126, 0)", "Fr": "rgb(255, 16, 0)", "Freitag": "rgb(255, 0, 31)", "Mi": "rgb(0, 219, 255)", "Mittwoch": "rgb(0, 100, 255)", "Mo": "rgb(63, 255, 0)", "Montag": "rgb(61, 255, 0)", "Sa": "rgb(0, 137, 255)", "Samstag": "rgb(0, 95, 255)", "So": "rgb(255, 0, 218)", "Sonntag": "rgb(255, 0, 215)" }, "bars": true, "dashLength": 10, "dashes": false, "datasource": null, "fill": 1, "fillGradient": 0, "gridPos": { "h": 7, "w": 7, "x": 0, "y": 0 }, "hiddenSeries": false, "hideTimeOverride": true, "id": 24, "interval": "", "legend": { "avg": false, "current": false, "max": false, "min": false, "show": false, "total": false, "values": false }, "lines": false, "linewidth": 1, "nullPointMode": "connected", "options": { "dataLinks": [] }, "percentage": false, "pluginVersion": "6.6.2", "pointradius": 2, "points": false, "renderer": "flot", "seriesOverrides": [], "spaceLength": 10, "stack": false, "steppedLine": false, "targets": [ { "alias": "Mo", "groupBy": [ { "params": [ "$__interval" ], "type": "time" }, { "params": [ "null" ], "type": "fill" } ], "measurement": "sourceanalytix.0.hs100__0__10_0_1_80__power.consumption.current_year.this_week.01_Monday", "orderByTime": "ASC", "policy": "default", "refId": "A", "resultFormat": "time_series", "select": [ [ { "params": [ "value" ], "type": "field" }, { "params": [], "type": "mean" } ] ], "tags": [] }, { "alias": "Di", "groupBy": [ { "params": [ "$__interval" ], "type": "time" }, { "params": [ "null" ], "type": "fill" } ], "measurement": "sourceanalytix.0.hs100__0__10_0_1_80__power.consumption.current_year.this_week.02_Tuesday", "orderByTime": "ASC", "policy": "default", "refId": "B", "resultFormat": "time_series", "select": [ [ { "params": [ "value" ], "type": "field" }, { "params": [], "type": "mean" } ] ], "tags": [] }, { "alias": "Mi", "groupBy": [ { "params": [ "$__interval" ], "type": "time" }, { "params": [ "null" ], "type": "fill" } ], "measurement": "sourceanalytix.0.hs100__0__10_0_1_80__power.consumption.current_year.this_week.03_Wednesday", "orderByTime": "ASC", "policy": "default", "refId": "C", "resultFormat": "time_series", "select": [ [ { "params": [ "value" ], "type": "field" }, { "params": [], "type": "mean" } ] ], "tags": [] }, { "alias": "Do", "groupBy": [ { "params": [ "$__interval" ], "type": "time" }, { "params": [ "null" ], "type": "fill" } ], "measurement": "sourceanalytix.0.hs100__0__10_0_1_80__power.consumption.current_year.this_week.04_Thursday", "orderByTime": "ASC", "policy": "default", "refId": "D", "resultFormat": "time_series", "select": [ [ { "params": [ "value" ], "type": "field" }, { "params": [], "type": "mean" } ] ], "tags": [] }, { "alias": "Fr", "groupBy": [ { "params": [ "$__interval" ], "type": "time" }, { "params": [ "null" ], "type": "fill" } ], "measurement": "sourceanalytix.0.hs100__0__10_0_1_80__power.consumption.current_year.this_week.05_Friday", "orderByTime": "ASC", "policy": "default", "refId": "E", "resultFormat": "time_series", "select": [ [ { "params": [ "value" ], "type": "field" }, { "params": [], "type": "mean" } ] ], "tags": [] }, { "alias": "Sa", "groupBy": [ { "params": [ "$__interval" ], "type": "time" }, { "params": [ "null" ], "type": "fill" } ], "measurement": "sourceanalytix.0.hs100__0__10_0_1_80__power.consumption.current_year.this_week.06_Saturday", "orderByTime": "ASC", "policy": "default", "refId": "F", "resultFormat": "time_series", "select": [ [ { "params": [ "value" ], "type": "field" }, { "params": [], "type": "mean" } ] ], "tags": [] }, { "alias": "So", "groupBy": [ { "params": [ "$__interval" ], "type": "time" }, { "params": [ "null" ], "type": "fill" } ], "measurement": "sourceanalytix.0.hs100__0__10_0_1_80__power.consumption.current_year.this_week.07_Sunday", "orderByTime": "ASC", "policy": "default", "refId": "G", "resultFormat": "time_series", "select": [ [ { "params": [ "value" ], "type": "field" }, { "params": [], "type": "mean" } ] ], "tags": [] } ], "thresholds": [], "timeFrom": "7d", "timeRegions": [], "timeShift": null, "title": "Serverschrank Tagesverbrauch", "tooltip": { "shared": false, "sort": 0, "value_type": "individual" }, "transparent": true, "type": "graph", "xaxis": { "buckets": null, "mode": "series", "name": null, "show": true, "values": [ "max" ] }, "yaxes": [ { "format": "kwatt", "label": null, "logBase": 1, "max": null, "min": null, "show": true }, { "format": "short", "label": null, "logBase": 1, "max": null, "min": null, "show": false } ], "yaxis": { "align": false, "alignLevel": null } }, { "aliasColors": { "Di": "rgb(219, 255, 0)", "Do": "rgb(255, 105, 0)", "Fr": "rgb(255, 18, 0)", "Mi": "rgb(0, 218, 255)", "Mo": "rgb(63, 255, 0)", "Sa": "rgb(0, 101, 255)", "So": "rgb(255, 0, 211)", "Tagesverbrauch": "dark-blue" }, "bars": true, "dashLength": 10, "dashes": false, "datasource": null, "fill": 1, "fillGradient": 0, "gridPos": { "h": 7, "w": 7, "x": 7, "y": 0 }, "hiddenSeries": false, "hideTimeOverride": true, "id": 20, "legend": { "alignAsTable": false, "avg": false, "current": false, "hideEmpty": false, "hideZero": false, "max": false, "min": false, "show": false, "total": false, "values": false }, "lines": false, "linewidth": 1, "nullPointMode": "connected", "options": { "dataLinks": [] }, "percentage": false, "pluginVersion": "6.6.2", "pointradius": 6, "points": false, "renderer": "flot", "seriesOverrides": [], "spaceLength": 10, "stack": false, "steppedLine": false, "targets": [ { "alias": "Mo", "groupBy": [ { "params": [ "$__interval" ], "type": "time" }, { "params": [ "null" ], "type": "fill" } ], "measurement": "sourceanalytix.0.hs100__0__10_0_1_77__power.consumption.current_year.this_week.01_Monday", "orderByTime": "ASC", "policy": "default", "refId": "A", "resultFormat": "time_series", "select": [ [ { "params": [ "value" ], "type": "field" }, { "params": [], "type": "mean" } ] ], "tags": [] }, { "alias": "Di", "groupBy": [ { "params": [ "$__interval" ], "type": "time" }, { "params": [ "null" ], "type": "fill" } ], "measurement": "sourceanalytix.0.hs100__0__10_0_1_77__power.consumption.current_year.this_week.02_Tuesday", "orderByTime": "ASC", "policy": "default", "refId": "B", "resultFormat": "time_series", "select": [ [ { "params": [ "value" ], "type": "field" }, { "params": [], "type": "mean" } ] ], "tags": [] }, { "alias": "Mi", "groupBy": [ { "params": [ "$__interval" ], "type": "time" }, { "params": [ "null" ], "type": "fill" } ], "measurement": "sourceanalytix.0.hs100__0__10_0_1_77__power.consumption.current_year.this_week.03_Wednesday", "orderByTime": "ASC", "policy": "default", "refId": "C", "resultFormat": "time_series", "select": [ [ { "params": [ "value" ], "type": "field" }, { "params": [], "type": "mean" } ] ], "tags": [] }, { "alias": "Do", "groupBy": [ { "params": [ "$__interval" ], "type": "time" }, { "params": [ "null" ], "type": "fill" } ], "measurement": "sourceanalytix.0.hs100__0__10_0_1_77__power.consumption.current_year.this_week.04_Thursday", "orderByTime": "ASC", "policy": "default", "refId": "D", "resultFormat": "time_series", "select": [ [ { "params": [ "value" ], "type": "field" }, { "params": [], "type": "mean" } ] ], "tags": [] }, { "alias": "Fr", "groupBy": [ { "params": [ "$__interval" ], "type": "time" }, { "params": [ "null" ], "type": "fill" } ], "measurement": "sourceanalytix.0.hs100__0__10_0_1_77__power.consumption.current_year.this_week.05_Friday", "orderByTime": "ASC", "policy": "default", "refId": "E", "resultFormat": "time_series", "select": [ [ { "params": [ "value" ], "type": "field" }, { "params": [], "type": "mean" } ] ], "tags": [] }, { "alias": "Sa", "groupBy": [ { "params": [ "$__interval" ], "type": "time" }, { "params": [ "null" ], "type": "fill" } ], "measurement": "sourceanalytix.0.hs100__0__10_0_1_77__power.consumption.current_year.this_week.06_Saturday", "orderByTime": "ASC", "policy": "default", "refId": "F", "resultFormat": "time_series", "select": [ [ { "params": [ "value" ], "type": "field" }, { "params": [], "type": "mean" } ] ], "tags": [] }, { "alias": "So", "groupBy": [ { "params": [ "$__interval" ], "type": "time" }, { "params": [ "null" ], "type": "fill" } ], "measurement": "sourceanalytix.0.hs100__0__10_0_1_77__power.consumption.current_year.this_week.07_Sunday", "orderByTime": "ASC", "policy": "default", "refId": "G", "resultFormat": "time_series", "select": [ [ { "params": [ "value" ], "type": "field" }, { "params": [], "type": "mean" } ] ], "tags": [] } ], "thresholds": [], "timeFrom": "7d", "timeRegions": [], "timeShift": null, "title": "Aquarium Tagesverbrauch", "tooltip": { "shared": false, "sort": 0, "value_type": "individual" }, "transparent": true, "type": "graph", "xaxis": { "buckets": null, "mode": "series", "name": null, "show": true, "values": [ "max" ] }, "yaxes": [ { "format": "kwatt", "label": "", "logBase": 1, "max": null, "min": null, "show": true }, { "format": "short", "label": null, "logBase": 1, "max": null, "min": null, "show": false } ], "yaxis": { "align": true, "alignLevel": 0 } }, { "aliasColors": { "Di": "rgb(234, 255, 0)", "Do": "rgb(255, 105, 0)", "Fr": "rgb(255, 0, 29)", "Mi": "rgb(0, 219, 255)", "Mo": "rgb(67, 255, 0)", "Sa": "rgb(0, 100, 255)", "So": "rgb(255, 0, 216)" }, "bars": true, "dashLength": 10, "dashes": false, "datasource": null, "fill": 1, "fillGradient": 0, "gridPos": { "h": 7, "w": 7, "x": 14, "y": 0 }, "hiddenSeries": false, "hideTimeOverride": true, "id": 16, "legend": { "alignAsTable": false, "avg": false, "current": false, "hideEmpty": false, "hideZero": false, "max": false, "min": false, "show": false, "total": false, "values": false }, "lines": false, "linewidth": 1, "nullPointMode": "connected", "options": { "dataLinks": [] }, "percentage": false, "pointradius": 2, "points": false, "renderer": "flot", "seriesOverrides": [], "spaceLength": 10, "stack": false, "steppedLine": false, "targets": [ { "alias": "Mo", "groupBy": [ { "params": [ "$__interval" ], "type": "time" }, { "params": [ "null" ], "type": "fill" } ], "measurement": "sourceanalytix.0.hs100__0__10_0_1_79__power.consumption.current_year.this_week.01_Monday", "orderByTime": "ASC", "policy": "default", "refId": "A", "resultFormat": "time_series", "select": [ [ { "params": [ "value" ], "type": "field" }, { "params": [], "type": "mean" } ] ], "tags": [] }, { "alias": "Di", "groupBy": [ { "params": [ "$__interval" ], "type": "time" }, { "params": [ "null" ], "type": "fill" } ], "measurement": "sourceanalytix.0.hs100__0__10_0_1_79__power.consumption.current_year.this_week.02_Tuesday", "orderByTime": "ASC", "policy": "default", "refId": "B", "resultFormat": "time_series", "select": [ [ { "params": [ "value" ], "type": "field" }, { "params": [], "type": "mean" } ] ], "tags": [] }, { "alias": "Mi", "groupBy": [ { "params": [ "$__interval" ], "type": "time" }, { "params": [ "null" ], "type": "fill" } ], "measurement": "sourceanalytix.0.hs100__0__10_0_1_79__power.consumption.current_year.this_week.03_Wednesday", "orderByTime": "ASC", "policy": "default", "refId": "C", "resultFormat": "time_series", "select": [ [ { "params": [ "value" ], "type": "field" }, { "params": [], "type": "mean" } ] ], "tags": [] }, { "alias": "Do", "groupBy": [ { "params": [ "$__interval" ], "type": "time" }, { "params": [ "null" ], "type": "fill" } ], "measurement": "sourceanalytix.0.hs100__0__10_0_1_79__power.consumption.current_year.this_week.04_Thursday", "orderByTime": "ASC", "policy": "default", "refId": "D", "resultFormat": "time_series", "select": [ [ { "params": [ "value" ], "type": "field" }, { "params": [], "type": "mean" } ] ], "tags": [] }, { "alias": "Fr", "groupBy": [ { "params": [ "$__interval" ], "type": "time" }, { "params": [ "null" ], "type": "fill" } ], "measurement": "sourceanalytix.0.hs100__0__10_0_1_79__power.consumption.current_year.this_week.05_Friday", "orderByTime": "ASC", "policy": "default", "refId": "E", "resultFormat": "time_series", "select": [ [ { "params": [ "value" ], "type": "field" }, { "params": [], "type": "mean" } ] ], "tags": [] }, { "alias": "Sa", "groupBy": [ { "params": [ "$__interval" ], "type": "time" }, { "params": [ "null" ], "type": "fill" } ], "measurement": "sourceanalytix.0.hs100__0__10_0_1_79__power.consumption.current_year.this_week.06_Saturday", "orderByTime": "ASC", "policy": "default", "refId": "F", "resultFormat": "time_series", "select": [ [ { "params": [ "value" ], "type": "field" }, { "params": [], "type": "mean" } ] ], "tags": [] }, { "alias": "So", "groupBy": [ { "params": [ "$__interval" ], "type": "time" }, { "params": [ "null" ], "type": "fill" } ], "measurement": "sourceanalytix.0.hs100__0__10_0_1_79__power.consumption.current_year.this_week.07_Sunday", "orderByTime": "ASC", "policy": "default", "refId": "G", "resultFormat": "time_series", "select": [ [ { "params": [ "value" ], "type": "field" }, { "params": [], "type": "mean" } ] ], "tags": [] } ], "thresholds": [], "timeFrom": "7d", "timeRegions": [], "timeShift": null, "title": "PC Tagesverbrauch", "tooltip": { "shared": false, "sort": 0, "value_type": "individual" }, "transparent": true, "type": "graph", "xaxis": { "buckets": null, "mode": "series", "name": null, "show": true, "values": [ "max" ] }, "yaxes": [ { "format": "kwatt", "label": null, "logBase": 1, "max": null, "min": null, "show": true }, { "format": "short", "label": null, "logBase": 1, "max": null, "min": null, "show": false } ], "yaxis": { "align": false, "alignLevel": null } }, { "aliasColors": { "Di": "rgb(234, 255, 0)", "Do": "rgb(255, 105, 0)", "Fr": "rgb(255, 0, 29)", "Mi": "rgb(0, 219, 255)", "Mo": "rgb(67, 255, 0)", "Sa": "rgb(0, 100, 255)", "So": "rgb(255, 0, 216)" }, "bars": true, "dashLength": 10, "dashes": false, "datasource": null, "fill": 1, "fillGradient": 0, "gridPos": { "h": 7, "w": 7, "x": 0, "y": 7 }, "hiddenSeries": false, "hideTimeOverride": true, "id": 27, "legend": { "alignAsTable": false, "avg": false, "current": false, "hideEmpty": false, "hideZero": false, "max": false, "min": false, "show": false, "total": false, "values": false }, "lines": false, "linewidth": 1, "nullPointMode": "connected", "options": { "dataLinks": [] }, "percentage": false, "pointradius": 2, "points": false, "renderer": "flot", "seriesOverrides": [], "spaceLength": 10, "stack": false, "steppedLine": false, "targets": [ { "alias": "Mo", "groupBy": [ { "params": [ "$__interval" ], "type": "time" }, { "params": [ "null" ], "type": "fill" } ], "measurement": "sourceanalytix.0.fronius__0__inverter__1__PAC.consumption.current_year.this_week.01_Monday", "orderByTime": "ASC", "policy": "default", "refId": "A", "resultFormat": "time_series", "select": [ [ { "params": [ "value" ], "type": "field" }, { "params": [], "type": "mean" } ] ], "tags": [] }, { "alias": "Di", "groupBy": [ { "params": [ "$__interval" ], "type": "time" }, { "params": [ "null" ], "type": "fill" } ], "measurement": "sourceanalytix.0.fronius__0__inverter__1__PAC.consumption.current_year.this_week.02_Tuesday", "orderByTime": "ASC", "policy": "default", "refId": "B", "resultFormat": "time_series", "select": [ [ { "params": [ "value" ], "type": "field" }, { "params": [], "type": "mean" } ] ], "tags": [] }, { "alias": "Mi", "groupBy": [ { "params": [ "$__interval" ], "type": "time" }, { "params": [ "null" ], "type": "fill" } ], "measurement": "sourceanalytix.0.fronius__0__inverter__1__PAC.consumption.current_year.this_week.03_Wednesday", "orderByTime": "ASC", "policy": "default", "refId": "C", "resultFormat": "time_series", "select": [ [ { "params": [ "value" ], "type": "field" }, { "params": [], "type": "mean" } ] ], "tags": [] }, { "alias": "Do", "groupBy": [ { "params": [ "$__interval" ], "type": "time" }, { "params": [ "null" ], "type": "fill" } ], "measurement": "sourceanalytix.0.fronius__0__inverter__1__PAC.consumption.current_year.this_week.04_Thursday", "orderByTime": "ASC", "policy": "default", "refId": "D", "resultFormat": "time_series", "select": [ [ { "params": [ "value" ], "type": "field" }, { "params": [], "type": "mean" } ] ], "tags": [] }, { "alias": "Fr", "groupBy": [ { "params": [ "$__interval" ], "type": "time" }, { "params": [ "null" ], "type": "fill" } ], "measurement": "sourceanalytix.0.fronius__0__inverter__1__PAC.consumption.current_year.this_week.05_Friday", "orderByTime": "ASC", "policy": "default", "refId": "E", "resultFormat": "time_series", "select": [ [ { "params": [ "value" ], "type": "field" }, { "params": [], "type": "mean" } ] ], "tags": [] }, { "alias": "Sa", "groupBy": [ { "params": [ "$__interval" ], "type": "time" }, { "params": [ "null" ], "type": "fill" } ], "measurement": "sourceanalytix.0.fronius__0__inverter__1__PAC.consumption.current_year.this_week.06_Saturday", "orderByTime": "ASC", "policy": "default", "refId": "F", "resultFormat": "time_series", "select": [ [ { "params": [ "value" ], "type": "field" }, { "params": [], "type": "mean" } ] ], "tags": [] }, { "alias": "So", "groupBy": [ { "params": [ "$__interval" ], "type": "time" }, { "params": [ "null" ], "type": "fill" } ], "measurement": "sourceanalytix.0.fronius__0__inverter__1__PAC.consumption.current_year.this_week.07_Sunday", "orderByTime": "ASC", "policy": "default", "refId": "G", "resultFormat": "time_series", "select": [ [ { "params": [ "value" ], "type": "field" }, { "params": [], "type": "mean" } ] ], "tags": [] } ], "thresholds": [], "timeFrom": "7d", "timeRegions": [], "timeShift": null, "title": "Photovoltaik Tageserzeugung", "tooltip": { "shared": false, "sort": 0, "value_type": "individual" }, "transparent": true, "type": "graph", "xaxis": { "buckets": null, "mode": "series", "name": null, "show": true, "values": [ "max" ] }, "yaxes": [ { "format": "kwatth", "label": null, "logBase": 1, "max": null, "min": null, "show": true }, { "format": "short", "label": null, "logBase": 1, "max": null, "min": null, "show": false } ], "yaxis": { "align": false, "alignLevel": null } }, { "aliasColors": { "Erzeugung": "rgb(63, 255, 0)" }, "bars": false, "dashLength": 10, "dashes": false, "datasource": null, "fill": 1, "fillGradient": 5, "gridPos": { "h": 7, "w": 7, "x": 7, "y": 7 }, "hiddenSeries": false, "hideTimeOverride": true, "id": 26, "legend": { "avg": false, "current": true, "max": true, "min": false, "show": true, "total": false, "values": true }, "lines": true, "linewidth": 1, "nullPointMode": "connected", "options": { "dataLinks": [] }, "percentage": false, "pointradius": 2, "points": false, "renderer": "flot", "seriesOverrides": [], "spaceLength": 10, "stack": false, "steppedLine": false, "targets": [ { "alias": "Erzeugung", "groupBy": [ { "params": [ "$__interval" ], "type": "time" }, { "params": [ "0" ], "type": "fill" } ], "measurement": "fronius.0.inverter.1.PAC", "orderByTime": "ASC", "policy": "default", "refId": "A", "resultFormat": "time_series", "select": [ [ { "params": [ "value" ], "type": "field" }, { "params": [], "type": "mean" } ] ], "tags": [] } ], "thresholds": [], "timeFrom": "24h", "timeRegions": [], "timeShift": null, "title": "Photovoltaik Erzeugung 24 Stunden", "tooltip": { "shared": true, "sort": 0, "value_type": "individual" }, "transparent": true, "type": "graph", "xaxis": { "buckets": null, "mode": "time", "name": null, "show": true, "values": [] }, "yaxes": [ { "format": "watth", "label": null, "logBase": 1, "max": null, "min": null, "show": true }, { "format": "short", "label": null, "logBase": 1, "max": null, "min": null, "show": false } ], "yaxis": { "align": false, "alignLevel": null } }, { "aliasColors": { "AKTUELLER_VERBRAUCH.mean": "dark-red", "Aktuelle Erzeugung": "rgb(0, 114, 255)", "Aktuelle Lieferung": "rgb(26, 255, 0)", "Aktueller Verbrauch": "rgb(255, 0, 27)" }, "bars": false, "dashLength": 10, "dashes": false, "datasource": null, "decimals": 2, "fill": 5, "fillGradient": 0, "gridPos": { "h": 7, "w": 7, "x": 14, "y": 7 }, "hiddenSeries": false, "hideTimeOverride": true, "id": 2, "legend": { "alignAsTable": false, "avg": false, "current": true, "hideEmpty": false, "hideZero": false, "max": true, "min": false, "rightSide": false, "show": true, "total": false, "values": true }, "lines": true, "linewidth": 1, "nullPointMode": "connected", "options": { "dataLinks": [] }, "percentage": false, "pointradius": 2, "points": false, "renderer": "flot", "seriesOverrides": [], "spaceLength": 10, "stack": false, "steppedLine": false, "targets": [ { "alias": "Aktuelle Lieferung", "groupBy": [ { "params": [ "$__interval" ], "type": "time" }, { "params": [ "previous" ], "type": "fill" } ], "measurement": "AKTUELLE_LIEFERUNG", "orderByTime": "ASC", "policy": "default", "refId": "A", "resultFormat": "time_series", "select": [ [ { "params": [ "value" ], "type": "field" }, { "params": [], "type": "last" } ] ], "tags": [] }, { "alias": "Aktueller Verbrauch", "groupBy": [ { "params": [ "$__interval" ], "type": "time" }, { "params": [ "previous" ], "type": "fill" } ], "measurement": "AKTUELLER_VERBRAUCH", "orderByTime": "ASC", "policy": "default", "refId": "B", "resultFormat": "time_series", "select": [ [ { "params": [ "value" ], "type": "field" }, { "params": [], "type": "last" } ] ], "tags": [] }, { "alias": "Aktuelle Erzeugung", "groupBy": [ { "params": [ "$__interval" ], "type": "time" }, { "params": [ "previous" ], "type": "fill" } ], "measurement": "fronius.0.inverter.1.PAC", "orderByTime": "ASC", "policy": "default", "refId": "C", "resultFormat": "time_series", "select": [ [ { "params": [ "value" ], "type": "field" }, { "params": [], "type": "last" } ] ], "tags": [] } ], "thresholds": [], "timeFrom": "24h", "timeRegions": [], "timeShift": null, "title": "Strom Verbrauch/Lieferung/Erzeugung 24 Stunden", "tooltip": { "shared": true, "sort": 0, "value_type": "individual" }, "transparent": true, "type": "graph", "xaxis": { "buckets": null, "mode": "time", "name": null, "show": true, "values": [] }, "yaxes": [ { "decimals": null, "format": "watth", "label": null, "logBase": 1, "max": null, "min": "0", "show": true }, { "decimals": null, "format": "watt", "label": null, "logBase": 1, "max": null, "min": "0", "show": false } ], "yaxis": { "align": false, "alignLevel": 0 } }, { "aliasColors": { "Verbrauch": "rgb(29, 255, 0)" }, "bars": false, "dashLength": 10, "dashes": false, "datasource": null, "fill": 5, "fillGradient": 10, "gridPos": { "h": 7, "w": 7, "x": 0, "y": 14 }, "hiddenSeries": false, "hideTimeOverride": true, "id": 22, "legend": { "alignAsTable": false, "avg": false, "current": true, "max": false, "min": false, "show": true, "total": false, "values": true }, "lines": true, "linewidth": 1, "nullPointMode": "connected", "options": { "dataLinks": [] }, "percentage": false, "pointradius": 2, "points": false, "renderer": "flot", "seriesOverrides": [], "spaceLength": 10, "stack": false, "steppedLine": false, "targets": [ { "alias": "Verbrauch", "groupBy": [ { "params": [ "$__interval" ], "type": "time" }, { "params": [ "null" ], "type": "fill" } ], "measurement": "Serverschrank_aktuell", "orderByTime": "ASC", "policy": "default", "refId": "A", "resultFormat": "time_series", "select": [ [ { "params": [ "value" ], "type": "field" }, { "params": [], "type": "mean" } ] ], "tags": [] } ], "thresholds": [], "timeFrom": "now/d", "timeRegions": [], "timeShift": null, "title": "Serverschrank aktuell", "tooltip": { "shared": true, "sort": 0, "value_type": "individual" }, "transparent": true, "type": "graph", "xaxis": { "buckets": null, "mode": "time", "name": null, "show": true, "values": [] }, "yaxes": [ { "format": "watt", "label": "", "logBase": 1, "max": null, "min": null, "show": true }, { "format": "short", "label": null, "logBase": 1, "max": null, "min": null, "show": false } ], "yaxis": { "align": false, "alignLevel": null } }, { "aliasColors": { "Aquarium_aktuell.mean": "rgb(60, 255, 0)", "Verbrauch": "rgb(59, 255, 0)" }, "bars": false, "dashLength": 10, "dashes": false, "datasource": null, "fill": 5, "fillGradient": 10, "gridPos": { "h": 7, "w": 7, "x": 7, "y": 14 }, "hiddenSeries": false, "hideTimeOverride": true, "id": 18, "interval": "", "legend": { "alignAsTable": false, "avg": false, "current": true, "hideEmpty": false, "hideZero": false, "max": true, "min": true, "show": true, "total": false, "values": true }, "lines": true, "linewidth": 1, "nullPointMode": "connected", "options": { "dataLinks": [] }, "percentage": false, "pointradius": 2, "points": false, "renderer": "flot", "repeat": null, "seriesOverrides": [], "spaceLength": 10, "stack": false, "steppedLine": false, "targets": [ { "alias": "Verbrauch", "groupBy": [ { "params": [ "$__interval" ], "type": "time" }, { "params": [ "null" ], "type": "fill" } ], "measurement": "Aquarium_aktuell", "orderByTime": "ASC", "policy": "default", "refId": "A", "resultFormat": "time_series", "select": [ [ { "params": [ "value" ], "type": "field" }, { "params": [], "type": "mean" } ] ], "tags": [] } ], "thresholds": [], "timeFrom": "now/d", "timeRegions": [], "timeShift": null, "title": "Aquarium aktuell", "tooltip": { "shared": true, "sort": 0, "value_type": "individual" }, "transparent": true, "type": "graph", "xaxis": { "buckets": null, "mode": "time", "name": null, "show": true, "values": [] }, "yaxes": [ { "decimals": null, "format": "watt", "label": "", "logBase": 1, "max": null, "min": null, "show": true }, { "format": "short", "label": null, "logBase": 1, "max": null, "min": null, "show": false } ], "yaxis": { "align": false, "alignLevel": null } }, { "aliasColors": { "aktuell": "rgb(29, 255, 0)" }, "bars": false, "dashLength": 10, "dashes": false, "datasource": null, "fill": 5, "fillGradient": 10, "gridPos": { "h": 7, "w": 7, "x": 14, "y": 14 }, "hiddenSeries": false, "hideTimeOverride": true, "id": 14, "legend": { "alignAsTable": false, "avg": false, "current": true, "hideEmpty": false, "hideZero": false, "max": true, "min": true, "show": true, "total": false, "values": true }, "lines": true, "linewidth": 1, "nullPointMode": "connected", "options": { "dataLinks": [] }, "percentage": false, "pointradius": 2, "points": false, "renderer": "flot", "seriesOverrides": [], "spaceLength": 10, "stack": false, "steppedLine": false, "targets": [ { "alias": "aktuell", "groupBy": [ { "params": [ "$__interval" ], "type": "time" }, { "params": [ "null" ], "type": "fill" } ], "measurement": "PC_aktuell", "orderByTime": "ASC", "policy": "default", "refId": "A", "resultFormat": "time_series", "select": [ [ { "params": [ "value" ], "type": "field" }, { "params": [], "type": "mean" } ] ], "tags": [] } ], "thresholds": [], "timeFrom": "now/d", "timeRegions": [], "timeShift": null, "title": "PC aktuell", "tooltip": { "shared": true, "sort": 0, "value_type": "individual" }, "transparent": true, "type": "graph", "xaxis": { "buckets": null, "mode": "time", "name": null, "show": true, "values": [] }, "yaxes": [ { "format": "watt", "label": null, "logBase": 1, "max": null, "min": null, "show": true }, { "format": "short", "label": null, "logBase": 1, "max": null, "min": null, "show": false } ], "yaxis": { "align": false, "alignLevel": null } }, { "aliasColors": { "Aussentemperatur": "rgb(0, 100, 255)", "Temperatur_aussen_aktuell.mean": "rgb(23, 0, 255)" }, "bars": false, "dashLength": 10, "dashes": false, "datasource": null, "decimals": 2, "description": "", "fill": 5, "fillGradient": 10, "gridPos": { "h": 7, "w": 7, "x": 0, "y": 21 }, "hiddenSeries": false, "hideTimeOverride": true, "id": 12, "legend": { "alignAsTable": false, "avg": false, "current": true, "max": true, "min": true, "show": true, "total": false, "values": true }, "lines": true, "linewidth": 1, "nullPointMode": "connected", "options": { "dataLinks": [] }, "percentage": false, "pointradius": 2, "points": false, "renderer": "flot", "seriesOverrides": [], "spaceLength": 10, "stack": false, "steppedLine": false, "targets": [ { "alias": "Aussentemperatur", "groupBy": [ { "params": [ "$__interval" ], "type": "time" }, { "params": [ "null" ], "type": "fill" } ], "measurement": "Aussentemp-Keller", "orderByTime": "ASC", "policy": "default", "refId": "A", "resultFormat": "time_series", "select": [ [ { "params": [ "value" ], "type": "field" }, { "params": [], "type": "mean" } ] ], "tags": [] } ], "thresholds": [], "timeFrom": "24h", "timeRegions": [], "timeShift": null, "title": "Aussentemperatur", "tooltip": { "shared": true, "sort": 0, "value_type": "individual" }, "transparent": true, "type": "graph", "xaxis": { "buckets": null, "mode": "time", "name": null, "show": true, "values": [] }, "yaxes": [ { "decimals": null, "format": "celsius", "label": null, "logBase": 1, "max": null, "min": null, "show": true }, { "format": "short", "label": null, "logBase": 1, "max": null, "min": null, "show": false } ], "yaxis": { "align": false, "alignLevel": null } }, { "aliasColors": { "Bad": "rgb(64, 255, 0)", "Kinderzimmer": "rgb(255, 0, 4)", "Temperatur_Bad.mean": "rgb(65, 255, 0)", "Temperatur_KiZi.mean": "rgb(255, 183, 0)", "Temperatur_WoZi.mean": "rgb(0, 218, 255)", "Wohnzimmer": "rgb(0, 218, 255)" }, "bars": false, "dashLength": 10, "dashes": false, "datasource": null, "decimals": 2, "fill": 5, "fillGradient": 10, "gridPos": { "h": 7, "w": 7, "x": 7, "y": 21 }, "hiddenSeries": false, "hideTimeOverride": true, "id": 10, "legend": { "alignAsTable": false, "avg": false, "current": false, "hideEmpty": false, "hideZero": false, "max": false, "min": false, "show": true, "total": false, "values": false }, "lines": true, "linewidth": 1, "nullPointMode": "connected", "options": { "dataLinks": [] }, "percentage": false, "pointradius": 2, "points": false, "renderer": "flot", "seriesOverrides": [], "spaceLength": 10, "stack": false, "steppedLine": false, "targets": [ { "alias": "Bad", "groupBy": [ { "params": [ "$__interval" ], "type": "time" }, { "params": [ "null" ], "type": "fill" } ], "measurement": "Temperatur_Bad", "orderByTime": "ASC", "policy": "default", "refId": "A", "resultFormat": "time_series", "select": [ [ { "params": [ "value" ], "type": "field" }, { "params": [], "type": "mean" } ] ], "tags": [] }, { "alias": "Kinderzimmer", "groupBy": [ { "params": [ "$__interval" ], "type": "time" }, { "params": [ "null" ], "type": "fill" } ], "measurement": "Temperatur_KiZi", "orderByTime": "ASC", "policy": "default", "refId": "B", "resultFormat": "time_series", "select": [ [ { "params": [ "value" ], "type": "field" }, { "params": [], "type": "mean" } ] ], "tags": [] }, { "alias": "Wohnzimmer", "groupBy": [ { "params": [ "$__interval" ], "type": "time" }, { "params": [ "null" ], "type": "fill" } ], "measurement": "Temperatur_WoZi", "orderByTime": "ASC", "policy": "default", "refId": "C", "resultFormat": "time_series", "select": [ [ { "params": [ "value" ], "type": "field" }, { "params": [], "type": "mean" } ] ], "tags": [] } ], "thresholds": [], "timeFrom": "24h", "timeRegions": [], "timeShift": null, "title": "Zimmertemperatur", "tooltip": { "shared": true, "sort": 0, "value_type": "individual" }, "transparent": true, "type": "graph", "xaxis": { "buckets": null, "mode": "time", "name": null, "show": true, "values": [] }, "yaxes": [ { "decimals": 2, "format": "celsius", "label": null, "logBase": 1, "max": null, "min": null, "show": true }, { "format": "short", "label": null, "logBase": 1, "max": null, "min": null, "show": false } ], "yaxis": { "align": true, "alignLevel": 0 } }, { "aliasColors": { "Download": "rgb(63, 255, 0)", "Upload": "rgb(255, 0, 23)", "Webspeedy Download.mean": "rgb(58, 255, 0)" }, "bars": false, "dashLength": 10, "dashes": false, "datasource": null, "fill": 5, "fillGradient": 0, "gridPos": { "h": 7, "w": 7, "x": 14, "y": 21 }, "hiddenSeries": false, "id": 6, "legend": { "alignAsTable": false, "avg": false, "current": false, "max": true, "min": true, "show": true, "total": false, "values": true }, "lines": true, "linewidth": 1, "nullPointMode": "connected", "options": { "dataLinks": [] }, "percentage": false, "pointradius": 2, "points": false, "renderer": "flot", "seriesOverrides": [], "spaceLength": 10, "stack": false, "steppedLine": false, "targets": [ { "alias": "Download", "groupBy": [ { "params": [ "$__interval" ], "type": "time" }, { "params": [ "null" ], "type": "fill" } ], "measurement": "Webspeedy Download", "orderByTime": "ASC", "policy": "default", "refId": "A", "resultFormat": "time_series", "select": [ [ { "params": [ "value" ], "type": "field" }, { "params": [], "type": "last" } ] ], "tags": [] }, { "alias": "Upload", "groupBy": [ { "params": [ "$__interval" ], "type": "time" }, { "params": [ "null" ], "type": "fill" } ], "measurement": "Webspeedy Upload", "orderByTime": "ASC", "policy": "default", "refId": "B", "resultFormat": "time_series", "select": [ [ { "params": [ "value" ], "type": "field" }, { "params": [], "type": "last" } ] ], "tags": [] } ], "thresholds": [], "timeFrom": "24h", "timeRegions": [], "timeShift": null, "title": "Speedtest", "tooltip": { "shared": true, "sort": 0, "value_type": "individual" }, "transparent": true, "type": "graph", "xaxis": { "buckets": null, "mode": "time", "name": null, "show": true, "values": [] }, "yaxes": [ { "decimals": 2, "format": "Mbits", "label": "", "logBase": 1, "max": null, "min": "0", "show": true }, { "format": "short", "label": null, "logBase": 1, "max": null, "min": null, "show": false } ], "yaxis": { "align": true, "alignLevel": 0 } } ], "refresh": "1m", "schemaVersion": 22, "style": "dark", "tags": [], "templating": { "list": [] }, "time": { "from": "now-24h", "to": "now" }, "timepicker": { "refresh_intervals": [ "5s", "10s", "30s", "1m", "5m", "15m", "30m", "1h", "2h", "1d" ] }, "timezone": "", "title": "Allgemein", "uid": "XMW0dj_Wz", "version": 119 }@Negalein Dankeschön, super, hat funktioniert!
Du verwendest den Sourceanalytix Adapter dazu, der legt die Tage an, so gehts.. ich verwende immer noch das olle Javascript mit der Verbrauchsmessung ( das erste, was damals so umherging..) :-) -
@Negalein Dankeschön, super, hat funktioniert!
Du verwendest den Sourceanalytix Adapter dazu, der legt die Tage an, so gehts.. ich verwende immer noch das olle Javascript mit der Verbrauchsmessung ( das erste, was damals so umherging..) :-)@ilovegym sagte in VIS von Sigi234:
Dankeschön, super, hat funktioniert!
freut mich
Du verwendest den Sourceanalytix Adapter dazu, der legt die Tage an, so gehts.. ich verwende immer noch das olle Javascript mit der Verbrauchsmessung ( das erste, was damals so umherging..) 🙂
Ja, aber noch in Version 0.3.0
Die 0.4.x läuft noch nicht so rund. -
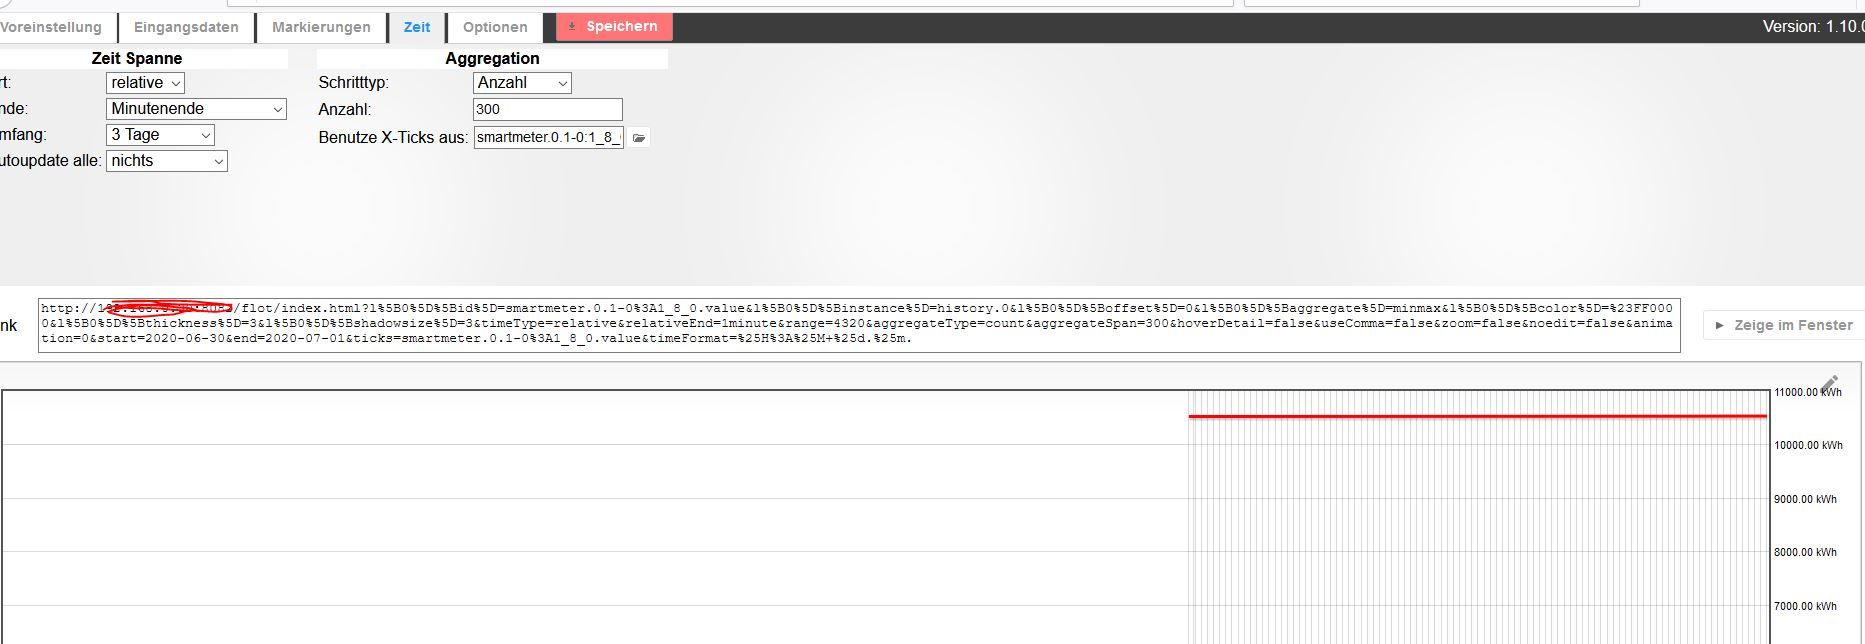
Hallo, ich würde auch gerne meinen Stromverbrauch darstellen. Meinen Zähler lese ich mit dem Weidmann Lesekopf aus und bekomme ihn über die Smartmeter App in IO Broker. Leider bekomme ich nur die Linie mit dem absoluten Zählerstand. Zusätzlich habe ich den History Adapter installiert und die Linie aus dem Smartmeter hinzugefügt. Jetzt würde ich das gerne als Grafik bzw. auch als Stände darstellen .
Irgendwie bekomme ich bei Sourceanalytics keine Tagesstände. Und die Wochenstände passen nicht.
Beim Darstellen in Flot bekomme ich aber nur eine durchgängige Linie, weil ich logischerweise den Gesamt Zählerstand habe.
=:( kann ich die Sourceanalytics 0.3.0 noch irgendwo bekommen, wenn diese funktioniert hat oder gibt es eine alternative ? Kann ich auch Werte aus History darstellen ? Was muss ich machen, damit ich in Flot vernünftig darstellen kann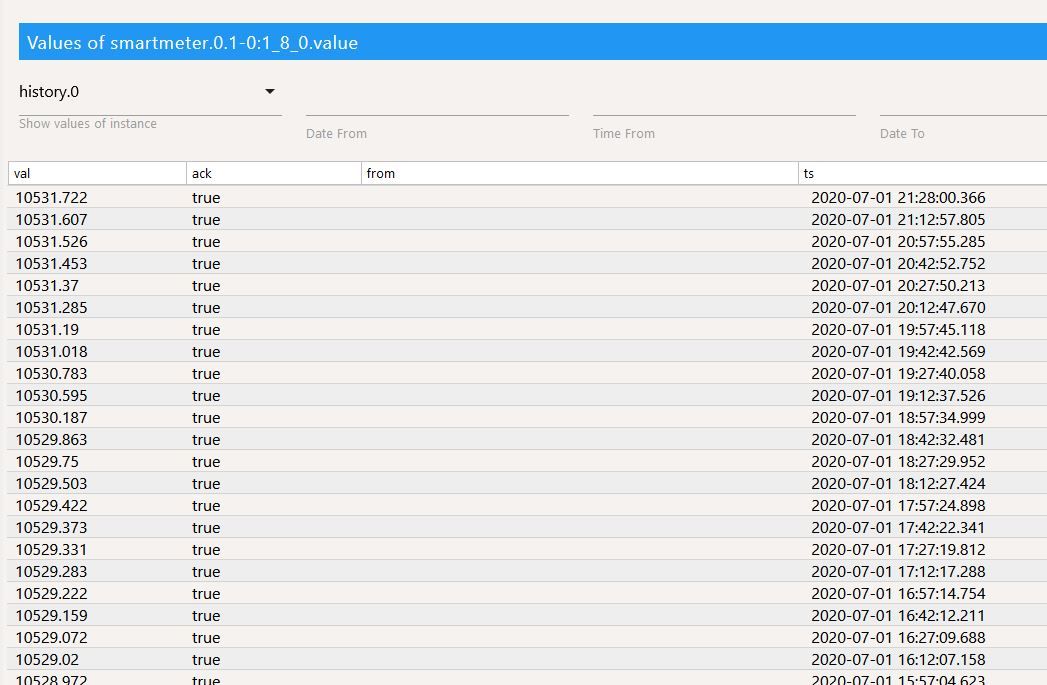
-
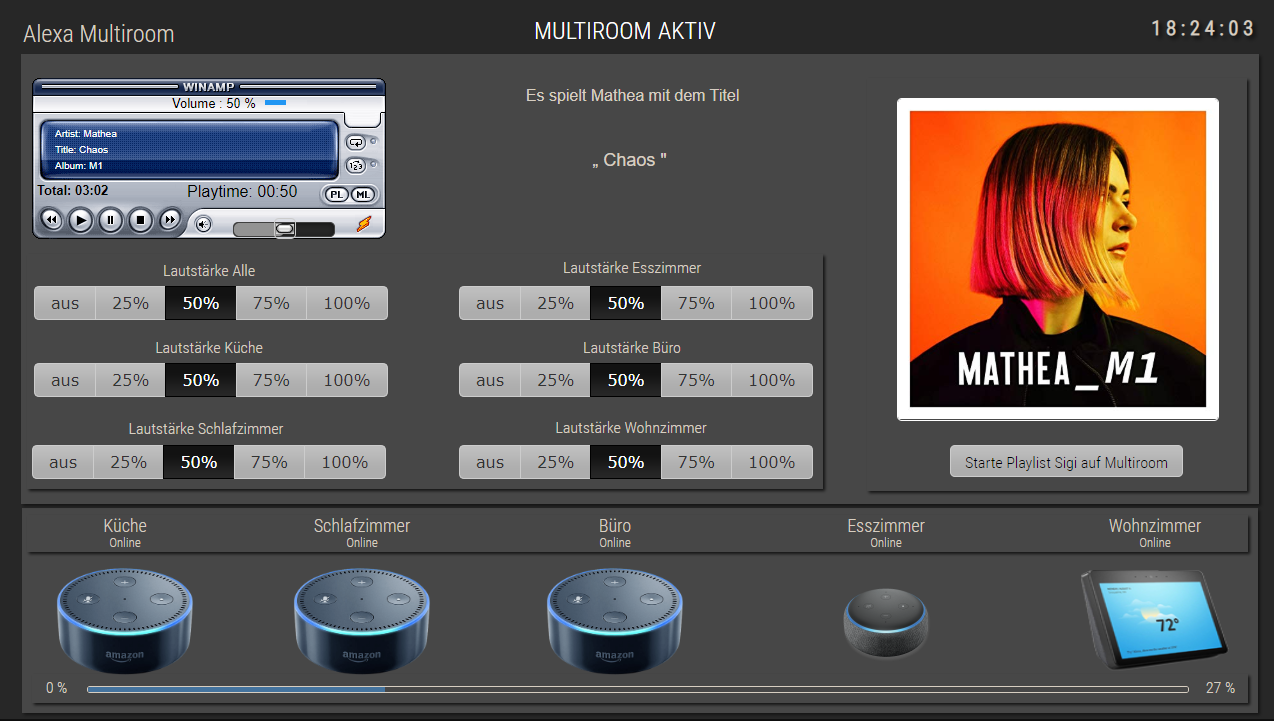
@schmerenko sagte in VIS von Sigi234:
@sigi234 Hast du hierfür eine Lösung gefunden ? Für das Multiroom Problem .
Noch nicht.
@sigi234
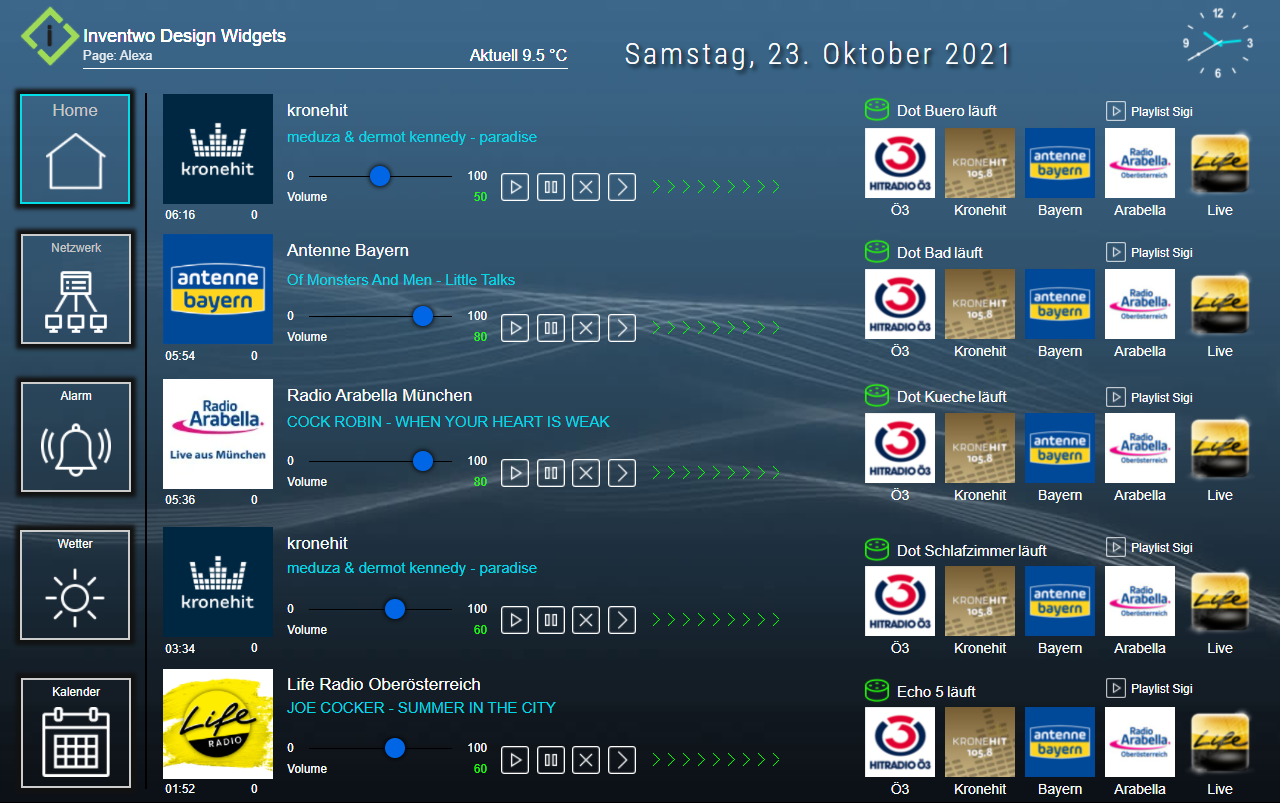
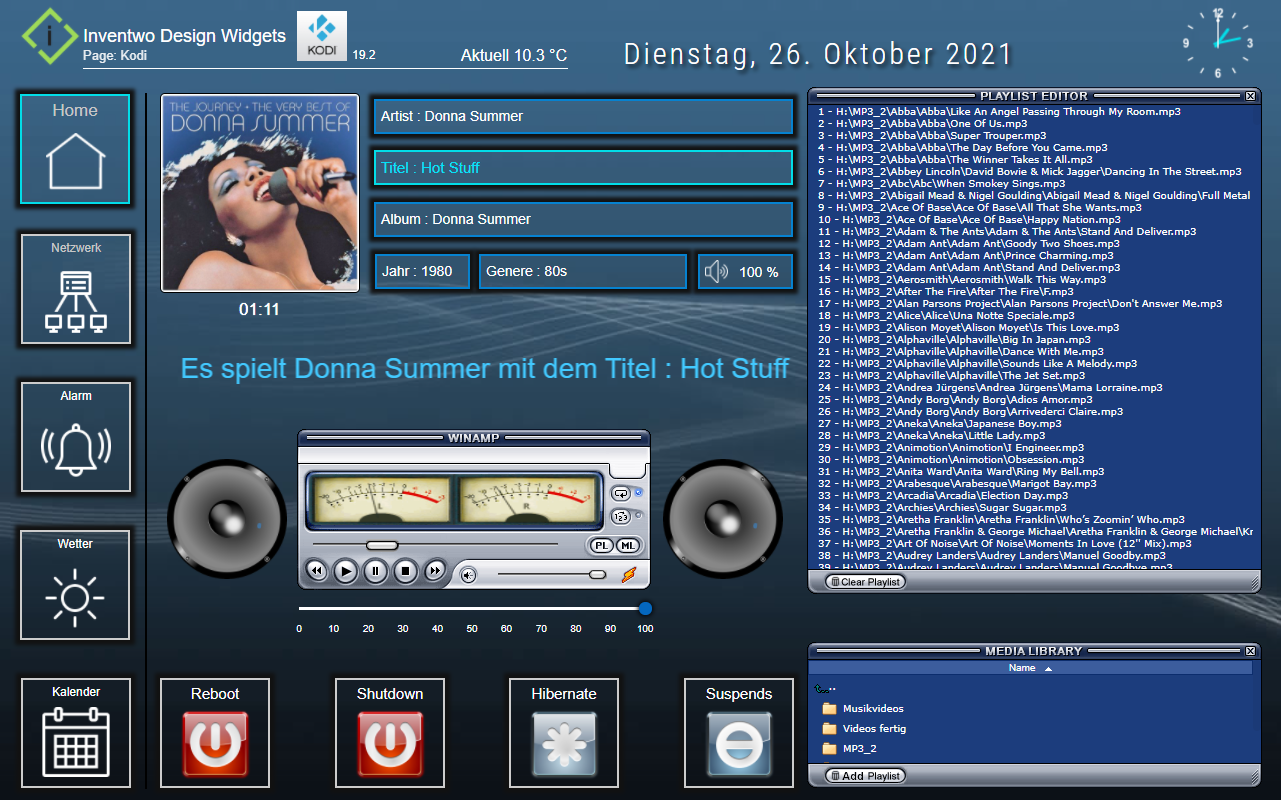
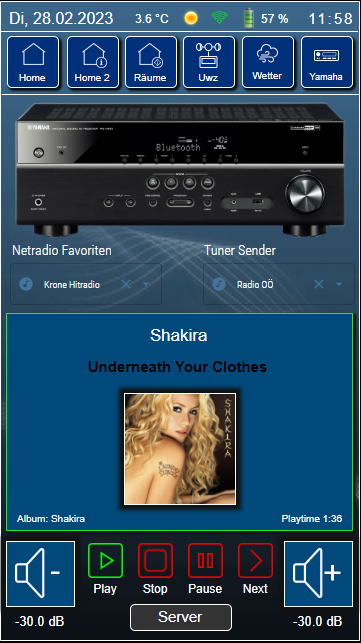
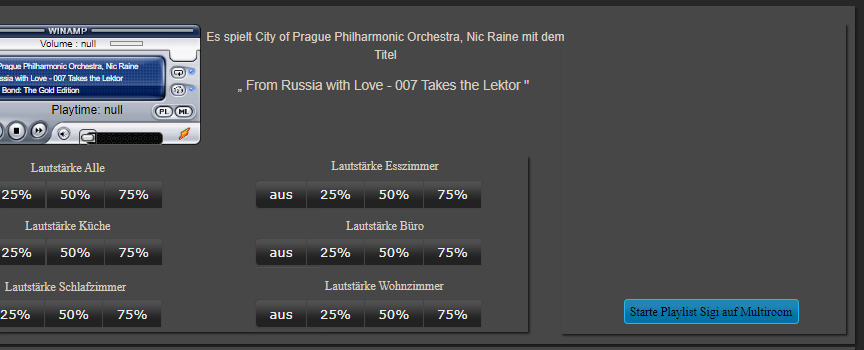
Multiroom läuft wieder, ich bekomme das Coverbild nur nicht eingeblendet, was ist zu tun ?
-
@sigi234
Multiroom läuft wieder, ich bekomme das Coverbild nur nicht eingeblendet, was ist zu tun ?

Geht bei mir, was steht im DP?
Wie spielst du ab?
z-index angepasst? -
Geht bei mir, was steht im DP?
Wie spielst du ab?
z-index angepasst?@sigi234
dies steht z.B. im DP:

Wenn ich den DP Wert im Browser (Chrom) eingebe zeigt er mit das Cover
Hinter dem Button "Starte Playlist Sigi auf Multiroom" ist meine Playlist Jens abgelegt
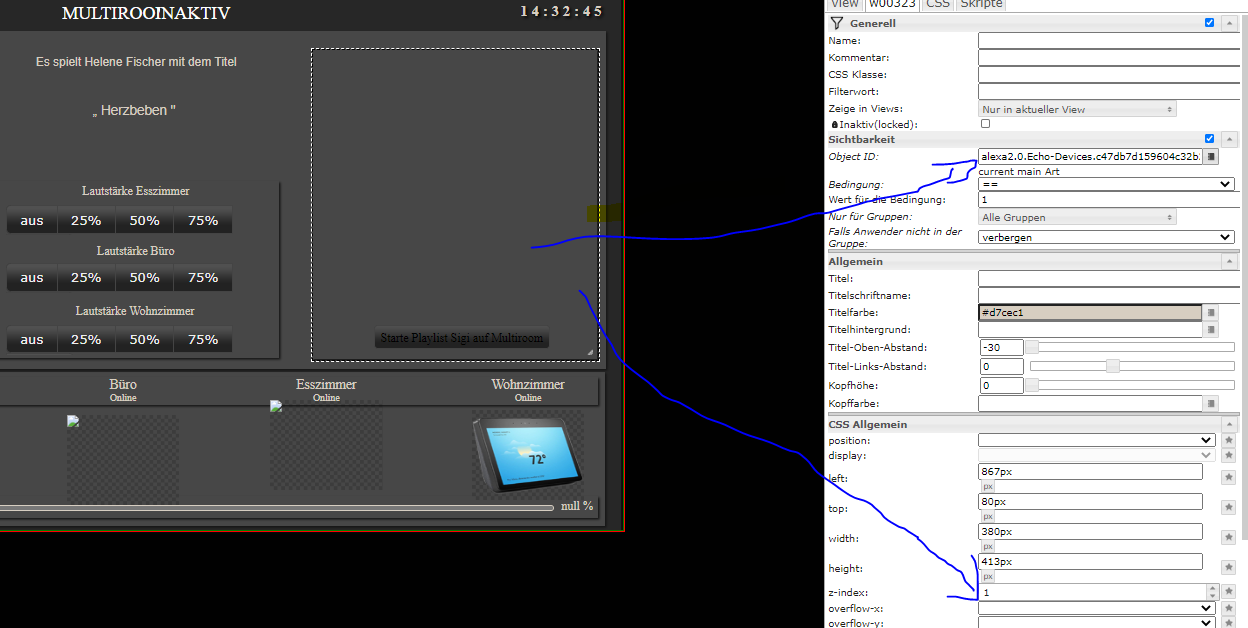
Z-Index ist auf eins und die Objekt ID ist auf current main Art
-
@sigi234
dies steht z.B. im DP:

Wenn ich den DP Wert im Browser (Chrom) eingebe zeigt er mit das Cover
Hinter dem Button "Starte Playlist Sigi auf Multiroom" ist meine Playlist Jens abgelegt
Z-Index ist auf eins und die Objekt ID ist auf current main Art

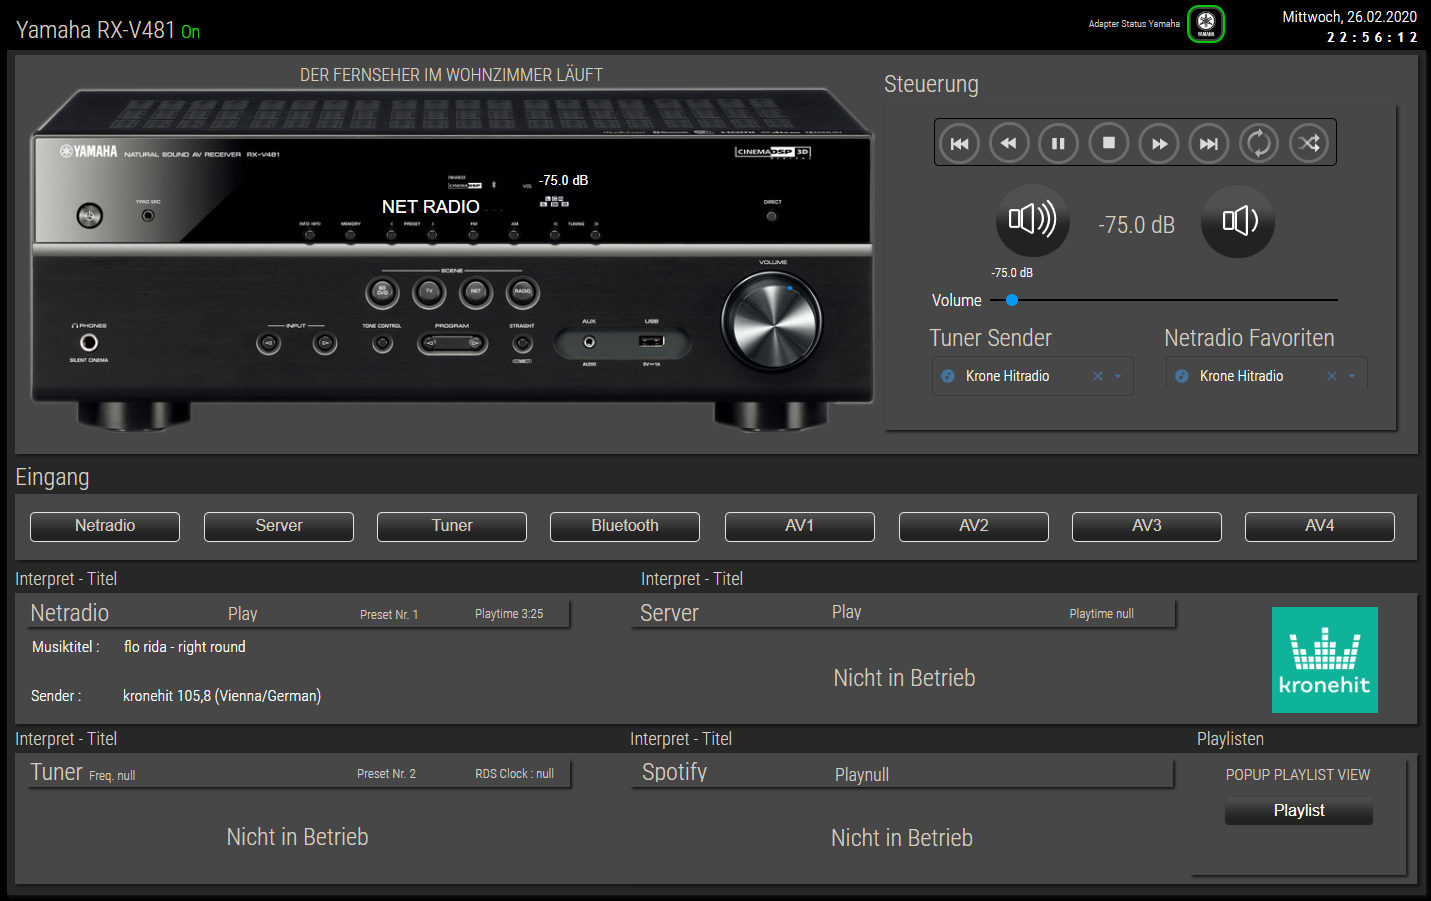
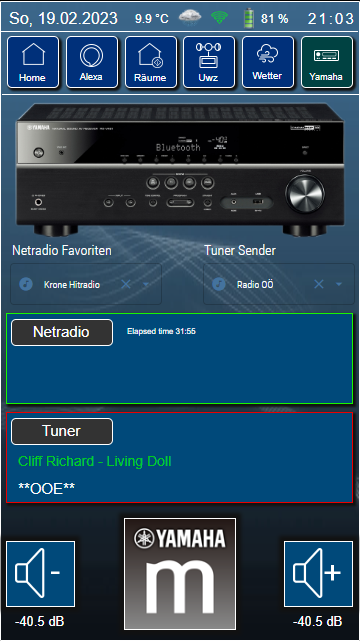
Ich nehme da den Yamaha Musiccast Adapter
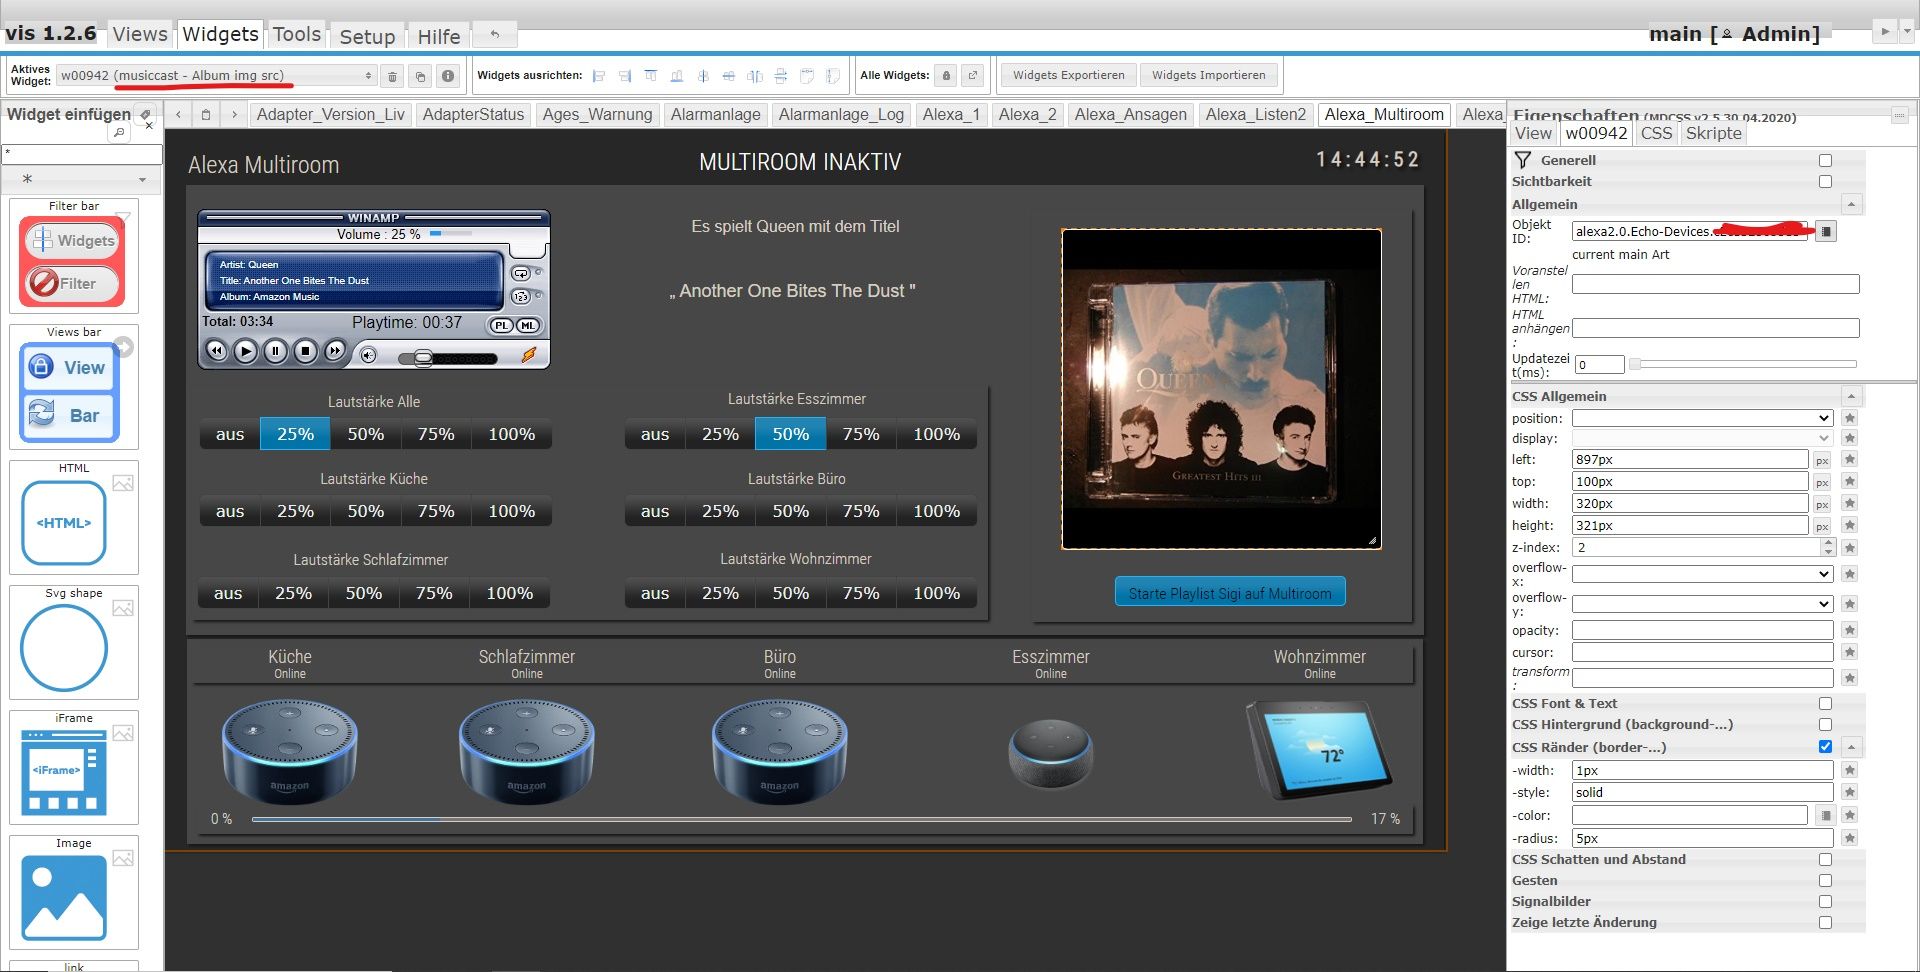
Teste es mal mit den Widget Basic String img src
Ist nicht so ohne, da Amazon da eigen ist.
-
Ich nehme da den Yamaha Musiccast Adapter

Teste es mal mit den Widget Basic String img src
Ist nicht so ohne, da Amazon da eigen ist.
@sigi234
OK, jetzt muss ich mich mit dem Adapter beschäftigen, ich wusste nicht das ich den benötige um die Cover-Bilder anzuzeigen.
Danke05.07.2020 Cover wird nun übertragen ! Danke für deine Hilfe
-
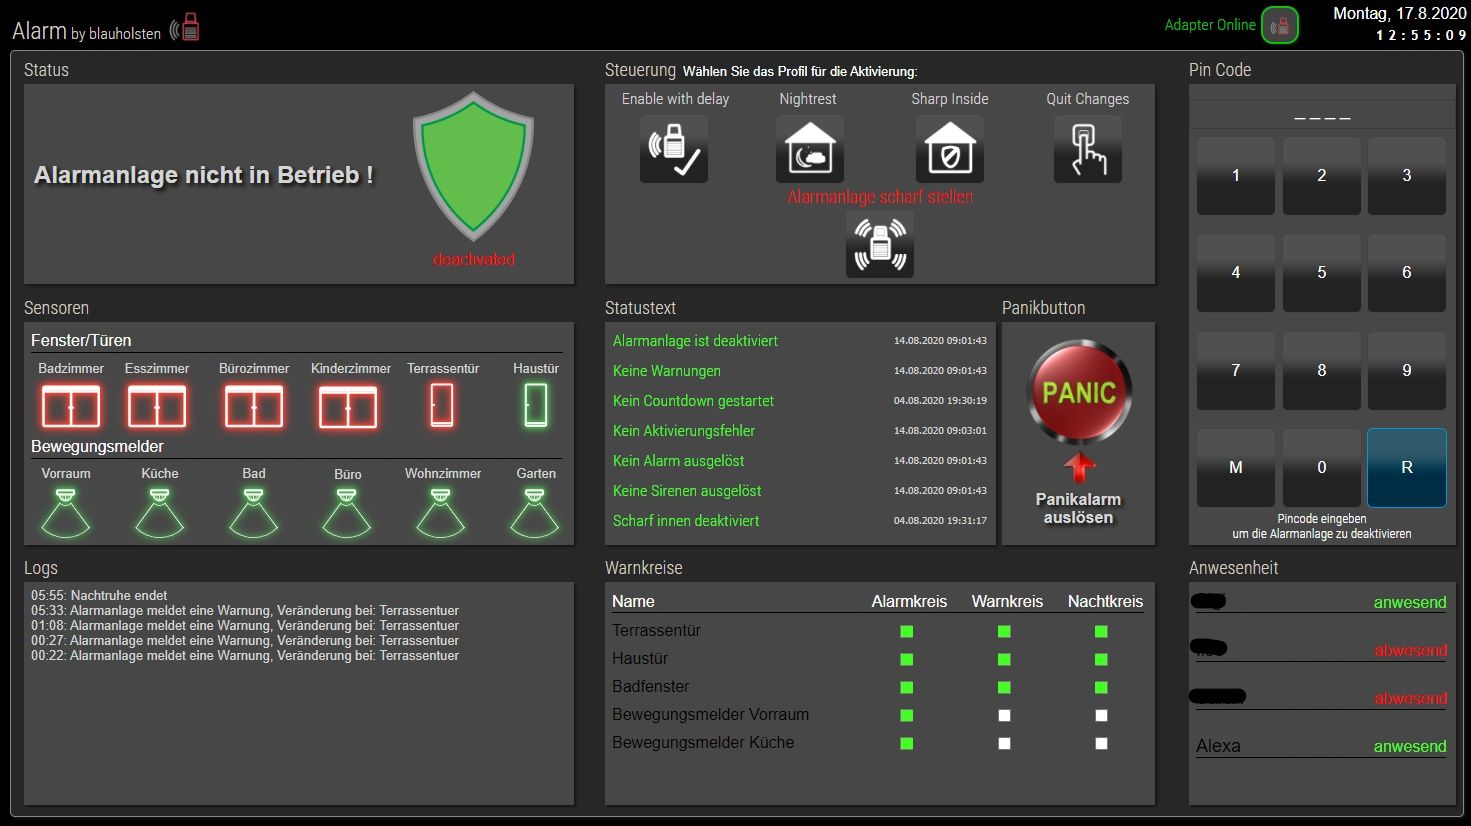
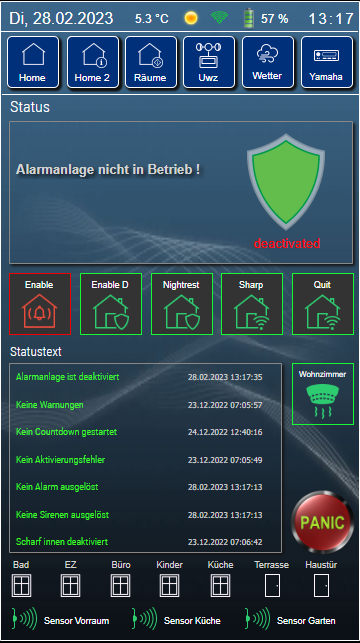
Könntest Du mir noch sagen welche zusätzlichen Icons oder Bilder ich noch für die Alarmanlage benötige?
@kilasat sagte in VIS von Sigi234:
Könntest Du mir noch sagen welche zusätzlichen Icons oder Bilder ich noch für die Alarmanlage benötige?
Sind in der rar von
https://forum.iobroker.net/topic/31657/test-adapter-alarm-1-1-x/205?page=16
Zeig mal einen Screenshot dann sehe ich was dir fehlt, du musst natürliche deine DP anpassen.


