

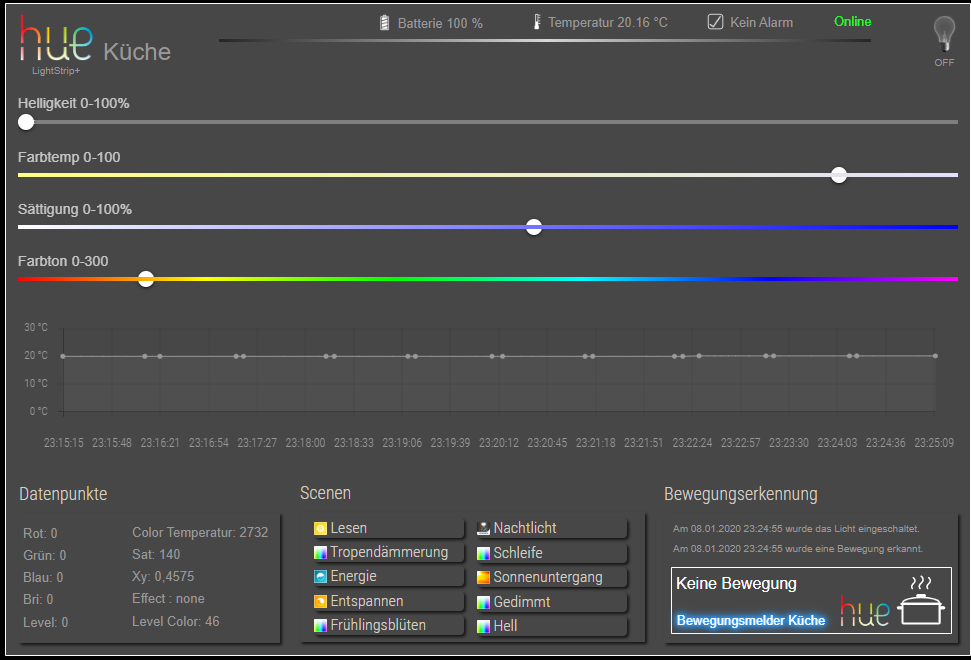
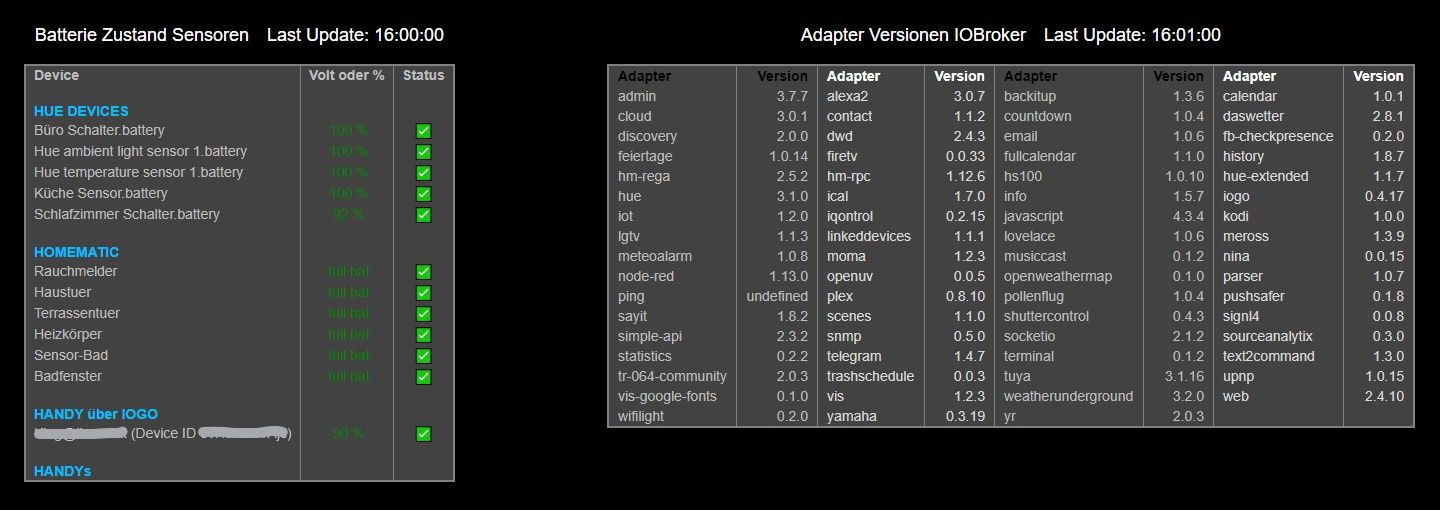
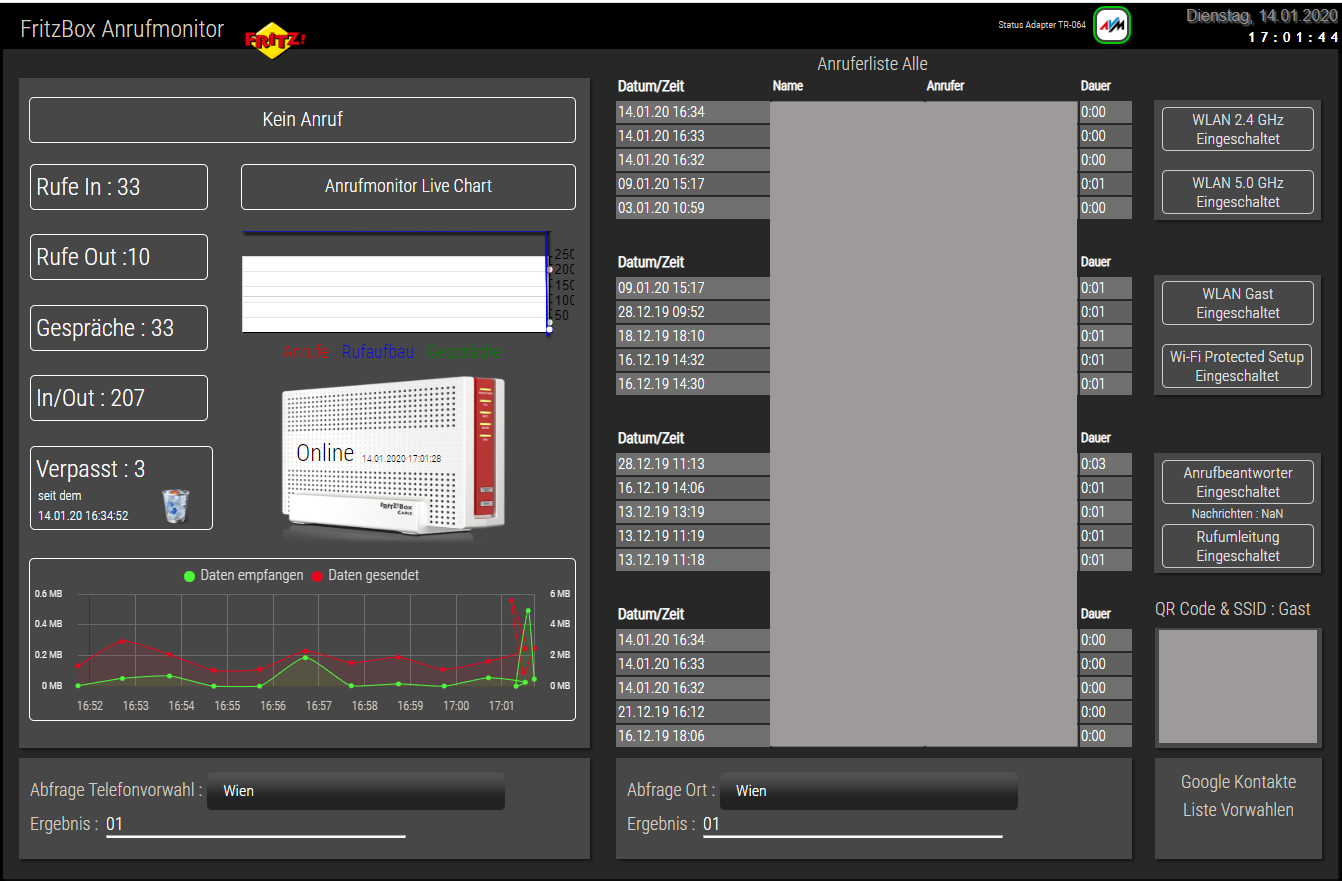
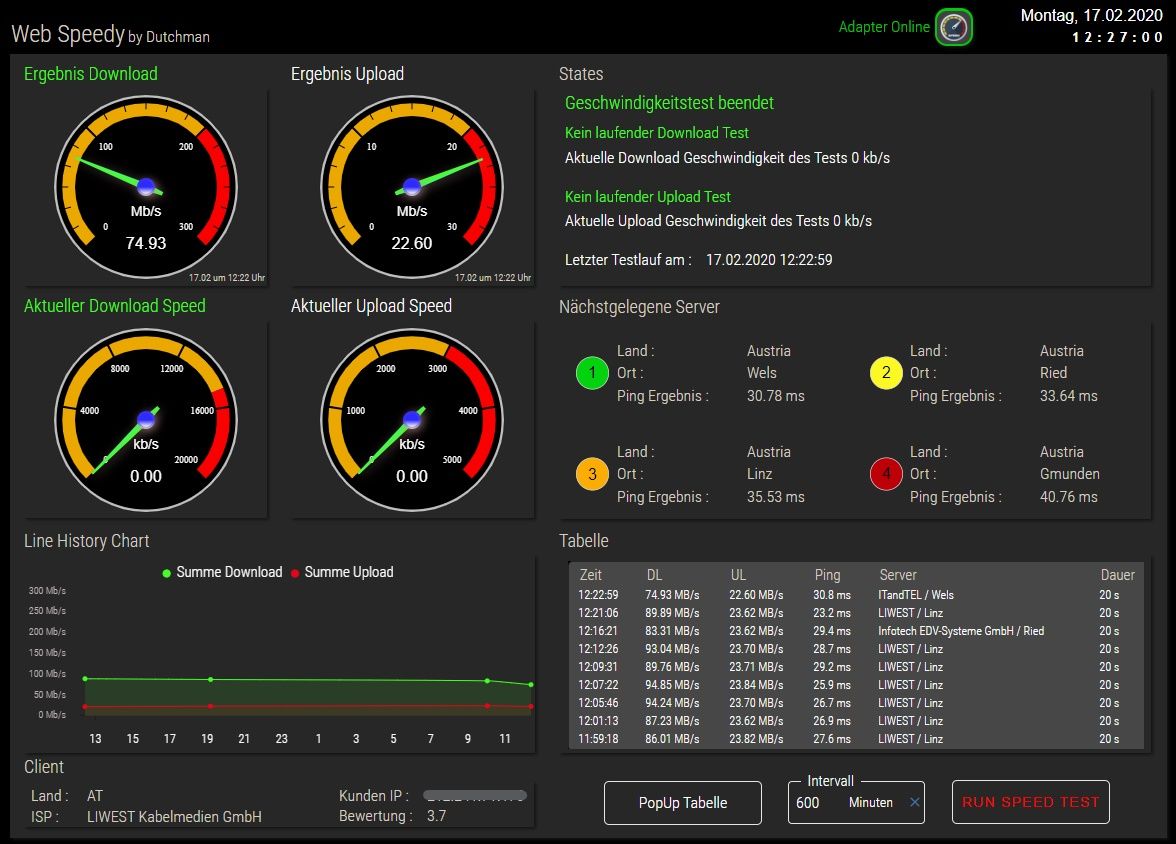
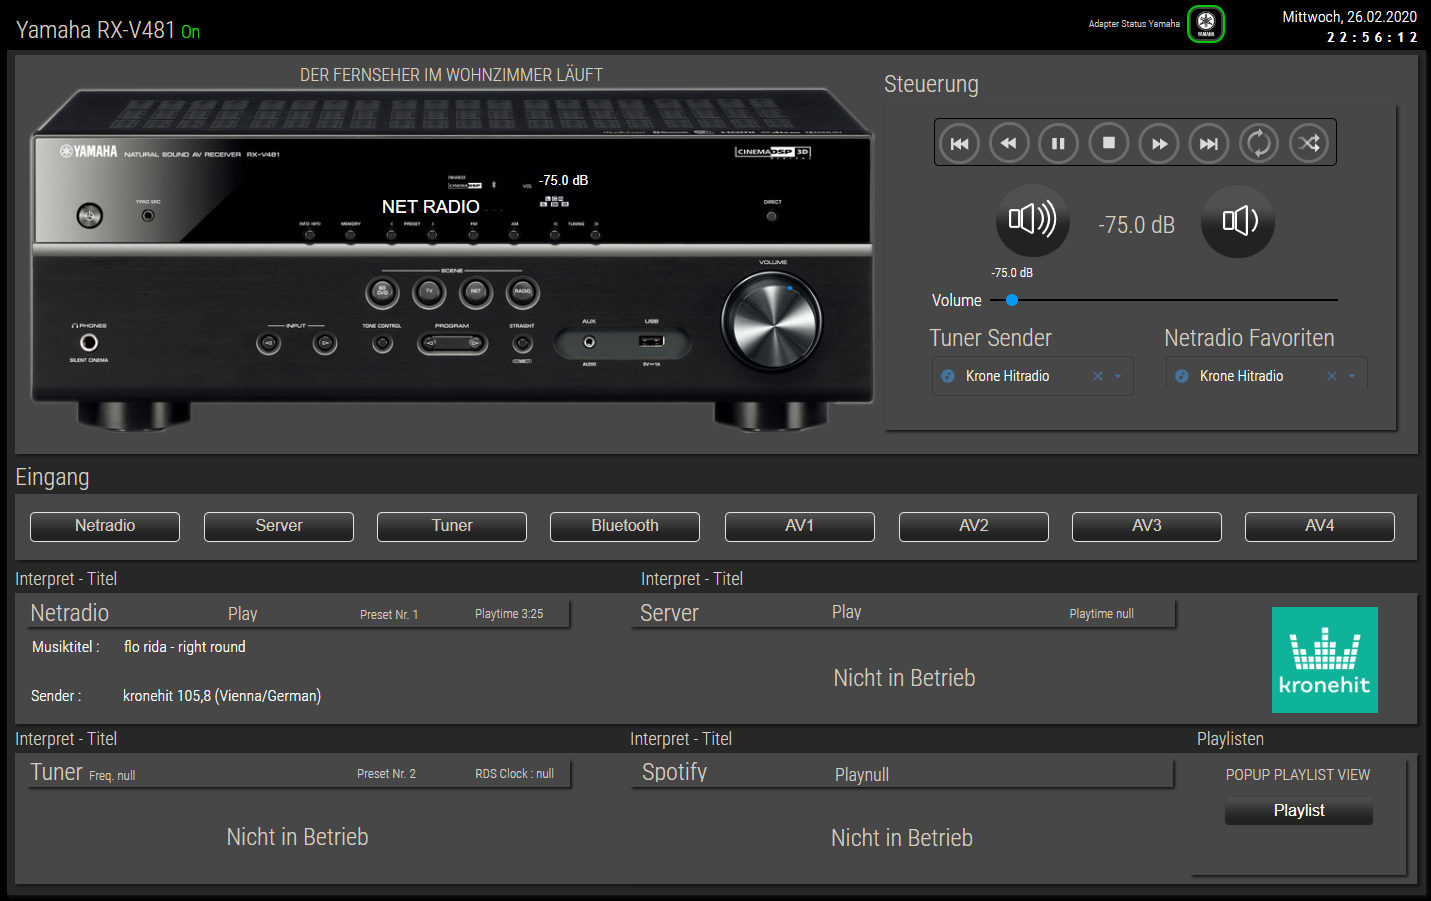
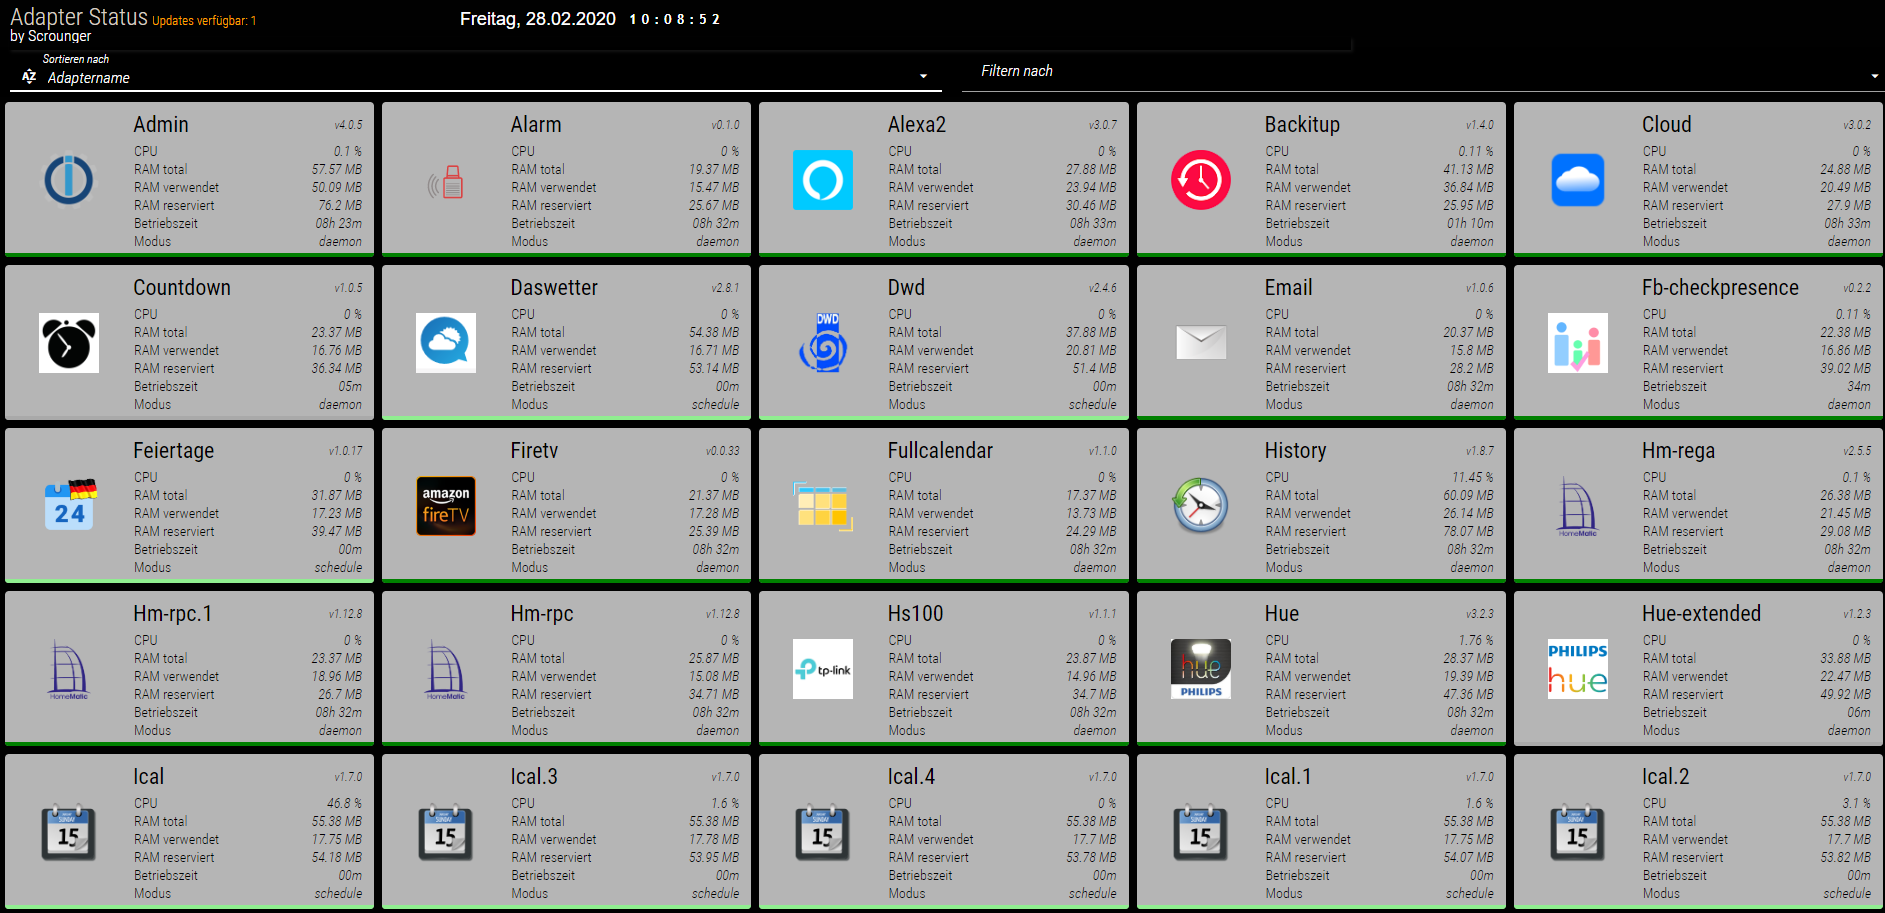
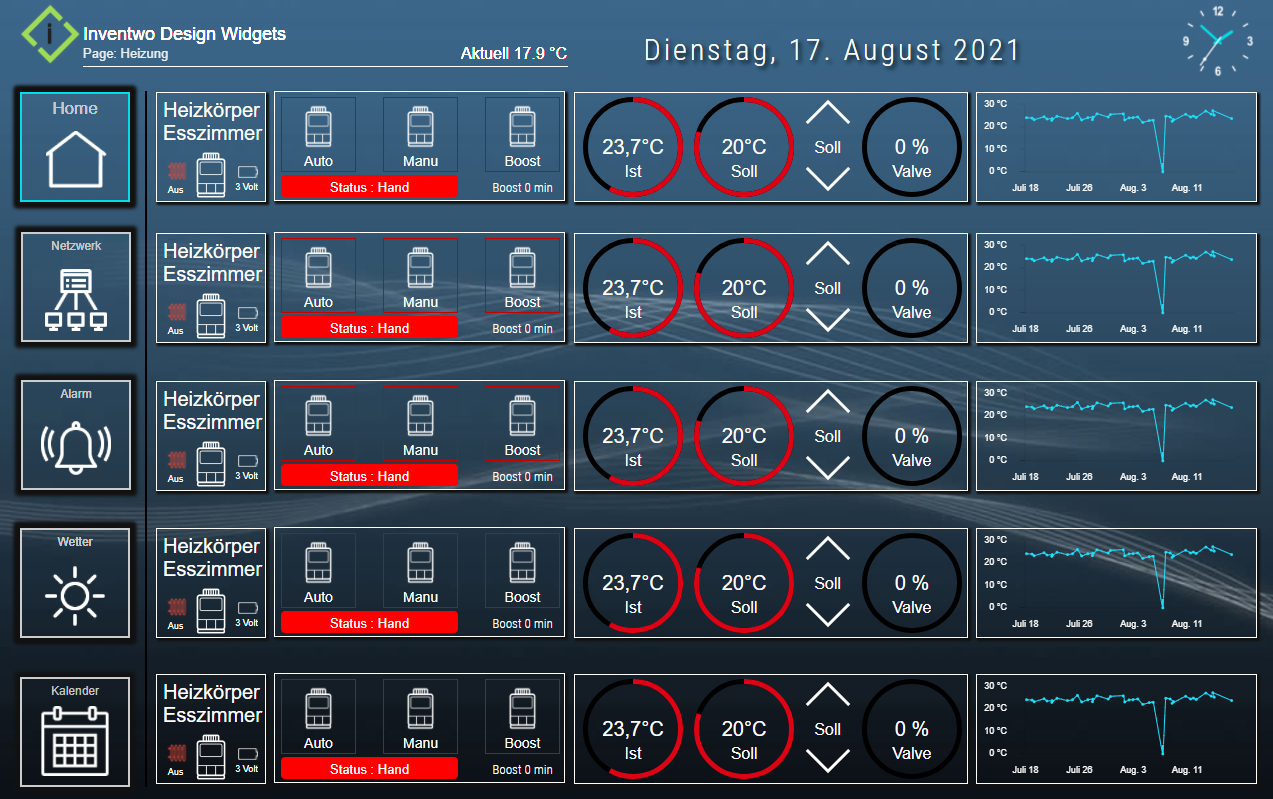
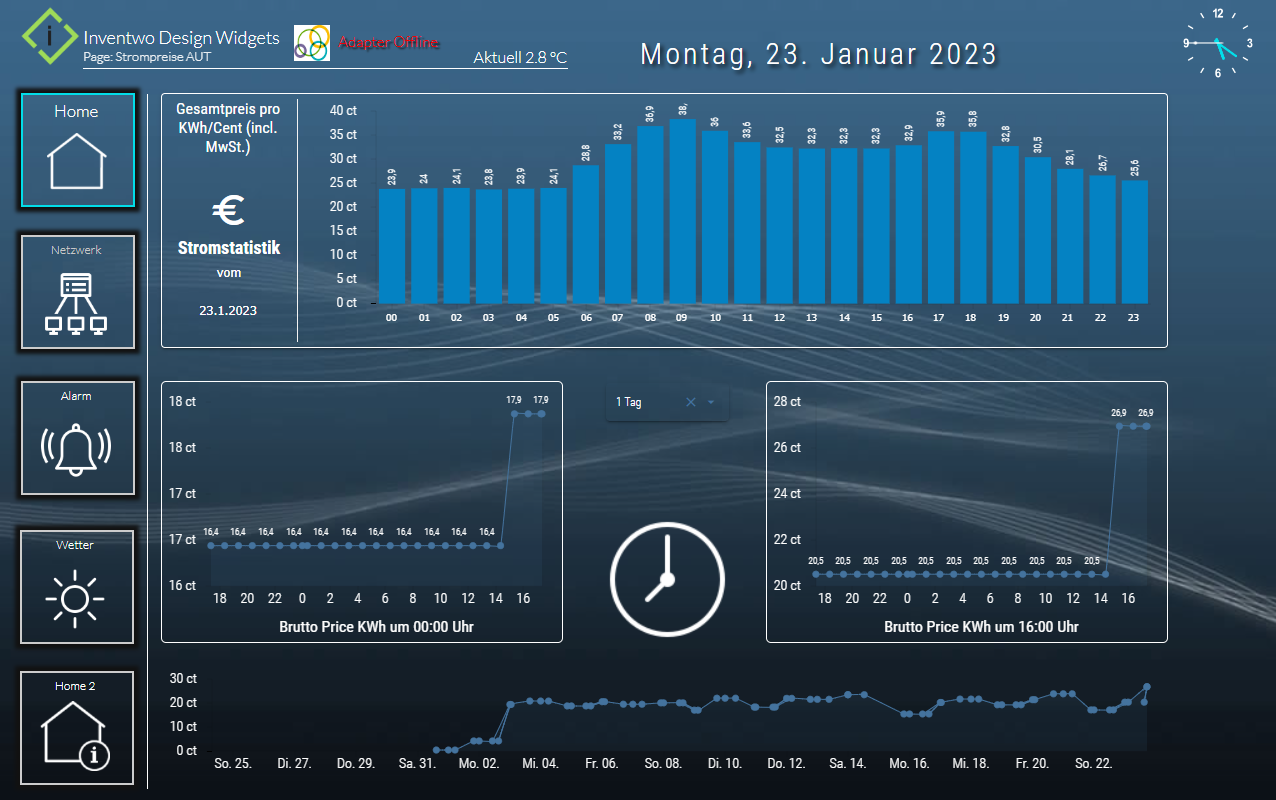
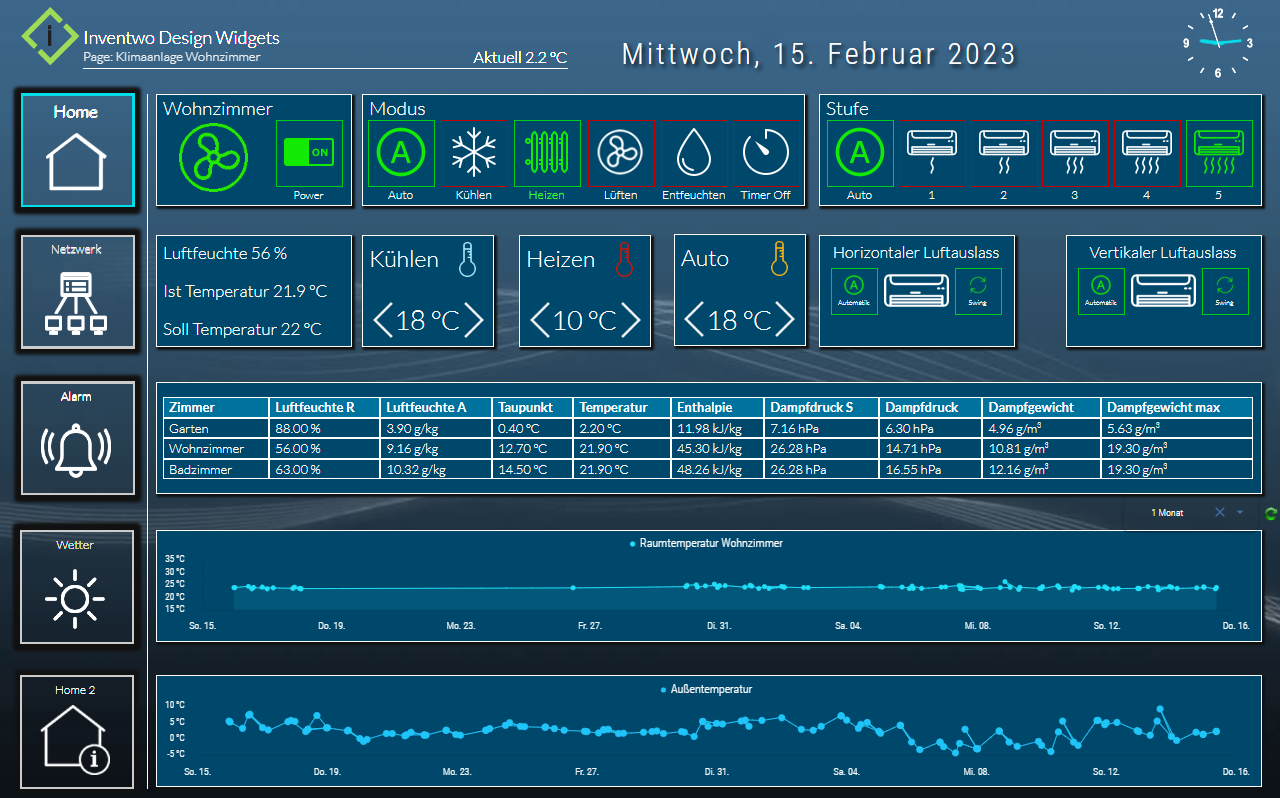
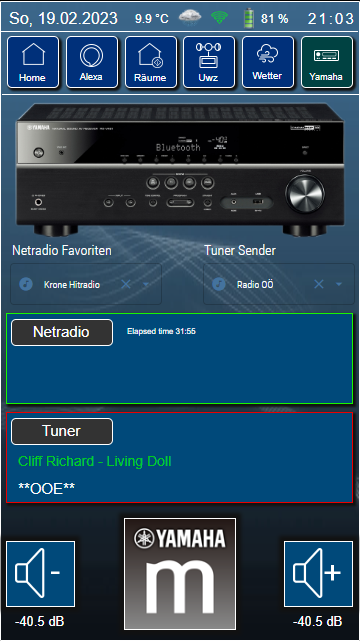
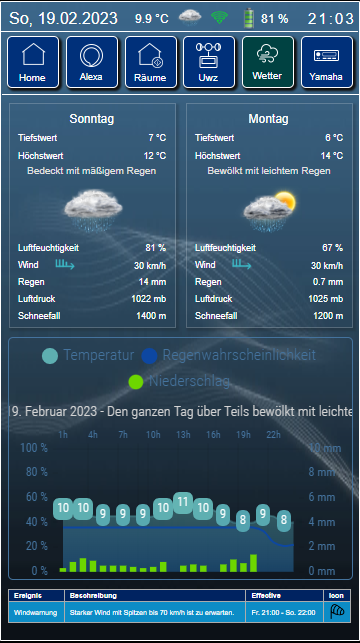
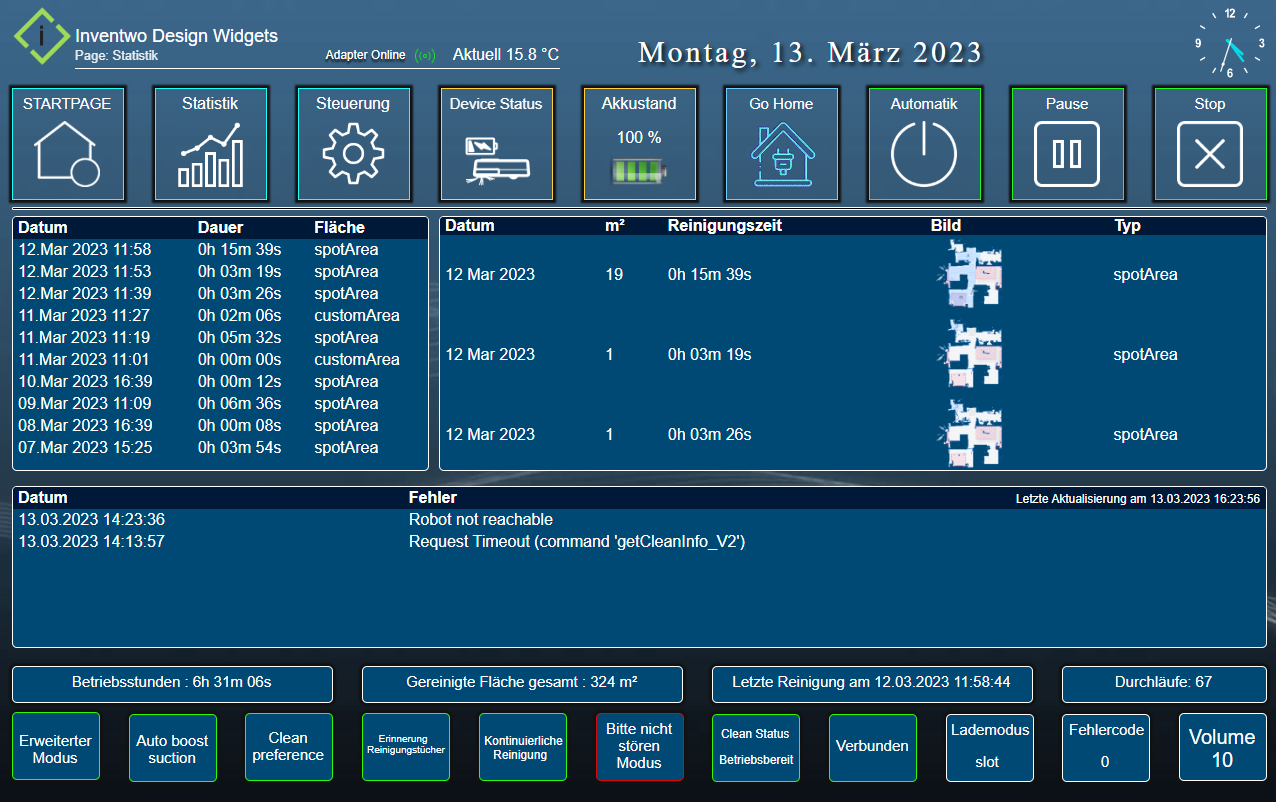
VIS von Sigi234


-
Ohne alles gelesen, geteste oder sonst was zu haben schließe ich mich der Begeisterung uneingeschränkt an:
SEHR geil! -
@sigi234
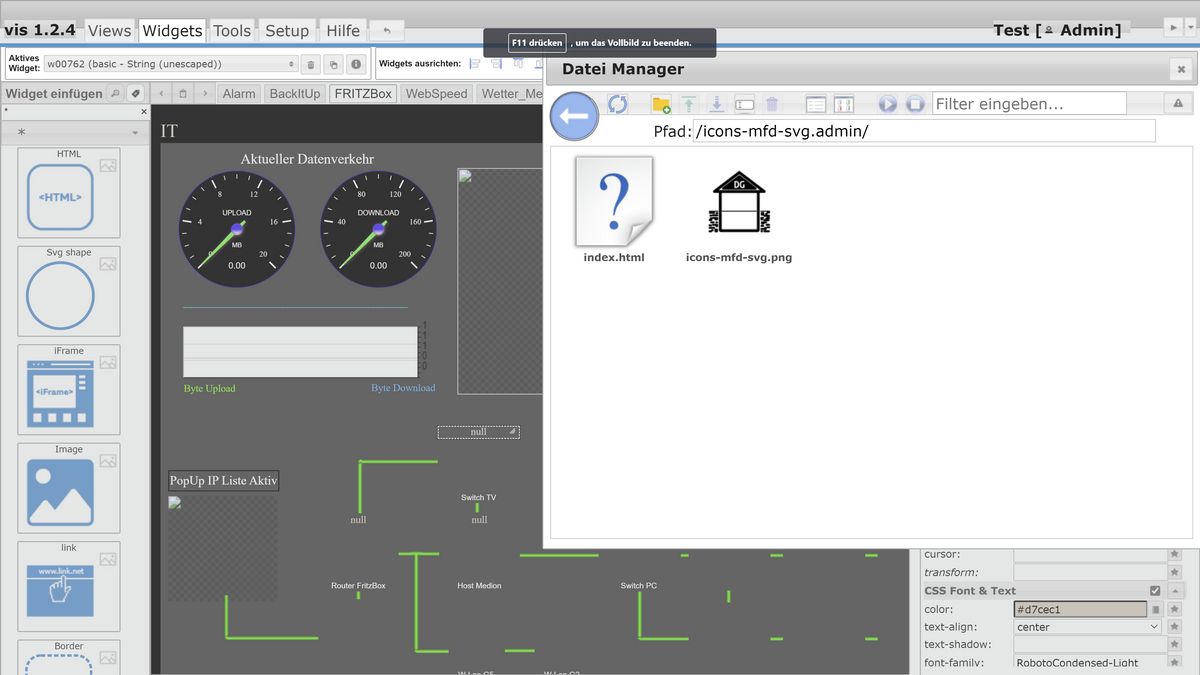
Im Dateimanager kann ich die SVG Icons nicht sehen, im Ordner MFD-PNG diese schon. Wenn ich mit FileZilla auf den Ordner gehe sind diese jedoch da. Allerdings kann ich Sie über den Dateimanager nicht erneut hochladen.@Schwabe
Die sind auch nicht im Admin Ordner.
Hochladen kannst du nur unter vis.0 -
Ohne alles gelesen, geteste oder sonst was zu haben schließe ich mich der Begeisterung uneingeschränkt an:
SEHR geil!@Schorlewalker sagte in VIS von Sigi234:
Ohne alles gelesen, geteste oder sonst was zu haben schließe ich mich der Begeisterung uneingeschränkt an:
SEHR geil!Danke, ist für jeden was dabei. 😁
Es sind ja nur Vorlagen, die man aber an das eigene Design anpassen kann. -
@Stephan-Schleich sagte in VIS von Sigi234:
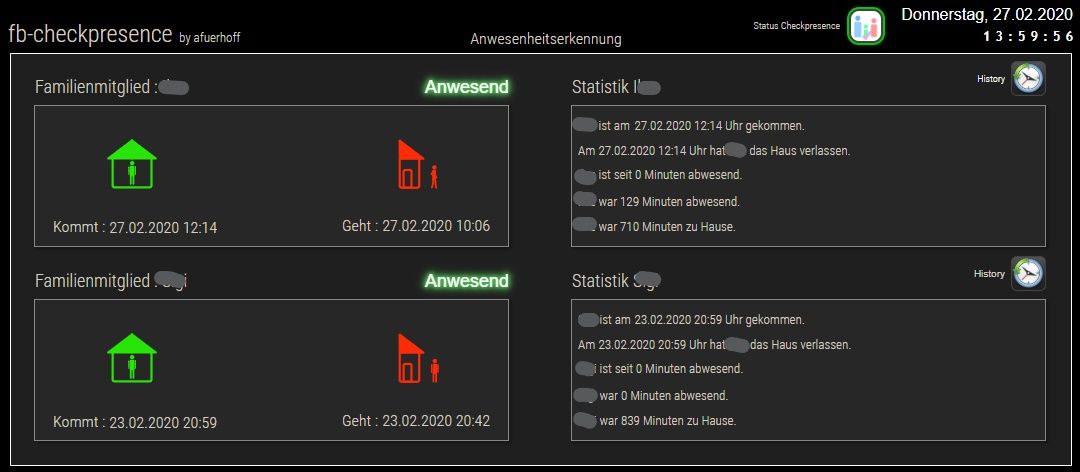
Wär's noch möglich deine fb-checkpresence View zu kriegen?
Werd mir den heute mal ansehen, obs für mich'n mehr Wert hat. -
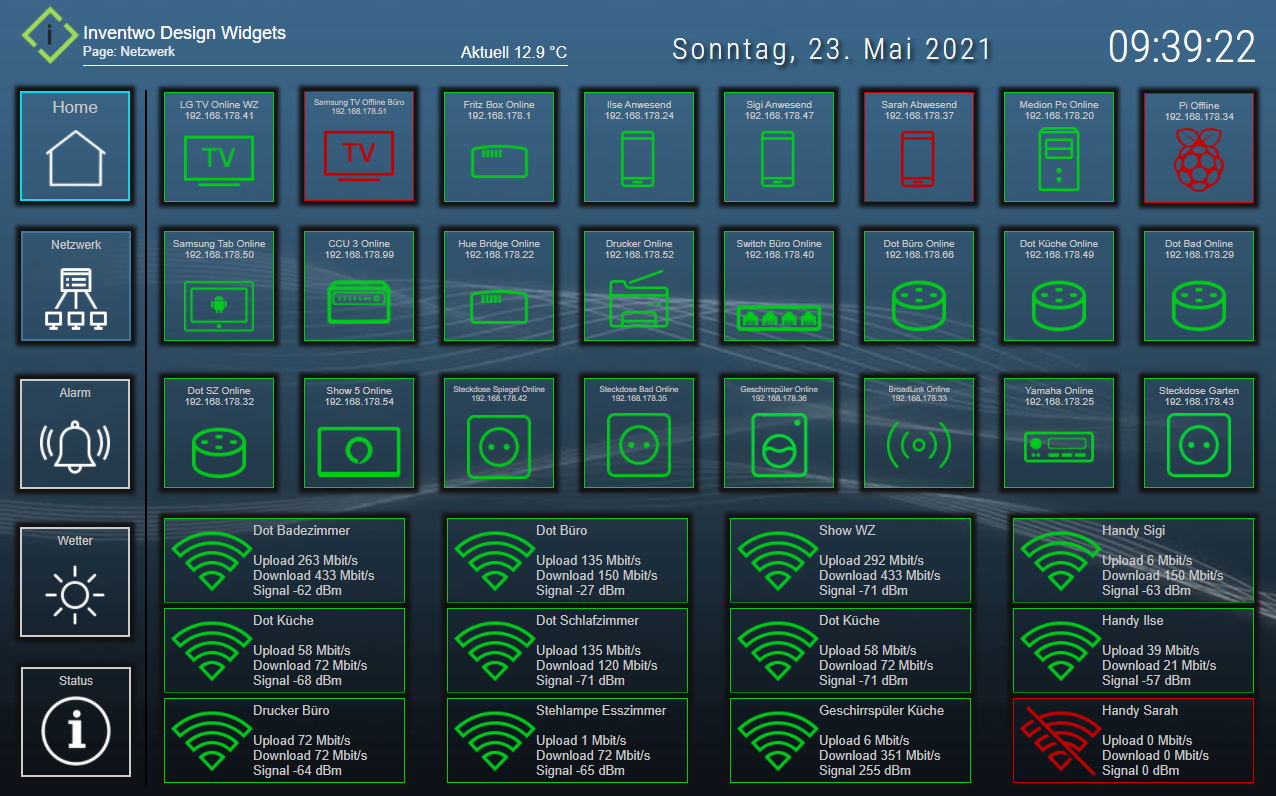
@sigi234 Hallo, wäre es auch möglich die Bilder für die View fb-checkpresence Anwesend/Abwesend zu bekommen?
Danke@Holger-Etzel sagte in VIS von Sigi234:
@sigi234 Hallo, wäre es auch möglich die Bilder für die View fb-checkpresence Anwesend/Abwesend zu bekommen?
DankeDie sind bei einen Icon Set dabei. Kann jetzt nicht nachsehen wie sie heißen. Brauchst aber nur auswählen und oben links auf das Info Icon klicken und dann ev. nachinstallieren.
icons-mfd-svg
Bitte benutzt das Voting rechts unten im Beitrag wenn er euch geholfen hat.
Immer Daten sichern! -
Hallo zusammen,
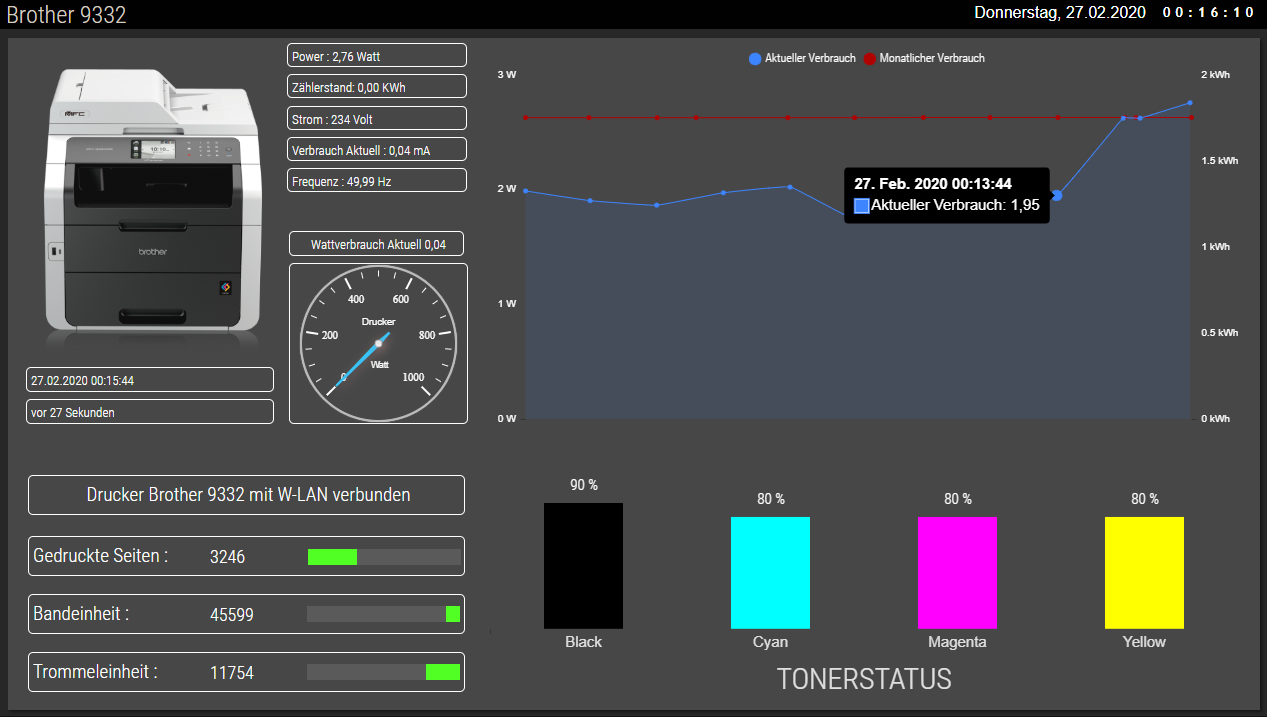
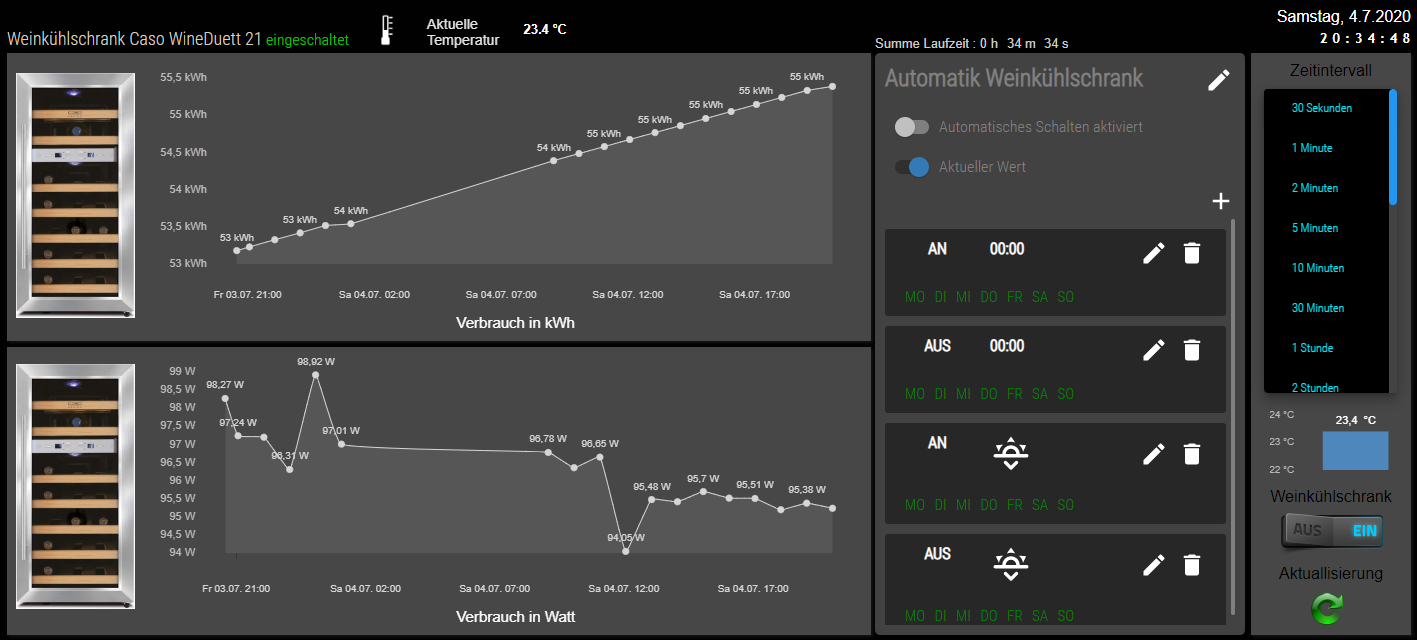
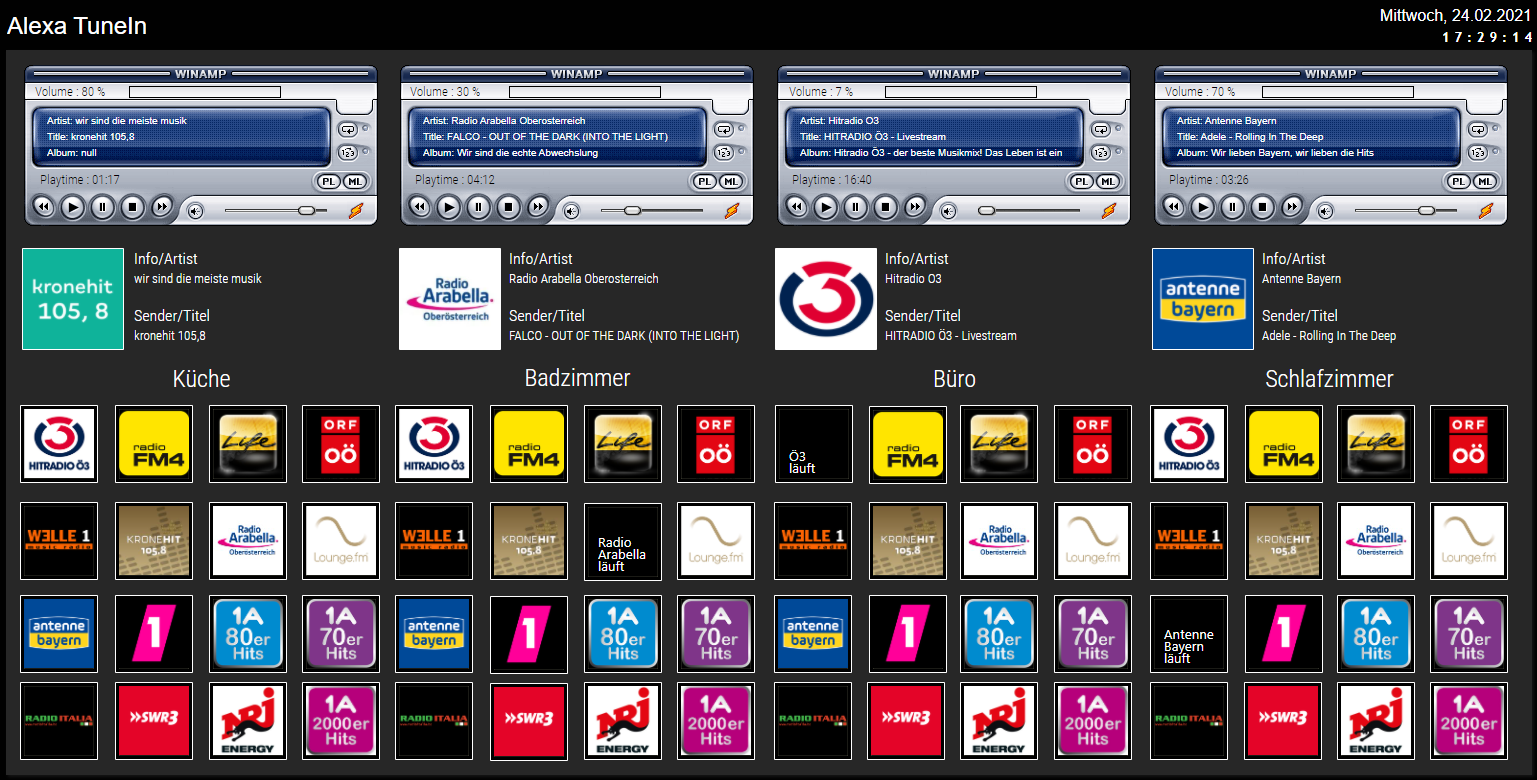
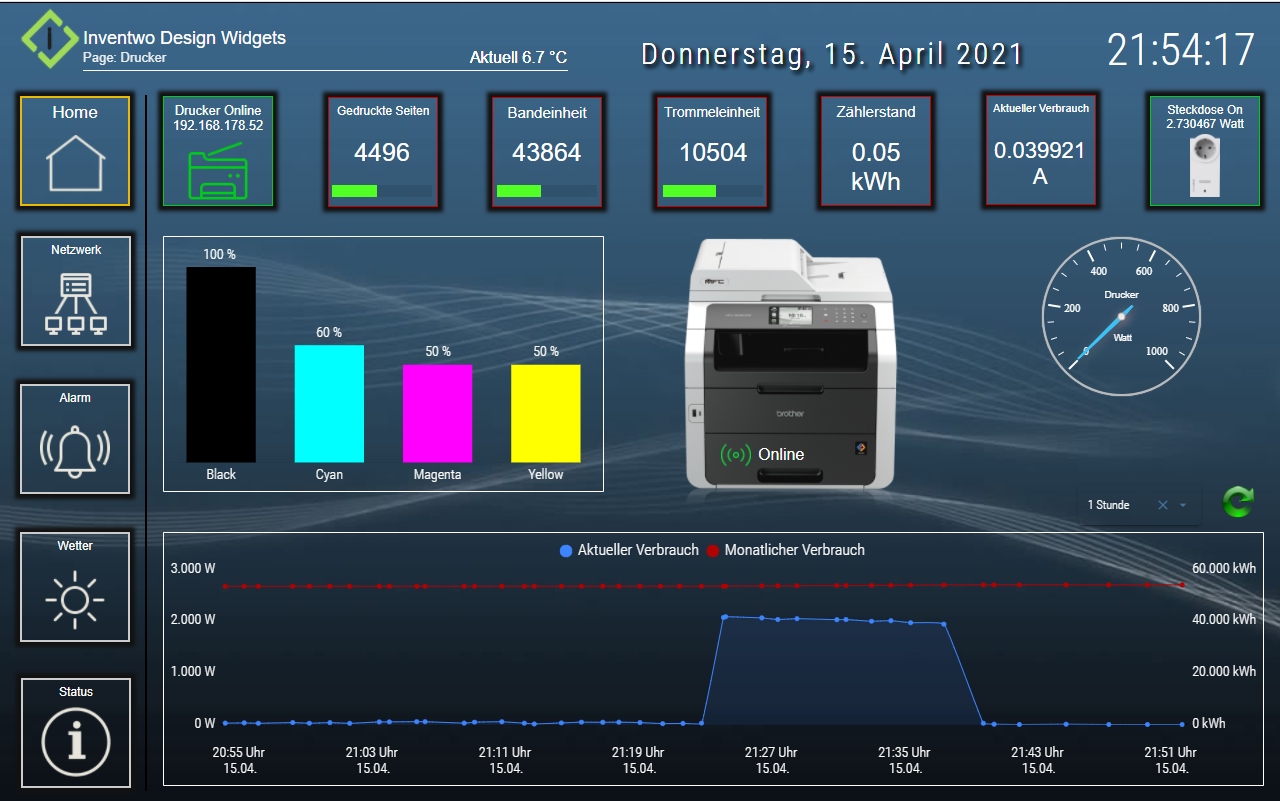
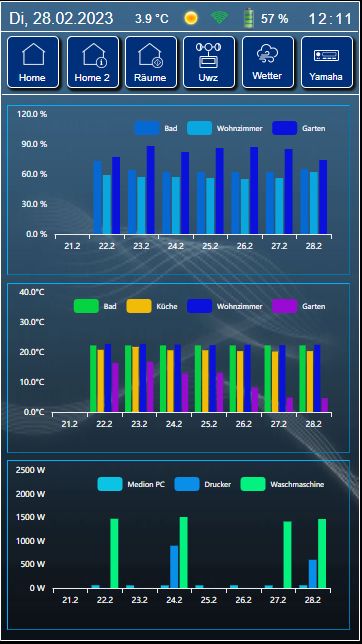
ich suche ne schöne View für meinen Stromverbrauch, vieleiht hat da ja jemand was für mich :-)
-
@Malz1902 sagte in VIS von Sigi234:
ich suche ne schöne View für meinen Stromverbrauch
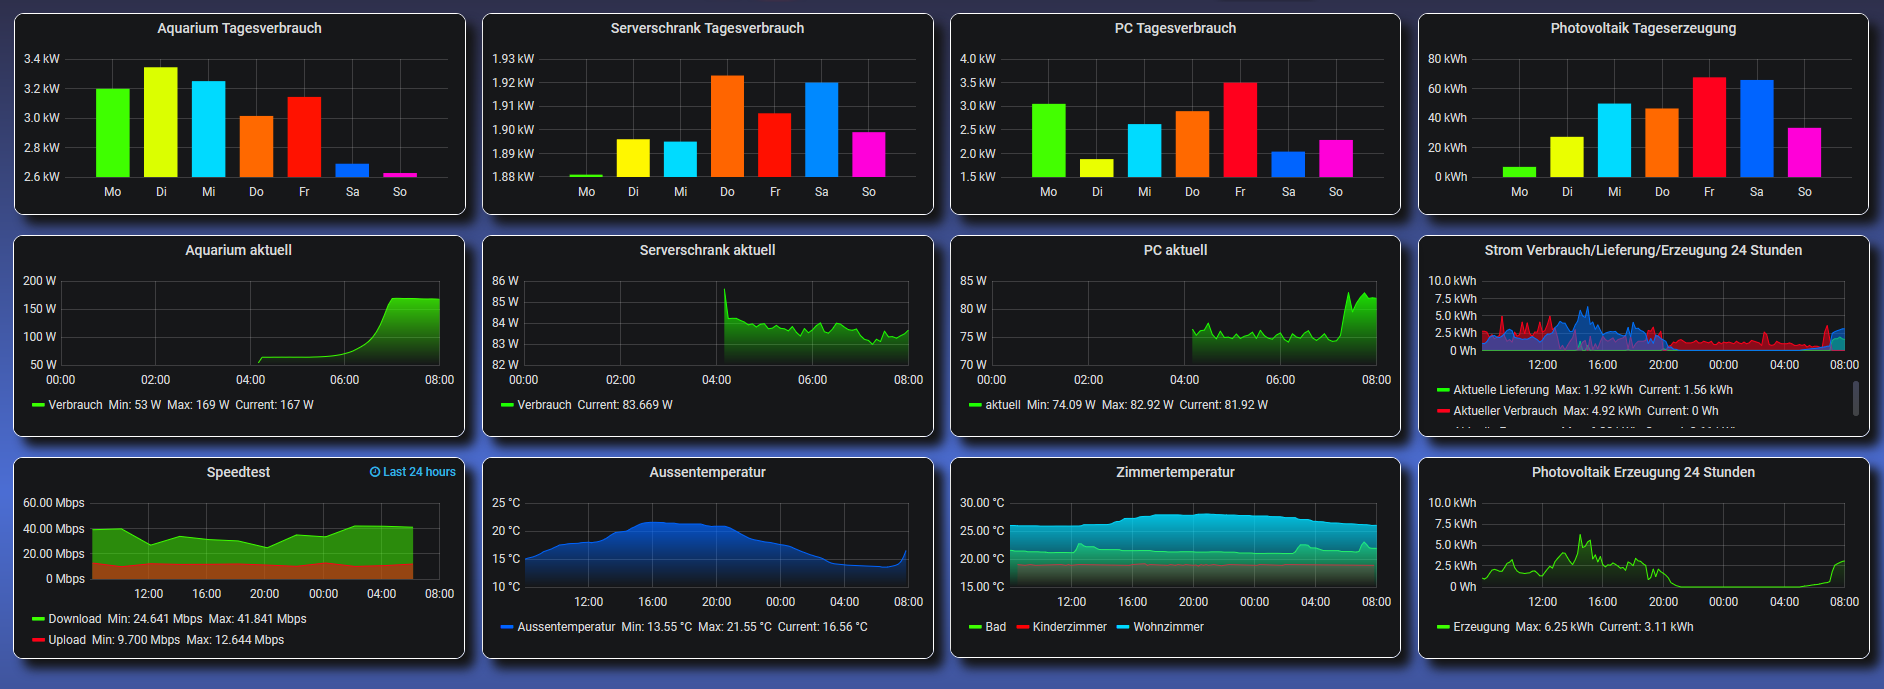
Ich visualisiere das mit Grafana.
Geht aber auch mit Flot.
Und dann die einzelnen Flots als Iframe einbinden.
-
Du bringst mich gerade auf ne Super Idee den Stromverbrauch für den Serverschrank auch noch zu splitten. Nutzt du dafür nen extra Zähler oder wie machst Du das?
@Malz1902 sagte in VIS von Sigi234:
Nutzt du dafür nen extra Zähler oder wie machst Du das?
mit den TP-Link HS110 Steckdosen
-
@Malz1902 sagte in VIS von Sigi234:
ich suche ne schöne View für meinen Stromverbrauch
Ich visualisiere das mit Grafana.
Geht aber auch mit Flot.
Und dann die einzelnen Flots als Iframe einbinden.
@Negalein sagte in VIS von Sigi234:
@Malz1902 sagte in VIS von Sigi234:
ich suche ne schöne View für meinen Stromverbrauch
Ich visualisiere das mit Grafana.
Geht aber auch mit Flot.
Und dann die einzelnen Flots als Iframe einbinden.
Sieht sehr gut aus, ich nutze selber auch grafana. Wie stellst du die auslaufende Füllfarbe ein?
-
@Negalein sagte in VIS von Sigi234:
@Malz1902 sagte in VIS von Sigi234:
ich suche ne schöne View für meinen Stromverbrauch
Ich visualisiere das mit Grafana.
Geht aber auch mit Flot.
Und dann die einzelnen Flots als Iframe einbinden.
Sieht sehr gut aus, ich nutze selber auch grafana. Wie stellst du die auslaufende Füllfarbe ein?
@saeft_2003 sagte in VIS von Sigi234:
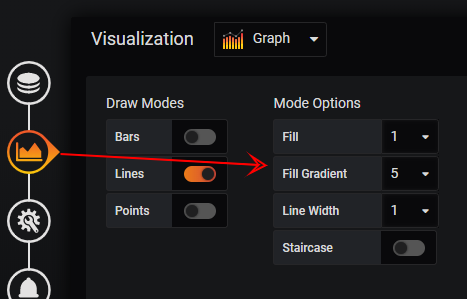
Wie stellst du die auslaufende Füllfarbe ein?
mit einer Kombi aus Fill und Fill Gradient
Sieht sehr gut aus
Danke
-
@saeft_2003 sagte in VIS von Sigi234:
Wie stellst du die auslaufende Füllfarbe ein?
mit einer Kombi aus Fill und Fill Gradient
Sieht sehr gut aus
Danke
Ok danke für die Info, dass muss ich heute Abend mal ausprobieren!
-
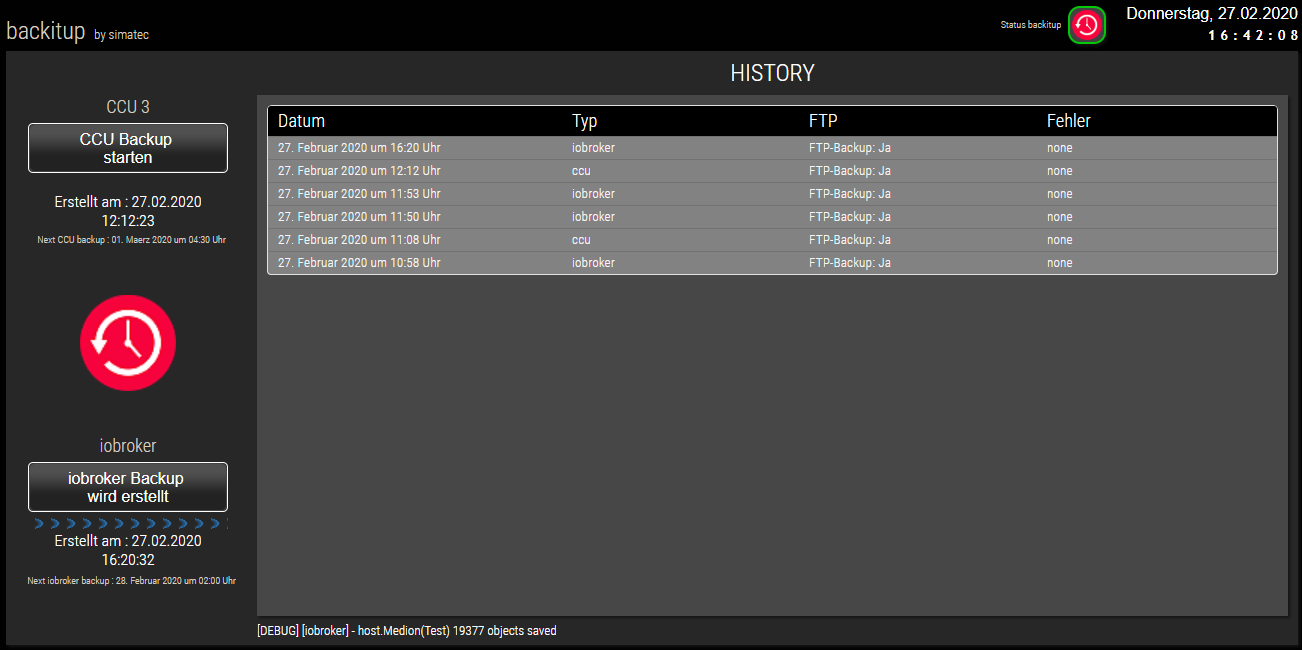
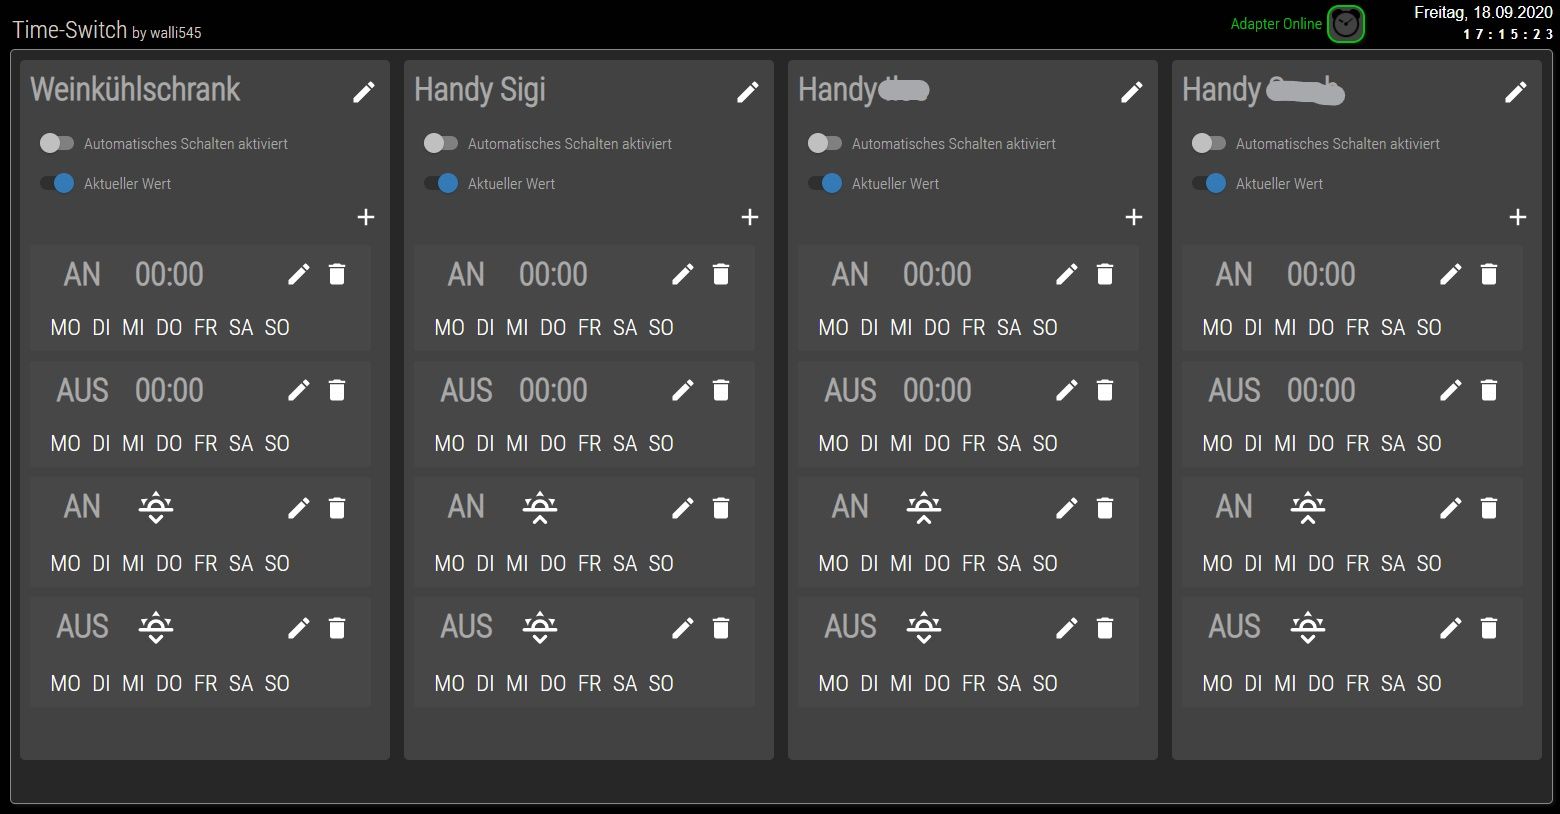
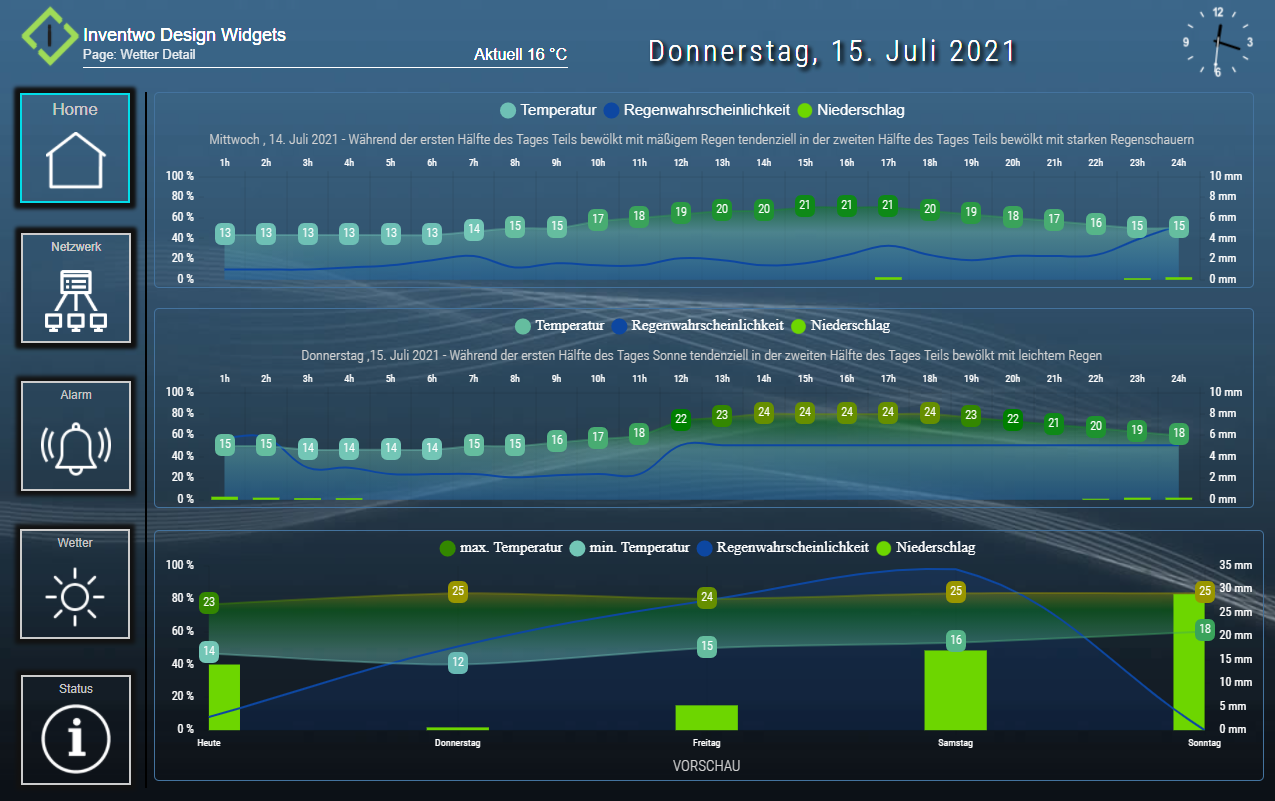
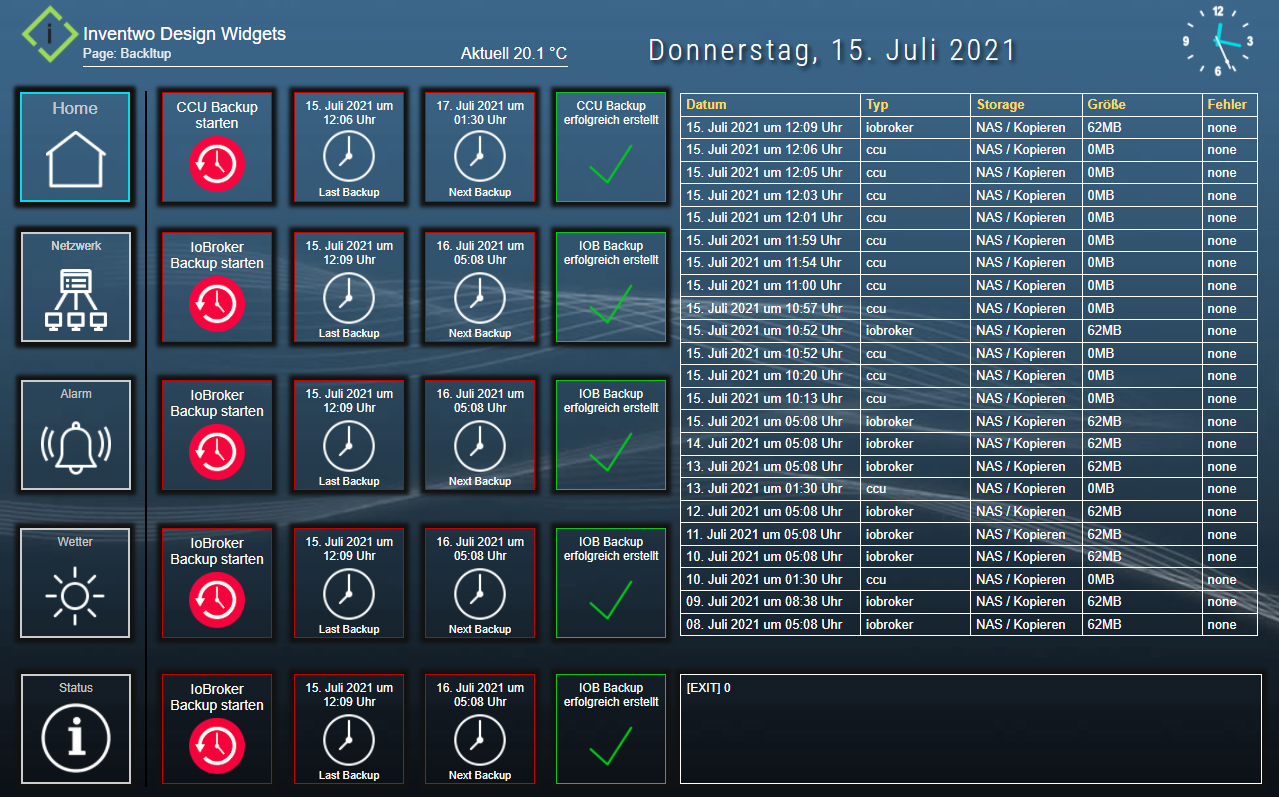
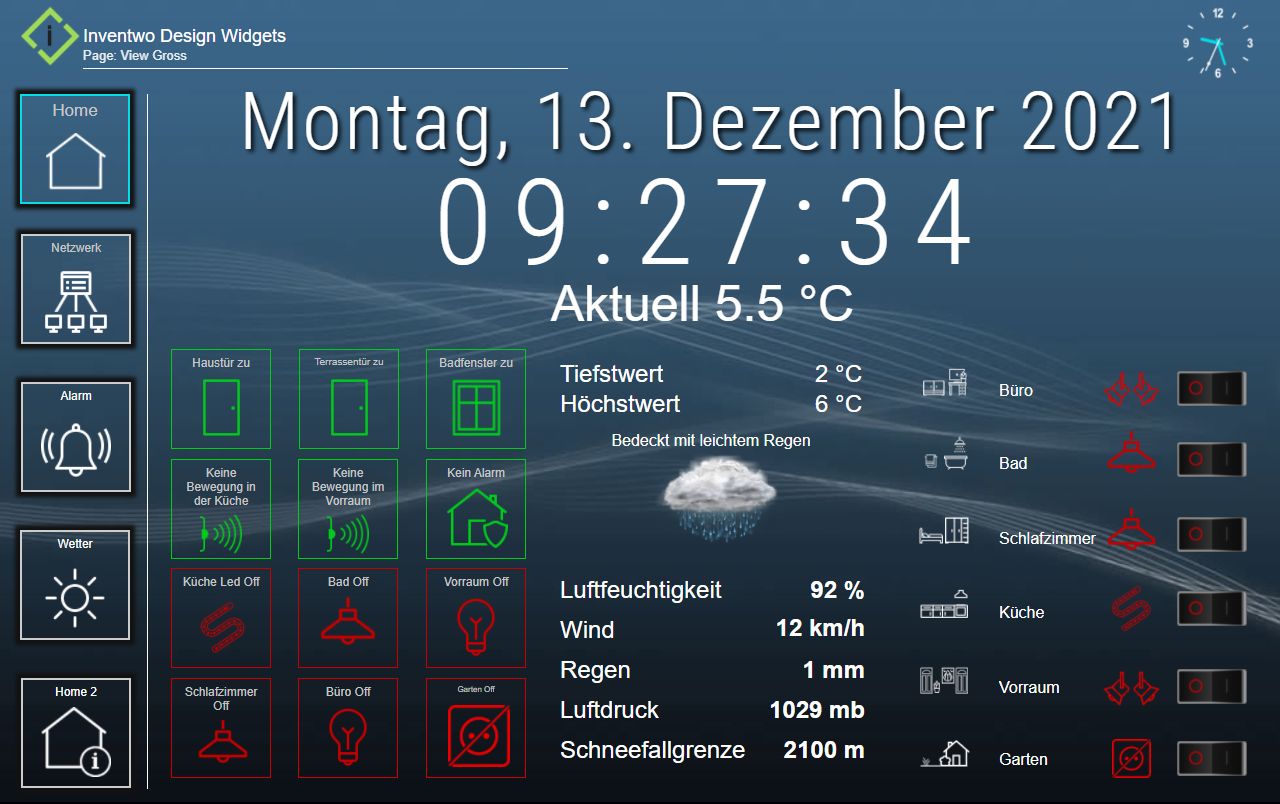
View backitup:
@sigi234 sagte in VIS von Sigi234:
View backitup:
Hallo Sigi, mega VIS die du da hast. Da sie mir so gut gefällt wollte ich die Backup vis übernehmen aber bei mir funktioniert der Animations-Balken nicht. Brauche ich dafür eine spezielle Instanz?
Grüße
-
@sigi234 sagte in VIS von Sigi234:
View backitup:
Hallo Sigi, mega VIS die du da hast. Da sie mir so gut gefällt wollte ich die Backup vis übernehmen aber bei mir funktioniert der Animations-Balken nicht. Brauche ich dafür eine spezielle Instanz?
Grüße
@Bluelinux sagte in VIS von Sigi234:
@sigi234 sagte in VIS von Sigi234:
View backitup:
Hallo Sigi, mega VIS die du da hast. Da sie mir so gut gefällt wollte ich die Backup vis übernehmen aber bei mir funktioniert der Animations-Balken nicht. Brauche ich dafür eine spezielle Instanz?
Grüße
https://forum.iobroker.net/topic/30363/projekt-mdcss-v2-material-design-css-version-2
-
@Holger-Etzel sagte in VIS von Sigi234:
@sigi234 Hallo, wäre es auch möglich die Bilder für die View fb-checkpresence Anwesend/Abwesend zu bekommen?
DankeDie sind bei einen Icon Set dabei. Kann jetzt nicht nachsehen wie sie heißen. Brauchst aber nur auswählen und oben links auf das Info Icon klicken und dann ev. nachinstallieren.
icons-mfd-svg
@sigi234 danke, habs gefunden
-
@Malz1902 sagte in VIS von Sigi234:
ich suche ne schöne View für meinen Stromverbrauch
Ich visualisiere das mit Grafana.
Geht aber auch mit Flot.
Und dann die einzelnen Flots als Iframe einbinden.
-
@Negalein welches Plugin ist das bei Grafana? hab da auch erst mit angefangen.. kannst du mir die am besten exportieren, dann kann ich schauen wie das eingestellt ist.. auch mit den Wochentagen.. ???
@ilovegym sagte in VIS von Sigi234:
welches Plugin ist das bei Grafana? hab da auch erst mit angefangen.. kannst du mir die am besten exportieren, dann kann ich schauen wie das eingestellt ist.. auch mit den Wochentagen.. ???
Das mit den Wochentagen ist mit dem Graph Panel gemacht.
Ich hab dir mal das ganze Dashboard exportiert. Hoffe es hat geklappt.
{ "annotations": { "list": [ { "builtIn": 1, "datasource": "-- Grafana --", "enable": true, "hide": true, "iconColor": "rgba(0, 211, 255, 1)", "name": "Annotations & Alerts", "type": "dashboard" } ] }, "editable": true, "gnetId": null, "graphTooltip": 0, "id": 2, "links": [], "panels": [ { "aliasColors": { "Di": "rgb(255, 247, 0)", "Dienstag": "rgb(255, 221, 0)", "Do": "rgb(255, 101, 0)", "Donnerstag": "rgb(255, 126, 0)", "Fr": "rgb(255, 16, 0)", "Freitag": "rgb(255, 0, 31)", "Mi": "rgb(0, 219, 255)", "Mittwoch": "rgb(0, 100, 255)", "Mo": "rgb(63, 255, 0)", "Montag": "rgb(61, 255, 0)", "Sa": "rgb(0, 137, 255)", "Samstag": "rgb(0, 95, 255)", "So": "rgb(255, 0, 218)", "Sonntag": "rgb(255, 0, 215)" }, "bars": true, "dashLength": 10, "dashes": false, "datasource": null, "fill": 1, "fillGradient": 0, "gridPos": { "h": 7, "w": 7, "x": 0, "y": 0 }, "hiddenSeries": false, "hideTimeOverride": true, "id": 24, "interval": "", "legend": { "avg": false, "current": false, "max": false, "min": false, "show": false, "total": false, "values": false }, "lines": false, "linewidth": 1, "nullPointMode": "connected", "options": { "dataLinks": [] }, "percentage": false, "pluginVersion": "6.6.2", "pointradius": 2, "points": false, "renderer": "flot", "seriesOverrides": [], "spaceLength": 10, "stack": false, "steppedLine": false, "targets": [ { "alias": "Mo", "groupBy": [ { "params": [ "$__interval" ], "type": "time" }, { "params": [ "null" ], "type": "fill" } ], "measurement": "sourceanalytix.0.hs100__0__10_0_1_80__power.consumption.current_year.this_week.01_Monday", "orderByTime": "ASC", "policy": "default", "refId": "A", "resultFormat": "time_series", "select": [ [ { "params": [ "value" ], "type": "field" }, { "params": [], "type": "mean" } ] ], "tags": [] }, { "alias": "Di", "groupBy": [ { "params": [ "$__interval" ], "type": "time" }, { "params": [ "null" ], "type": "fill" } ], "measurement": "sourceanalytix.0.hs100__0__10_0_1_80__power.consumption.current_year.this_week.02_Tuesday", "orderByTime": "ASC", "policy": "default", "refId": "B", "resultFormat": "time_series", "select": [ [ { "params": [ "value" ], "type": "field" }, { "params": [], "type": "mean" } ] ], "tags": [] }, { "alias": "Mi", "groupBy": [ { "params": [ "$__interval" ], "type": "time" }, { "params": [ "null" ], "type": "fill" } ], "measurement": "sourceanalytix.0.hs100__0__10_0_1_80__power.consumption.current_year.this_week.03_Wednesday", "orderByTime": "ASC", "policy": "default", "refId": "C", "resultFormat": "time_series", "select": [ [ { "params": [ "value" ], "type": "field" }, { "params": [], "type": "mean" } ] ], "tags": [] }, { "alias": "Do", "groupBy": [ { "params": [ "$__interval" ], "type": "time" }, { "params": [ "null" ], "type": "fill" } ], "measurement": "sourceanalytix.0.hs100__0__10_0_1_80__power.consumption.current_year.this_week.04_Thursday", "orderByTime": "ASC", "policy": "default", "refId": "D", "resultFormat": "time_series", "select": [ [ { "params": [ "value" ], "type": "field" }, { "params": [], "type": "mean" } ] ], "tags": [] }, { "alias": "Fr", "groupBy": [ { "params": [ "$__interval" ], "type": "time" }, { "params": [ "null" ], "type": "fill" } ], "measurement": "sourceanalytix.0.hs100__0__10_0_1_80__power.consumption.current_year.this_week.05_Friday", "orderByTime": "ASC", "policy": "default", "refId": "E", "resultFormat": "time_series", "select": [ [ { "params": [ "value" ], "type": "field" }, { "params": [], "type": "mean" } ] ], "tags": [] }, { "alias": "Sa", "groupBy": [ { "params": [ "$__interval" ], "type": "time" }, { "params": [ "null" ], "type": "fill" } ], "measurement": "sourceanalytix.0.hs100__0__10_0_1_80__power.consumption.current_year.this_week.06_Saturday", "orderByTime": "ASC", "policy": "default", "refId": "F", "resultFormat": "time_series", "select": [ [ { "params": [ "value" ], "type": "field" }, { "params": [], "type": "mean" } ] ], "tags": [] }, { "alias": "So", "groupBy": [ { "params": [ "$__interval" ], "type": "time" }, { "params": [ "null" ], "type": "fill" } ], "measurement": "sourceanalytix.0.hs100__0__10_0_1_80__power.consumption.current_year.this_week.07_Sunday", "orderByTime": "ASC", "policy": "default", "refId": "G", "resultFormat": "time_series", "select": [ [ { "params": [ "value" ], "type": "field" }, { "params": [], "type": "mean" } ] ], "tags": [] } ], "thresholds": [], "timeFrom": "7d", "timeRegions": [], "timeShift": null, "title": "Serverschrank Tagesverbrauch", "tooltip": { "shared": false, "sort": 0, "value_type": "individual" }, "transparent": true, "type": "graph", "xaxis": { "buckets": null, "mode": "series", "name": null, "show": true, "values": [ "max" ] }, "yaxes": [ { "format": "kwatt", "label": null, "logBase": 1, "max": null, "min": null, "show": true }, { "format": "short", "label": null, "logBase": 1, "max": null, "min": null, "show": false } ], "yaxis": { "align": false, "alignLevel": null } }, { "aliasColors": { "Di": "rgb(219, 255, 0)", "Do": "rgb(255, 105, 0)", "Fr": "rgb(255, 18, 0)", "Mi": "rgb(0, 218, 255)", "Mo": "rgb(63, 255, 0)", "Sa": "rgb(0, 101, 255)", "So": "rgb(255, 0, 211)", "Tagesverbrauch": "dark-blue" }, "bars": true, "dashLength": 10, "dashes": false, "datasource": null, "fill": 1, "fillGradient": 0, "gridPos": { "h": 7, "w": 7, "x": 7, "y": 0 }, "hiddenSeries": false, "hideTimeOverride": true, "id": 20, "legend": { "alignAsTable": false, "avg": false, "current": false, "hideEmpty": false, "hideZero": false, "max": false, "min": false, "show": false, "total": false, "values": false }, "lines": false, "linewidth": 1, "nullPointMode": "connected", "options": { "dataLinks": [] }, "percentage": false, "pluginVersion": "6.6.2", "pointradius": 6, "points": false, "renderer": "flot", "seriesOverrides": [], "spaceLength": 10, "stack": false, "steppedLine": false, "targets": [ { "alias": "Mo", "groupBy": [ { "params": [ "$__interval" ], "type": "time" }, { "params": [ "null" ], "type": "fill" } ], "measurement": "sourceanalytix.0.hs100__0__10_0_1_77__power.consumption.current_year.this_week.01_Monday", "orderByTime": "ASC", "policy": "default", "refId": "A", "resultFormat": "time_series", "select": [ [ { "params": [ "value" ], "type": "field" }, { "params": [], "type": "mean" } ] ], "tags": [] }, { "alias": "Di", "groupBy": [ { "params": [ "$__interval" ], "type": "time" }, { "params": [ "null" ], "type": "fill" } ], "measurement": "sourceanalytix.0.hs100__0__10_0_1_77__power.consumption.current_year.this_week.02_Tuesday", "orderByTime": "ASC", "policy": "default", "refId": "B", "resultFormat": "time_series", "select": [ [ { "params": [ "value" ], "type": "field" }, { "params": [], "type": "mean" } ] ], "tags": [] }, { "alias": "Mi", "groupBy": [ { "params": [ "$__interval" ], "type": "time" }, { "params": [ "null" ], "type": "fill" } ], "measurement": "sourceanalytix.0.hs100__0__10_0_1_77__power.consumption.current_year.this_week.03_Wednesday", "orderByTime": "ASC", "policy": "default", "refId": "C", "resultFormat": "time_series", "select": [ [ { "params": [ "value" ], "type": "field" }, { "params": [], "type": "mean" } ] ], "tags": [] }, { "alias": "Do", "groupBy": [ { "params": [ "$__interval" ], "type": "time" }, { "params": [ "null" ], "type": "fill" } ], "measurement": "sourceanalytix.0.hs100__0__10_0_1_77__power.consumption.current_year.this_week.04_Thursday", "orderByTime": "ASC", "policy": "default", "refId": "D", "resultFormat": "time_series", "select": [ [ { "params": [ "value" ], "type": "field" }, { "params": [], "type": "mean" } ] ], "tags": [] }, { "alias": "Fr", "groupBy": [ { "params": [ "$__interval" ], "type": "time" }, { "params": [ "null" ], "type": "fill" } ], "measurement": "sourceanalytix.0.hs100__0__10_0_1_77__power.consumption.current_year.this_week.05_Friday", "orderByTime": "ASC", "policy": "default", "refId": "E", "resultFormat": "time_series", "select": [ [ { "params": [ "value" ], "type": "field" }, { "params": [], "type": "mean" } ] ], "tags": [] }, { "alias": "Sa", "groupBy": [ { "params": [ "$__interval" ], "type": "time" }, { "params": [ "null" ], "type": "fill" } ], "measurement": "sourceanalytix.0.hs100__0__10_0_1_77__power.consumption.current_year.this_week.06_Saturday", "orderByTime": "ASC", "policy": "default", "refId": "F", "resultFormat": "time_series", "select": [ [ { "params": [ "value" ], "type": "field" }, { "params": [], "type": "mean" } ] ], "tags": [] }, { "alias": "So", "groupBy": [ { "params": [ "$__interval" ], "type": "time" }, { "params": [ "null" ], "type": "fill" } ], "measurement": "sourceanalytix.0.hs100__0__10_0_1_77__power.consumption.current_year.this_week.07_Sunday", "orderByTime": "ASC", "policy": "default", "refId": "G", "resultFormat": "time_series", "select": [ [ { "params": [ "value" ], "type": "field" }, { "params": [], "type": "mean" } ] ], "tags": [] } ], "thresholds": [], "timeFrom": "7d", "timeRegions": [], "timeShift": null, "title": "Aquarium Tagesverbrauch", "tooltip": { "shared": false, "sort": 0, "value_type": "individual" }, "transparent": true, "type": "graph", "xaxis": { "buckets": null, "mode": "series", "name": null, "show": true, "values": [ "max" ] }, "yaxes": [ { "format": "kwatt", "label": "", "logBase": 1, "max": null, "min": null, "show": true }, { "format": "short", "label": null, "logBase": 1, "max": null, "min": null, "show": false } ], "yaxis": { "align": true, "alignLevel": 0 } }, { "aliasColors": { "Di": "rgb(234, 255, 0)", "Do": "rgb(255, 105, 0)", "Fr": "rgb(255, 0, 29)", "Mi": "rgb(0, 219, 255)", "Mo": "rgb(67, 255, 0)", "Sa": "rgb(0, 100, 255)", "So": "rgb(255, 0, 216)" }, "bars": true, "dashLength": 10, "dashes": false, "datasource": null, "fill": 1, "fillGradient": 0, "gridPos": { "h": 7, "w": 7, "x": 14, "y": 0 }, "hiddenSeries": false, "hideTimeOverride": true, "id": 16, "legend": { "alignAsTable": false, "avg": false, "current": false, "hideEmpty": false, "hideZero": false, "max": false, "min": false, "show": false, "total": false, "values": false }, "lines": false, "linewidth": 1, "nullPointMode": "connected", "options": { "dataLinks": [] }, "percentage": false, "pointradius": 2, "points": false, "renderer": "flot", "seriesOverrides": [], "spaceLength": 10, "stack": false, "steppedLine": false, "targets": [ { "alias": "Mo", "groupBy": [ { "params": [ "$__interval" ], "type": "time" }, { "params": [ "null" ], "type": "fill" } ], "measurement": "sourceanalytix.0.hs100__0__10_0_1_79__power.consumption.current_year.this_week.01_Monday", "orderByTime": "ASC", "policy": "default", "refId": "A", "resultFormat": "time_series", "select": [ [ { "params": [ "value" ], "type": "field" }, { "params": [], "type": "mean" } ] ], "tags": [] }, { "alias": "Di", "groupBy": [ { "params": [ "$__interval" ], "type": "time" }, { "params": [ "null" ], "type": "fill" } ], "measurement": "sourceanalytix.0.hs100__0__10_0_1_79__power.consumption.current_year.this_week.02_Tuesday", "orderByTime": "ASC", "policy": "default", "refId": "B", "resultFormat": "time_series", "select": [ [ { "params": [ "value" ], "type": "field" }, { "params": [], "type": "mean" } ] ], "tags": [] }, { "alias": "Mi", "groupBy": [ { "params": [ "$__interval" ], "type": "time" }, { "params": [ "null" ], "type": "fill" } ], "measurement": "sourceanalytix.0.hs100__0__10_0_1_79__power.consumption.current_year.this_week.03_Wednesday", "orderByTime": "ASC", "policy": "default", "refId": "C", "resultFormat": "time_series", "select": [ [ { "params": [ "value" ], "type": "field" }, { "params": [], "type": "mean" } ] ], "tags": [] }, { "alias": "Do", "groupBy": [ { "params": [ "$__interval" ], "type": "time" }, { "params": [ "null" ], "type": "fill" } ], "measurement": "sourceanalytix.0.hs100__0__10_0_1_79__power.consumption.current_year.this_week.04_Thursday", "orderByTime": "ASC", "policy": "default", "refId": "D", "resultFormat": "time_series", "select": [ [ { "params": [ "value" ], "type": "field" }, { "params": [], "type": "mean" } ] ], "tags": [] }, { "alias": "Fr", "groupBy": [ { "params": [ "$__interval" ], "type": "time" }, { "params": [ "null" ], "type": "fill" } ], "measurement": "sourceanalytix.0.hs100__0__10_0_1_79__power.consumption.current_year.this_week.05_Friday", "orderByTime": "ASC", "policy": "default", "refId": "E", "resultFormat": "time_series", "select": [ [ { "params": [ "value" ], "type": "field" }, { "params": [], "type": "mean" } ] ], "tags": [] }, { "alias": "Sa", "groupBy": [ { "params": [ "$__interval" ], "type": "time" }, { "params": [ "null" ], "type": "fill" } ], "measurement": "sourceanalytix.0.hs100__0__10_0_1_79__power.consumption.current_year.this_week.06_Saturday", "orderByTime": "ASC", "policy": "default", "refId": "F", "resultFormat": "time_series", "select": [ [ { "params": [ "value" ], "type": "field" }, { "params": [], "type": "mean" } ] ], "tags": [] }, { "alias": "So", "groupBy": [ { "params": [ "$__interval" ], "type": "time" }, { "params": [ "null" ], "type": "fill" } ], "measurement": "sourceanalytix.0.hs100__0__10_0_1_79__power.consumption.current_year.this_week.07_Sunday", "orderByTime": "ASC", "policy": "default", "refId": "G", "resultFormat": "time_series", "select": [ [ { "params": [ "value" ], "type": "field" }, { "params": [], "type": "mean" } ] ], "tags": [] } ], "thresholds": [], "timeFrom": "7d", "timeRegions": [], "timeShift": null, "title": "PC Tagesverbrauch", "tooltip": { "shared": false, "sort": 0, "value_type": "individual" }, "transparent": true, "type": "graph", "xaxis": { "buckets": null, "mode": "series", "name": null, "show": true, "values": [ "max" ] }, "yaxes": [ { "format": "kwatt", "label": null, "logBase": 1, "max": null, "min": null, "show": true }, { "format": "short", "label": null, "logBase": 1, "max": null, "min": null, "show": false } ], "yaxis": { "align": false, "alignLevel": null } }, { "aliasColors": { "Di": "rgb(234, 255, 0)", "Do": "rgb(255, 105, 0)", "Fr": "rgb(255, 0, 29)", "Mi": "rgb(0, 219, 255)", "Mo": "rgb(67, 255, 0)", "Sa": "rgb(0, 100, 255)", "So": "rgb(255, 0, 216)" }, "bars": true, "dashLength": 10, "dashes": false, "datasource": null, "fill": 1, "fillGradient": 0, "gridPos": { "h": 7, "w": 7, "x": 0, "y": 7 }, "hiddenSeries": false, "hideTimeOverride": true, "id": 27, "legend": { "alignAsTable": false, "avg": false, "current": false, "hideEmpty": false, "hideZero": false, "max": false, "min": false, "show": false, "total": false, "values": false }, "lines": false, "linewidth": 1, "nullPointMode": "connected", "options": { "dataLinks": [] }, "percentage": false, "pointradius": 2, "points": false, "renderer": "flot", "seriesOverrides": [], "spaceLength": 10, "stack": false, "steppedLine": false, "targets": [ { "alias": "Mo", "groupBy": [ { "params": [ "$__interval" ], "type": "time" }, { "params": [ "null" ], "type": "fill" } ], "measurement": "sourceanalytix.0.fronius__0__inverter__1__PAC.consumption.current_year.this_week.01_Monday", "orderByTime": "ASC", "policy": "default", "refId": "A", "resultFormat": "time_series", "select": [ [ { "params": [ "value" ], "type": "field" }, { "params": [], "type": "mean" } ] ], "tags": [] }, { "alias": "Di", "groupBy": [ { "params": [ "$__interval" ], "type": "time" }, { "params": [ "null" ], "type": "fill" } ], "measurement": "sourceanalytix.0.fronius__0__inverter__1__PAC.consumption.current_year.this_week.02_Tuesday", "orderByTime": "ASC", "policy": "default", "refId": "B", "resultFormat": "time_series", "select": [ [ { "params": [ "value" ], "type": "field" }, { "params": [], "type": "mean" } ] ], "tags": [] }, { "alias": "Mi", "groupBy": [ { "params": [ "$__interval" ], "type": "time" }, { "params": [ "null" ], "type": "fill" } ], "measurement": "sourceanalytix.0.fronius__0__inverter__1__PAC.consumption.current_year.this_week.03_Wednesday", "orderByTime": "ASC", "policy": "default", "refId": "C", "resultFormat": "time_series", "select": [ [ { "params": [ "value" ], "type": "field" }, { "params": [], "type": "mean" } ] ], "tags": [] }, { "alias": "Do", "groupBy": [ { "params": [ "$__interval" ], "type": "time" }, { "params": [ "null" ], "type": "fill" } ], "measurement": "sourceanalytix.0.fronius__0__inverter__1__PAC.consumption.current_year.this_week.04_Thursday", "orderByTime": "ASC", "policy": "default", "refId": "D", "resultFormat": "time_series", "select": [ [ { "params": [ "value" ], "type": "field" }, { "params": [], "type": "mean" } ] ], "tags": [] }, { "alias": "Fr", "groupBy": [ { "params": [ "$__interval" ], "type": "time" }, { "params": [ "null" ], "type": "fill" } ], "measurement": "sourceanalytix.0.fronius__0__inverter__1__PAC.consumption.current_year.this_week.05_Friday", "orderByTime": "ASC", "policy": "default", "refId": "E", "resultFormat": "time_series", "select": [ [ { "params": [ "value" ], "type": "field" }, { "params": [], "type": "mean" } ] ], "tags": [] }, { "alias": "Sa", "groupBy": [ { "params": [ "$__interval" ], "type": "time" }, { "params": [ "null" ], "type": "fill" } ], "measurement": "sourceanalytix.0.fronius__0__inverter__1__PAC.consumption.current_year.this_week.06_Saturday", "orderByTime": "ASC", "policy": "default", "refId": "F", "resultFormat": "time_series", "select": [ [ { "params": [ "value" ], "type": "field" }, { "params": [], "type": "mean" } ] ], "tags": [] }, { "alias": "So", "groupBy": [ { "params": [ "$__interval" ], "type": "time" }, { "params": [ "null" ], "type": "fill" } ], "measurement": "sourceanalytix.0.fronius__0__inverter__1__PAC.consumption.current_year.this_week.07_Sunday", "orderByTime": "ASC", "policy": "default", "refId": "G", "resultFormat": "time_series", "select": [ [ { "params": [ "value" ], "type": "field" }, { "params": [], "type": "mean" } ] ], "tags": [] } ], "thresholds": [], "timeFrom": "7d", "timeRegions": [], "timeShift": null, "title": "Photovoltaik Tageserzeugung", "tooltip": { "shared": false, "sort": 0, "value_type": "individual" }, "transparent": true, "type": "graph", "xaxis": { "buckets": null, "mode": "series", "name": null, "show": true, "values": [ "max" ] }, "yaxes": [ { "format": "kwatth", "label": null, "logBase": 1, "max": null, "min": null, "show": true }, { "format": "short", "label": null, "logBase": 1, "max": null, "min": null, "show": false } ], "yaxis": { "align": false, "alignLevel": null } }, { "aliasColors": { "Erzeugung": "rgb(63, 255, 0)" }, "bars": false, "dashLength": 10, "dashes": false, "datasource": null, "fill": 1, "fillGradient": 5, "gridPos": { "h": 7, "w": 7, "x": 7, "y": 7 }, "hiddenSeries": false, "hideTimeOverride": true, "id": 26, "legend": { "avg": false, "current": true, "max": true, "min": false, "show": true, "total": false, "values": true }, "lines": true, "linewidth": 1, "nullPointMode": "connected", "options": { "dataLinks": [] }, "percentage": false, "pointradius": 2, "points": false, "renderer": "flot", "seriesOverrides": [], "spaceLength": 10, "stack": false, "steppedLine": false, "targets": [ { "alias": "Erzeugung", "groupBy": [ { "params": [ "$__interval" ], "type": "time" }, { "params": [ "0" ], "type": "fill" } ], "measurement": "fronius.0.inverter.1.PAC", "orderByTime": "ASC", "policy": "default", "refId": "A", "resultFormat": "time_series", "select": [ [ { "params": [ "value" ], "type": "field" }, { "params": [], "type": "mean" } ] ], "tags": [] } ], "thresholds": [], "timeFrom": "24h", "timeRegions": [], "timeShift": null, "title": "Photovoltaik Erzeugung 24 Stunden", "tooltip": { "shared": true, "sort": 0, "value_type": "individual" }, "transparent": true, "type": "graph", "xaxis": { "buckets": null, "mode": "time", "name": null, "show": true, "values": [] }, "yaxes": [ { "format": "watth", "label": null, "logBase": 1, "max": null, "min": null, "show": true }, { "format": "short", "label": null, "logBase": 1, "max": null, "min": null, "show": false } ], "yaxis": { "align": false, "alignLevel": null } }, { "aliasColors": { "AKTUELLER_VERBRAUCH.mean": "dark-red", "Aktuelle Erzeugung": "rgb(0, 114, 255)", "Aktuelle Lieferung": "rgb(26, 255, 0)", "Aktueller Verbrauch": "rgb(255, 0, 27)" }, "bars": false, "dashLength": 10, "dashes": false, "datasource": null, "decimals": 2, "fill": 5, "fillGradient": 0, "gridPos": { "h": 7, "w": 7, "x": 14, "y": 7 }, "hiddenSeries": false, "hideTimeOverride": true, "id": 2, "legend": { "alignAsTable": false, "avg": false, "current": true, "hideEmpty": false, "hideZero": false, "max": true, "min": false, "rightSide": false, "show": true, "total": false, "values": true }, "lines": true, "linewidth": 1, "nullPointMode": "connected", "options": { "dataLinks": [] }, "percentage": false, "pointradius": 2, "points": false, "renderer": "flot", "seriesOverrides": [], "spaceLength": 10, "stack": false, "steppedLine": false, "targets": [ { "alias": "Aktuelle Lieferung", "groupBy": [ { "params": [ "$__interval" ], "type": "time" }, { "params": [ "previous" ], "type": "fill" } ], "measurement": "AKTUELLE_LIEFERUNG", "orderByTime": "ASC", "policy": "default", "refId": "A", "resultFormat": "time_series", "select": [ [ { "params": [ "value" ], "type": "field" }, { "params": [], "type": "last" } ] ], "tags": [] }, { "alias": "Aktueller Verbrauch", "groupBy": [ { "params": [ "$__interval" ], "type": "time" }, { "params": [ "previous" ], "type": "fill" } ], "measurement": "AKTUELLER_VERBRAUCH", "orderByTime": "ASC", "policy": "default", "refId": "B", "resultFormat": "time_series", "select": [ [ { "params": [ "value" ], "type": "field" }, { "params": [], "type": "last" } ] ], "tags": [] }, { "alias": "Aktuelle Erzeugung", "groupBy": [ { "params": [ "$__interval" ], "type": "time" }, { "params": [ "previous" ], "type": "fill" } ], "measurement": "fronius.0.inverter.1.PAC", "orderByTime": "ASC", "policy": "default", "refId": "C", "resultFormat": "time_series", "select": [ [ { "params": [ "value" ], "type": "field" }, { "params": [], "type": "last" } ] ], "tags": [] } ], "thresholds": [], "timeFrom": "24h", "timeRegions": [], "timeShift": null, "title": "Strom Verbrauch/Lieferung/Erzeugung 24 Stunden", "tooltip": { "shared": true, "sort": 0, "value_type": "individual" }, "transparent": true, "type": "graph", "xaxis": { "buckets": null, "mode": "time", "name": null, "show": true, "values": [] }, "yaxes": [ { "decimals": null, "format": "watth", "label": null, "logBase": 1, "max": null, "min": "0", "show": true }, { "decimals": null, "format": "watt", "label": null, "logBase": 1, "max": null, "min": "0", "show": false } ], "yaxis": { "align": false, "alignLevel": 0 } }, { "aliasColors": { "Verbrauch": "rgb(29, 255, 0)" }, "bars": false, "dashLength": 10, "dashes": false, "datasource": null, "fill": 5, "fillGradient": 10, "gridPos": { "h": 7, "w": 7, "x": 0, "y": 14 }, "hiddenSeries": false, "hideTimeOverride": true, "id": 22, "legend": { "alignAsTable": false, "avg": false, "current": true, "max": false, "min": false, "show": true, "total": false, "values": true }, "lines": true, "linewidth": 1, "nullPointMode": "connected", "options": { "dataLinks": [] }, "percentage": false, "pointradius": 2, "points": false, "renderer": "flot", "seriesOverrides": [], "spaceLength": 10, "stack": false, "steppedLine": false, "targets": [ { "alias": "Verbrauch", "groupBy": [ { "params": [ "$__interval" ], "type": "time" }, { "params": [ "null" ], "type": "fill" } ], "measurement": "Serverschrank_aktuell", "orderByTime": "ASC", "policy": "default", "refId": "A", "resultFormat": "time_series", "select": [ [ { "params": [ "value" ], "type": "field" }, { "params": [], "type": "mean" } ] ], "tags": [] } ], "thresholds": [], "timeFrom": "now/d", "timeRegions": [], "timeShift": null, "title": "Serverschrank aktuell", "tooltip": { "shared": true, "sort": 0, "value_type": "individual" }, "transparent": true, "type": "graph", "xaxis": { "buckets": null, "mode": "time", "name": null, "show": true, "values": [] }, "yaxes": [ { "format": "watt", "label": "", "logBase": 1, "max": null, "min": null, "show": true }, { "format": "short", "label": null, "logBase": 1, "max": null, "min": null, "show": false } ], "yaxis": { "align": false, "alignLevel": null } }, { "aliasColors": { "Aquarium_aktuell.mean": "rgb(60, 255, 0)", "Verbrauch": "rgb(59, 255, 0)" }, "bars": false, "dashLength": 10, "dashes": false, "datasource": null, "fill": 5, "fillGradient": 10, "gridPos": { "h": 7, "w": 7, "x": 7, "y": 14 }, "hiddenSeries": false, "hideTimeOverride": true, "id": 18, "interval": "", "legend": { "alignAsTable": false, "avg": false, "current": true, "hideEmpty": false, "hideZero": false, "max": true, "min": true, "show": true, "total": false, "values": true }, "lines": true, "linewidth": 1, "nullPointMode": "connected", "options": { "dataLinks": [] }, "percentage": false, "pointradius": 2, "points": false, "renderer": "flot", "repeat": null, "seriesOverrides": [], "spaceLength": 10, "stack": false, "steppedLine": false, "targets": [ { "alias": "Verbrauch", "groupBy": [ { "params": [ "$__interval" ], "type": "time" }, { "params": [ "null" ], "type": "fill" } ], "measurement": "Aquarium_aktuell", "orderByTime": "ASC", "policy": "default", "refId": "A", "resultFormat": "time_series", "select": [ [ { "params": [ "value" ], "type": "field" }, { "params": [], "type": "mean" } ] ], "tags": [] } ], "thresholds": [], "timeFrom": "now/d", "timeRegions": [], "timeShift": null, "title": "Aquarium aktuell", "tooltip": { "shared": true, "sort": 0, "value_type": "individual" }, "transparent": true, "type": "graph", "xaxis": { "buckets": null, "mode": "time", "name": null, "show": true, "values": [] }, "yaxes": [ { "decimals": null, "format": "watt", "label": "", "logBase": 1, "max": null, "min": null, "show": true }, { "format": "short", "label": null, "logBase": 1, "max": null, "min": null, "show": false } ], "yaxis": { "align": false, "alignLevel": null } }, { "aliasColors": { "aktuell": "rgb(29, 255, 0)" }, "bars": false, "dashLength": 10, "dashes": false, "datasource": null, "fill": 5, "fillGradient": 10, "gridPos": { "h": 7, "w": 7, "x": 14, "y": 14 }, "hiddenSeries": false, "hideTimeOverride": true, "id": 14, "legend": { "alignAsTable": false, "avg": false, "current": true, "hideEmpty": false, "hideZero": false, "max": true, "min": true, "show": true, "total": false, "values": true }, "lines": true, "linewidth": 1, "nullPointMode": "connected", "options": { "dataLinks": [] }, "percentage": false, "pointradius": 2, "points": false, "renderer": "flot", "seriesOverrides": [], "spaceLength": 10, "stack": false, "steppedLine": false, "targets": [ { "alias": "aktuell", "groupBy": [ { "params": [ "$__interval" ], "type": "time" }, { "params": [ "null" ], "type": "fill" } ], "measurement": "PC_aktuell", "orderByTime": "ASC", "policy": "default", "refId": "A", "resultFormat": "time_series", "select": [ [ { "params": [ "value" ], "type": "field" }, { "params": [], "type": "mean" } ] ], "tags": [] } ], "thresholds": [], "timeFrom": "now/d", "timeRegions": [], "timeShift": null, "title": "PC aktuell", "tooltip": { "shared": true, "sort": 0, "value_type": "individual" }, "transparent": true, "type": "graph", "xaxis": { "buckets": null, "mode": "time", "name": null, "show": true, "values": [] }, "yaxes": [ { "format": "watt", "label": null, "logBase": 1, "max": null, "min": null, "show": true }, { "format": "short", "label": null, "logBase": 1, "max": null, "min": null, "show": false } ], "yaxis": { "align": false, "alignLevel": null } }, { "aliasColors": { "Aussentemperatur": "rgb(0, 100, 255)", "Temperatur_aussen_aktuell.mean": "rgb(23, 0, 255)" }, "bars": false, "dashLength": 10, "dashes": false, "datasource": null, "decimals": 2, "description": "", "fill": 5, "fillGradient": 10, "gridPos": { "h": 7, "w": 7, "x": 0, "y": 21 }, "hiddenSeries": false, "hideTimeOverride": true, "id": 12, "legend": { "alignAsTable": false, "avg": false, "current": true, "max": true, "min": true, "show": true, "total": false, "values": true }, "lines": true, "linewidth": 1, "nullPointMode": "connected", "options": { "dataLinks": [] }, "percentage": false, "pointradius": 2, "points": false, "renderer": "flot", "seriesOverrides": [], "spaceLength": 10, "stack": false, "steppedLine": false, "targets": [ { "alias": "Aussentemperatur", "groupBy": [ { "params": [ "$__interval" ], "type": "time" }, { "params": [ "null" ], "type": "fill" } ], "measurement": "Aussentemp-Keller", "orderByTime": "ASC", "policy": "default", "refId": "A", "resultFormat": "time_series", "select": [ [ { "params": [ "value" ], "type": "field" }, { "params": [], "type": "mean" } ] ], "tags": [] } ], "thresholds": [], "timeFrom": "24h", "timeRegions": [], "timeShift": null, "title": "Aussentemperatur", "tooltip": { "shared": true, "sort": 0, "value_type": "individual" }, "transparent": true, "type": "graph", "xaxis": { "buckets": null, "mode": "time", "name": null, "show": true, "values": [] }, "yaxes": [ { "decimals": null, "format": "celsius", "label": null, "logBase": 1, "max": null, "min": null, "show": true }, { "format": "short", "label": null, "logBase": 1, "max": null, "min": null, "show": false } ], "yaxis": { "align": false, "alignLevel": null } }, { "aliasColors": { "Bad": "rgb(64, 255, 0)", "Kinderzimmer": "rgb(255, 0, 4)", "Temperatur_Bad.mean": "rgb(65, 255, 0)", "Temperatur_KiZi.mean": "rgb(255, 183, 0)", "Temperatur_WoZi.mean": "rgb(0, 218, 255)", "Wohnzimmer": "rgb(0, 218, 255)" }, "bars": false, "dashLength": 10, "dashes": false, "datasource": null, "decimals": 2, "fill": 5, "fillGradient": 10, "gridPos": { "h": 7, "w": 7, "x": 7, "y": 21 }, "hiddenSeries": false, "hideTimeOverride": true, "id": 10, "legend": { "alignAsTable": false, "avg": false, "current": false, "hideEmpty": false, "hideZero": false, "max": false, "min": false, "show": true, "total": false, "values": false }, "lines": true, "linewidth": 1, "nullPointMode": "connected", "options": { "dataLinks": [] }, "percentage": false, "pointradius": 2, "points": false, "renderer": "flot", "seriesOverrides": [], "spaceLength": 10, "stack": false, "steppedLine": false, "targets": [ { "alias": "Bad", "groupBy": [ { "params": [ "$__interval" ], "type": "time" }, { "params": [ "null" ], "type": "fill" } ], "measurement": "Temperatur_Bad", "orderByTime": "ASC", "policy": "default", "refId": "A", "resultFormat": "time_series", "select": [ [ { "params": [ "value" ], "type": "field" }, { "params": [], "type": "mean" } ] ], "tags": [] }, { "alias": "Kinderzimmer", "groupBy": [ { "params": [ "$__interval" ], "type": "time" }, { "params": [ "null" ], "type": "fill" } ], "measurement": "Temperatur_KiZi", "orderByTime": "ASC", "policy": "default", "refId": "B", "resultFormat": "time_series", "select": [ [ { "params": [ "value" ], "type": "field" }, { "params": [], "type": "mean" } ] ], "tags": [] }, { "alias": "Wohnzimmer", "groupBy": [ { "params": [ "$__interval" ], "type": "time" }, { "params": [ "null" ], "type": "fill" } ], "measurement": "Temperatur_WoZi", "orderByTime": "ASC", "policy": "default", "refId": "C", "resultFormat": "time_series", "select": [ [ { "params": [ "value" ], "type": "field" }, { "params": [], "type": "mean" } ] ], "tags": [] } ], "thresholds": [], "timeFrom": "24h", "timeRegions": [], "timeShift": null, "title": "Zimmertemperatur", "tooltip": { "shared": true, "sort": 0, "value_type": "individual" }, "transparent": true, "type": "graph", "xaxis": { "buckets": null, "mode": "time", "name": null, "show": true, "values": [] }, "yaxes": [ { "decimals": 2, "format": "celsius", "label": null, "logBase": 1, "max": null, "min": null, "show": true }, { "format": "short", "label": null, "logBase": 1, "max": null, "min": null, "show": false } ], "yaxis": { "align": true, "alignLevel": 0 } }, { "aliasColors": { "Download": "rgb(63, 255, 0)", "Upload": "rgb(255, 0, 23)", "Webspeedy Download.mean": "rgb(58, 255, 0)" }, "bars": false, "dashLength": 10, "dashes": false, "datasource": null, "fill": 5, "fillGradient": 0, "gridPos": { "h": 7, "w": 7, "x": 14, "y": 21 }, "hiddenSeries": false, "id": 6, "legend": { "alignAsTable": false, "avg": false, "current": false, "max": true, "min": true, "show": true, "total": false, "values": true }, "lines": true, "linewidth": 1, "nullPointMode": "connected", "options": { "dataLinks": [] }, "percentage": false, "pointradius": 2, "points": false, "renderer": "flot", "seriesOverrides": [], "spaceLength": 10, "stack": false, "steppedLine": false, "targets": [ { "alias": "Download", "groupBy": [ { "params": [ "$__interval" ], "type": "time" }, { "params": [ "null" ], "type": "fill" } ], "measurement": "Webspeedy Download", "orderByTime": "ASC", "policy": "default", "refId": "A", "resultFormat": "time_series", "select": [ [ { "params": [ "value" ], "type": "field" }, { "params": [], "type": "last" } ] ], "tags": [] }, { "alias": "Upload", "groupBy": [ { "params": [ "$__interval" ], "type": "time" }, { "params": [ "null" ], "type": "fill" } ], "measurement": "Webspeedy Upload", "orderByTime": "ASC", "policy": "default", "refId": "B", "resultFormat": "time_series", "select": [ [ { "params": [ "value" ], "type": "field" }, { "params": [], "type": "last" } ] ], "tags": [] } ], "thresholds": [], "timeFrom": "24h", "timeRegions": [], "timeShift": null, "title": "Speedtest", "tooltip": { "shared": true, "sort": 0, "value_type": "individual" }, "transparent": true, "type": "graph", "xaxis": { "buckets": null, "mode": "time", "name": null, "show": true, "values": [] }, "yaxes": [ { "decimals": 2, "format": "Mbits", "label": "", "logBase": 1, "max": null, "min": "0", "show": true }, { "format": "short", "label": null, "logBase": 1, "max": null, "min": null, "show": false } ], "yaxis": { "align": true, "alignLevel": 0 } } ], "refresh": "1m", "schemaVersion": 22, "style": "dark", "tags": [], "templating": { "list": [] }, "time": { "from": "now-24h", "to": "now" }, "timepicker": { "refresh_intervals": [ "5s", "10s", "30s", "1m", "5m", "15m", "30m", "1h", "2h", "1d" ] }, "timezone": "", "title": "Allgemein", "uid": "XMW0dj_Wz", "version": 119 } -
@ilovegym sagte in VIS von Sigi234:
welches Plugin ist das bei Grafana? hab da auch erst mit angefangen.. kannst du mir die am besten exportieren, dann kann ich schauen wie das eingestellt ist.. auch mit den Wochentagen.. ???
Das mit den Wochentagen ist mit dem Graph Panel gemacht.
Ich hab dir mal das ganze Dashboard exportiert. Hoffe es hat geklappt.
{ "annotations": { "list": [ { "builtIn": 1, "datasource": "-- Grafana --", "enable": true, "hide": true, "iconColor": "rgba(0, 211, 255, 1)", "name": "Annotations & Alerts", "type": "dashboard" } ] }, "editable": true, "gnetId": null, "graphTooltip": 0, "id": 2, "links": [], "panels": [ { "aliasColors": { "Di": "rgb(255, 247, 0)", "Dienstag": "rgb(255, 221, 0)", "Do": "rgb(255, 101, 0)", "Donnerstag": "rgb(255, 126, 0)", "Fr": "rgb(255, 16, 0)", "Freitag": "rgb(255, 0, 31)", "Mi": "rgb(0, 219, 255)", "Mittwoch": "rgb(0, 100, 255)", "Mo": "rgb(63, 255, 0)", "Montag": "rgb(61, 255, 0)", "Sa": "rgb(0, 137, 255)", "Samstag": "rgb(0, 95, 255)", "So": "rgb(255, 0, 218)", "Sonntag": "rgb(255, 0, 215)" }, "bars": true, "dashLength": 10, "dashes": false, "datasource": null, "fill": 1, "fillGradient": 0, "gridPos": { "h": 7, "w": 7, "x": 0, "y": 0 }, "hiddenSeries": false, "hideTimeOverride": true, "id": 24, "interval": "", "legend": { "avg": false, "current": false, "max": false, "min": false, "show": false, "total": false, "values": false }, "lines": false, "linewidth": 1, "nullPointMode": "connected", "options": { "dataLinks": [] }, "percentage": false, "pluginVersion": "6.6.2", "pointradius": 2, "points": false, "renderer": "flot", "seriesOverrides": [], "spaceLength": 10, "stack": false, "steppedLine": false, "targets": [ { "alias": "Mo", "groupBy": [ { "params": [ "$__interval" ], "type": "time" }, { "params": [ "null" ], "type": "fill" } ], "measurement": "sourceanalytix.0.hs100__0__10_0_1_80__power.consumption.current_year.this_week.01_Monday", "orderByTime": "ASC", "policy": "default", "refId": "A", "resultFormat": "time_series", "select": [ [ { "params": [ "value" ], "type": "field" }, { "params": [], "type": "mean" } ] ], "tags": [] }, { "alias": "Di", "groupBy": [ { "params": [ "$__interval" ], "type": "time" }, { "params": [ "null" ], "type": "fill" } ], "measurement": "sourceanalytix.0.hs100__0__10_0_1_80__power.consumption.current_year.this_week.02_Tuesday", "orderByTime": "ASC", "policy": "default", "refId": "B", "resultFormat": "time_series", "select": [ [ { "params": [ "value" ], "type": "field" }, { "params": [], "type": "mean" } ] ], "tags": [] }, { "alias": "Mi", "groupBy": [ { "params": [ "$__interval" ], "type": "time" }, { "params": [ "null" ], "type": "fill" } ], "measurement": "sourceanalytix.0.hs100__0__10_0_1_80__power.consumption.current_year.this_week.03_Wednesday", "orderByTime": "ASC", "policy": "default", "refId": "C", "resultFormat": "time_series", "select": [ [ { "params": [ "value" ], "type": "field" }, { "params": [], "type": "mean" } ] ], "tags": [] }, { "alias": "Do", "groupBy": [ { "params": [ "$__interval" ], "type": "time" }, { "params": [ "null" ], "type": "fill" } ], "measurement": "sourceanalytix.0.hs100__0__10_0_1_80__power.consumption.current_year.this_week.04_Thursday", "orderByTime": "ASC", "policy": "default", "refId": "D", "resultFormat": "time_series", "select": [ [ { "params": [ "value" ], "type": "field" }, { "params": [], "type": "mean" } ] ], "tags": [] }, { "alias": "Fr", "groupBy": [ { "params": [ "$__interval" ], "type": "time" }, { "params": [ "null" ], "type": "fill" } ], "measurement": "sourceanalytix.0.hs100__0__10_0_1_80__power.consumption.current_year.this_week.05_Friday", "orderByTime": "ASC", "policy": "default", "refId": "E", "resultFormat": "time_series", "select": [ [ { "params": [ "value" ], "type": "field" }, { "params": [], "type": "mean" } ] ], "tags": [] }, { "alias": "Sa", "groupBy": [ { "params": [ "$__interval" ], "type": "time" }, { "params": [ "null" ], "type": "fill" } ], "measurement": "sourceanalytix.0.hs100__0__10_0_1_80__power.consumption.current_year.this_week.06_Saturday", "orderByTime": "ASC", "policy": "default", "refId": "F", "resultFormat": "time_series", "select": [ [ { "params": [ "value" ], "type": "field" }, { "params": [], "type": "mean" } ] ], "tags": [] }, { "alias": "So", "groupBy": [ { "params": [ "$__interval" ], "type": "time" }, { "params": [ "null" ], "type": "fill" } ], "measurement": "sourceanalytix.0.hs100__0__10_0_1_80__power.consumption.current_year.this_week.07_Sunday", "orderByTime": "ASC", "policy": "default", "refId": "G", "resultFormat": "time_series", "select": [ [ { "params": [ "value" ], "type": "field" }, { "params": [], "type": "mean" } ] ], "tags": [] } ], "thresholds": [], "timeFrom": "7d", "timeRegions": [], "timeShift": null, "title": "Serverschrank Tagesverbrauch", "tooltip": { "shared": false, "sort": 0, "value_type": "individual" }, "transparent": true, "type": "graph", "xaxis": { "buckets": null, "mode": "series", "name": null, "show": true, "values": [ "max" ] }, "yaxes": [ { "format": "kwatt", "label": null, "logBase": 1, "max": null, "min": null, "show": true }, { "format": "short", "label": null, "logBase": 1, "max": null, "min": null, "show": false } ], "yaxis": { "align": false, "alignLevel": null } }, { "aliasColors": { "Di": "rgb(219, 255, 0)", "Do": "rgb(255, 105, 0)", "Fr": "rgb(255, 18, 0)", "Mi": "rgb(0, 218, 255)", "Mo": "rgb(63, 255, 0)", "Sa": "rgb(0, 101, 255)", "So": "rgb(255, 0, 211)", "Tagesverbrauch": "dark-blue" }, "bars": true, "dashLength": 10, "dashes": false, "datasource": null, "fill": 1, "fillGradient": 0, "gridPos": { "h": 7, "w": 7, "x": 7, "y": 0 }, "hiddenSeries": false, "hideTimeOverride": true, "id": 20, "legend": { "alignAsTable": false, "avg": false, "current": false, "hideEmpty": false, "hideZero": false, "max": false, "min": false, "show": false, "total": false, "values": false }, "lines": false, "linewidth": 1, "nullPointMode": "connected", "options": { "dataLinks": [] }, "percentage": false, "pluginVersion": "6.6.2", "pointradius": 6, "points": false, "renderer": "flot", "seriesOverrides": [], "spaceLength": 10, "stack": false, "steppedLine": false, "targets": [ { "alias": "Mo", "groupBy": [ { "params": [ "$__interval" ], "type": "time" }, { "params": [ "null" ], "type": "fill" } ], "measurement": "sourceanalytix.0.hs100__0__10_0_1_77__power.consumption.current_year.this_week.01_Monday", "orderByTime": "ASC", "policy": "default", "refId": "A", "resultFormat": "time_series", "select": [ [ { "params": [ "value" ], "type": "field" }, { "params": [], "type": "mean" } ] ], "tags": [] }, { "alias": "Di", "groupBy": [ { "params": [ "$__interval" ], "type": "time" }, { "params": [ "null" ], "type": "fill" } ], "measurement": "sourceanalytix.0.hs100__0__10_0_1_77__power.consumption.current_year.this_week.02_Tuesday", "orderByTime": "ASC", "policy": "default", "refId": "B", "resultFormat": "time_series", "select": [ [ { "params": [ "value" ], "type": "field" }, { "params": [], "type": "mean" } ] ], "tags": [] }, { "alias": "Mi", "groupBy": [ { "params": [ "$__interval" ], "type": "time" }, { "params": [ "null" ], "type": "fill" } ], "measurement": "sourceanalytix.0.hs100__0__10_0_1_77__power.consumption.current_year.this_week.03_Wednesday", "orderByTime": "ASC", "policy": "default", "refId": "C", "resultFormat": "time_series", "select": [ [ { "params": [ "value" ], "type": "field" }, { "params": [], "type": "mean" } ] ], "tags": [] }, { "alias": "Do", "groupBy": [ { "params": [ "$__interval" ], "type": "time" }, { "params": [ "null" ], "type": "fill" } ], "measurement": "sourceanalytix.0.hs100__0__10_0_1_77__power.consumption.current_year.this_week.04_Thursday", "orderByTime": "ASC", "policy": "default", "refId": "D", "resultFormat": "time_series", "select": [ [ { "params": [ "value" ], "type": "field" }, { "params": [], "type": "mean" } ] ], "tags": [] }, { "alias": "Fr", "groupBy": [ { "params": [ "$__interval" ], "type": "time" }, { "params": [ "null" ], "type": "fill" } ], "measurement": "sourceanalytix.0.hs100__0__10_0_1_77__power.consumption.current_year.this_week.05_Friday", "orderByTime": "ASC", "policy": "default", "refId": "E", "resultFormat": "time_series", "select": [ [ { "params": [ "value" ], "type": "field" }, { "params": [], "type": "mean" } ] ], "tags": [] }, { "alias": "Sa", "groupBy": [ { "params": [ "$__interval" ], "type": "time" }, { "params": [ "null" ], "type": "fill" } ], "measurement": "sourceanalytix.0.hs100__0__10_0_1_77__power.consumption.current_year.this_week.06_Saturday", "orderByTime": "ASC", "policy": "default", "refId": "F", "resultFormat": "time_series", "select": [ [ { "params": [ "value" ], "type": "field" }, { "params": [], "type": "mean" } ] ], "tags": [] }, { "alias": "So", "groupBy": [ { "params": [ "$__interval" ], "type": "time" }, { "params": [ "null" ], "type": "fill" } ], "measurement": "sourceanalytix.0.hs100__0__10_0_1_77__power.consumption.current_year.this_week.07_Sunday", "orderByTime": "ASC", "policy": "default", "refId": "G", "resultFormat": "time_series", "select": [ [ { "params": [ "value" ], "type": "field" }, { "params": [], "type": "mean" } ] ], "tags": [] } ], "thresholds": [], "timeFrom": "7d", "timeRegions": [], "timeShift": null, "title": "Aquarium Tagesverbrauch", "tooltip": { "shared": false, "sort": 0, "value_type": "individual" }, "transparent": true, "type": "graph", "xaxis": { "buckets": null, "mode": "series", "name": null, "show": true, "values": [ "max" ] }, "yaxes": [ { "format": "kwatt", "label": "", "logBase": 1, "max": null, "min": null, "show": true }, { "format": "short", "label": null, "logBase": 1, "max": null, "min": null, "show": false } ], "yaxis": { "align": true, "alignLevel": 0 } }, { "aliasColors": { "Di": "rgb(234, 255, 0)", "Do": "rgb(255, 105, 0)", "Fr": "rgb(255, 0, 29)", "Mi": "rgb(0, 219, 255)", "Mo": "rgb(67, 255, 0)", "Sa": "rgb(0, 100, 255)", "So": "rgb(255, 0, 216)" }, "bars": true, "dashLength": 10, "dashes": false, "datasource": null, "fill": 1, "fillGradient": 0, "gridPos": { "h": 7, "w": 7, "x": 14, "y": 0 }, "hiddenSeries": false, "hideTimeOverride": true, "id": 16, "legend": { "alignAsTable": false, "avg": false, "current": false, "hideEmpty": false, "hideZero": false, "max": false, "min": false, "show": false, "total": false, "values": false }, "lines": false, "linewidth": 1, "nullPointMode": "connected", "options": { "dataLinks": [] }, "percentage": false, "pointradius": 2, "points": false, "renderer": "flot", "seriesOverrides": [], "spaceLength": 10, "stack": false, "steppedLine": false, "targets": [ { "alias": "Mo", "groupBy": [ { "params": [ "$__interval" ], "type": "time" }, { "params": [ "null" ], "type": "fill" } ], "measurement": "sourceanalytix.0.hs100__0__10_0_1_79__power.consumption.current_year.this_week.01_Monday", "orderByTime": "ASC", "policy": "default", "refId": "A", "resultFormat": "time_series", "select": [ [ { "params": [ "value" ], "type": "field" }, { "params": [], "type": "mean" } ] ], "tags": [] }, { "alias": "Di", "groupBy": [ { "params": [ "$__interval" ], "type": "time" }, { "params": [ "null" ], "type": "fill" } ], "measurement": "sourceanalytix.0.hs100__0__10_0_1_79__power.consumption.current_year.this_week.02_Tuesday", "orderByTime": "ASC", "policy": "default", "refId": "B", "resultFormat": "time_series", "select": [ [ { "params": [ "value" ], "type": "field" }, { "params": [], "type": "mean" } ] ], "tags": [] }, { "alias": "Mi", "groupBy": [ { "params": [ "$__interval" ], "type": "time" }, { "params": [ "null" ], "type": "fill" } ], "measurement": "sourceanalytix.0.hs100__0__10_0_1_79__power.consumption.current_year.this_week.03_Wednesday", "orderByTime": "ASC", "policy": "default", "refId": "C", "resultFormat": "time_series", "select": [ [ { "params": [ "value" ], "type": "field" }, { "params": [], "type": "mean" } ] ], "tags": [] }, { "alias": "Do", "groupBy": [ { "params": [ "$__interval" ], "type": "time" }, { "params": [ "null" ], "type": "fill" } ], "measurement": "sourceanalytix.0.hs100__0__10_0_1_79__power.consumption.current_year.this_week.04_Thursday", "orderByTime": "ASC", "policy": "default", "refId": "D", "resultFormat": "time_series", "select": [ [ { "params": [ "value" ], "type": "field" }, { "params": [], "type": "mean" } ] ], "tags": [] }, { "alias": "Fr", "groupBy": [ { "params": [ "$__interval" ], "type": "time" }, { "params": [ "null" ], "type": "fill" } ], "measurement": "sourceanalytix.0.hs100__0__10_0_1_79__power.consumption.current_year.this_week.05_Friday", "orderByTime": "ASC", "policy": "default", "refId": "E", "resultFormat": "time_series", "select": [ [ { "params": [ "value" ], "type": "field" }, { "params": [], "type": "mean" } ] ], "tags": [] }, { "alias": "Sa", "groupBy": [ { "params": [ "$__interval" ], "type": "time" }, { "params": [ "null" ], "type": "fill" } ], "measurement": "sourceanalytix.0.hs100__0__10_0_1_79__power.consumption.current_year.this_week.06_Saturday", "orderByTime": "ASC", "policy": "default", "refId": "F", "resultFormat": "time_series", "select": [ [ { "params": [ "value" ], "type": "field" }, { "params": [], "type": "mean" } ] ], "tags": [] }, { "alias": "So", "groupBy": [ { "params": [ "$__interval" ], "type": "time" }, { "params": [ "null" ], "type": "fill" } ], "measurement": "sourceanalytix.0.hs100__0__10_0_1_79__power.consumption.current_year.this_week.07_Sunday", "orderByTime": "ASC", "policy": "default", "refId": "G", "resultFormat": "time_series", "select": [ [ { "params": [ "value" ], "type": "field" }, { "params": [], "type": "mean" } ] ], "tags": [] } ], "thresholds": [], "timeFrom": "7d", "timeRegions": [], "timeShift": null, "title": "PC Tagesverbrauch", "tooltip": { "shared": false, "sort": 0, "value_type": "individual" }, "transparent": true, "type": "graph", "xaxis": { "buckets": null, "mode": "series", "name": null, "show": true, "values": [ "max" ] }, "yaxes": [ { "format": "kwatt", "label": null, "logBase": 1, "max": null, "min": null, "show": true }, { "format": "short", "label": null, "logBase": 1, "max": null, "min": null, "show": false } ], "yaxis": { "align": false, "alignLevel": null } }, { "aliasColors": { "Di": "rgb(234, 255, 0)", "Do": "rgb(255, 105, 0)", "Fr": "rgb(255, 0, 29)", "Mi": "rgb(0, 219, 255)", "Mo": "rgb(67, 255, 0)", "Sa": "rgb(0, 100, 255)", "So": "rgb(255, 0, 216)" }, "bars": true, "dashLength": 10, "dashes": false, "datasource": null, "fill": 1, "fillGradient": 0, "gridPos": { "h": 7, "w": 7, "x": 0, "y": 7 }, "hiddenSeries": false, "hideTimeOverride": true, "id": 27, "legend": { "alignAsTable": false, "avg": false, "current": false, "hideEmpty": false, "hideZero": false, "max": false, "min": false, "show": false, "total": false, "values": false }, "lines": false, "linewidth": 1, "nullPointMode": "connected", "options": { "dataLinks": [] }, "percentage": false, "pointradius": 2, "points": false, "renderer": "flot", "seriesOverrides": [], "spaceLength": 10, "stack": false, "steppedLine": false, "targets": [ { "alias": "Mo", "groupBy": [ { "params": [ "$__interval" ], "type": "time" }, { "params": [ "null" ], "type": "fill" } ], "measurement": "sourceanalytix.0.fronius__0__inverter__1__PAC.consumption.current_year.this_week.01_Monday", "orderByTime": "ASC", "policy": "default", "refId": "A", "resultFormat": "time_series", "select": [ [ { "params": [ "value" ], "type": "field" }, { "params": [], "type": "mean" } ] ], "tags": [] }, { "alias": "Di", "groupBy": [ { "params": [ "$__interval" ], "type": "time" }, { "params": [ "null" ], "type": "fill" } ], "measurement": "sourceanalytix.0.fronius__0__inverter__1__PAC.consumption.current_year.this_week.02_Tuesday", "orderByTime": "ASC", "policy": "default", "refId": "B", "resultFormat": "time_series", "select": [ [ { "params": [ "value" ], "type": "field" }, { "params": [], "type": "mean" } ] ], "tags": [] }, { "alias": "Mi", "groupBy": [ { "params": [ "$__interval" ], "type": "time" }, { "params": [ "null" ], "type": "fill" } ], "measurement": "sourceanalytix.0.fronius__0__inverter__1__PAC.consumption.current_year.this_week.03_Wednesday", "orderByTime": "ASC", "policy": "default", "refId": "C", "resultFormat": "time_series", "select": [ [ { "params": [ "value" ], "type": "field" }, { "params": [], "type": "mean" } ] ], "tags": [] }, { "alias": "Do", "groupBy": [ { "params": [ "$__interval" ], "type": "time" }, { "params": [ "null" ], "type": "fill" } ], "measurement": "sourceanalytix.0.fronius__0__inverter__1__PAC.consumption.current_year.this_week.04_Thursday", "orderByTime": "ASC", "policy": "default", "refId": "D", "resultFormat": "time_series", "select": [ [ { "params": [ "value" ], "type": "field" }, { "params": [], "type": "mean" } ] ], "tags": [] }, { "alias": "Fr", "groupBy": [ { "params": [ "$__interval" ], "type": "time" }, { "params": [ "null" ], "type": "fill" } ], "measurement": "sourceanalytix.0.fronius__0__inverter__1__PAC.consumption.current_year.this_week.05_Friday", "orderByTime": "ASC", "policy": "default", "refId": "E", "resultFormat": "time_series", "select": [ [ { "params": [ "value" ], "type": "field" }, { "params": [], "type": "mean" } ] ], "tags": [] }, { "alias": "Sa", "groupBy": [ { "params": [ "$__interval" ], "type": "time" }, { "params": [ "null" ], "type": "fill" } ], "measurement": "sourceanalytix.0.fronius__0__inverter__1__PAC.consumption.current_year.this_week.06_Saturday", "orderByTime": "ASC", "policy": "default", "refId": "F", "resultFormat": "time_series", "select": [ [ { "params": [ "value" ], "type": "field" }, { "params": [], "type": "mean" } ] ], "tags": [] }, { "alias": "So", "groupBy": [ { "params": [ "$__interval" ], "type": "time" }, { "params": [ "null" ], "type": "fill" } ], "measurement": "sourceanalytix.0.fronius__0__inverter__1__PAC.consumption.current_year.this_week.07_Sunday", "orderByTime": "ASC", "policy": "default", "refId": "G", "resultFormat": "time_series", "select": [ [ { "params": [ "value" ], "type": "field" }, { "params": [], "type": "mean" } ] ], "tags": [] } ], "thresholds": [], "timeFrom": "7d", "timeRegions": [], "timeShift": null, "title": "Photovoltaik Tageserzeugung", "tooltip": { "shared": false, "sort": 0, "value_type": "individual" }, "transparent": true, "type": "graph", "xaxis": { "buckets": null, "mode": "series", "name": null, "show": true, "values": [ "max" ] }, "yaxes": [ { "format": "kwatth", "label": null, "logBase": 1, "max": null, "min": null, "show": true }, { "format": "short", "label": null, "logBase": 1, "max": null, "min": null, "show": false } ], "yaxis": { "align": false, "alignLevel": null } }, { "aliasColors": { "Erzeugung": "rgb(63, 255, 0)" }, "bars": false, "dashLength": 10, "dashes": false, "datasource": null, "fill": 1, "fillGradient": 5, "gridPos": { "h": 7, "w": 7, "x": 7, "y": 7 }, "hiddenSeries": false, "hideTimeOverride": true, "id": 26, "legend": { "avg": false, "current": true, "max": true, "min": false, "show": true, "total": false, "values": true }, "lines": true, "linewidth": 1, "nullPointMode": "connected", "options": { "dataLinks": [] }, "percentage": false, "pointradius": 2, "points": false, "renderer": "flot", "seriesOverrides": [], "spaceLength": 10, "stack": false, "steppedLine": false, "targets": [ { "alias": "Erzeugung", "groupBy": [ { "params": [ "$__interval" ], "type": "time" }, { "params": [ "0" ], "type": "fill" } ], "measurement": "fronius.0.inverter.1.PAC", "orderByTime": "ASC", "policy": "default", "refId": "A", "resultFormat": "time_series", "select": [ [ { "params": [ "value" ], "type": "field" }, { "params": [], "type": "mean" } ] ], "tags": [] } ], "thresholds": [], "timeFrom": "24h", "timeRegions": [], "timeShift": null, "title": "Photovoltaik Erzeugung 24 Stunden", "tooltip": { "shared": true, "sort": 0, "value_type": "individual" }, "transparent": true, "type": "graph", "xaxis": { "buckets": null, "mode": "time", "name": null, "show": true, "values": [] }, "yaxes": [ { "format": "watth", "label": null, "logBase": 1, "max": null, "min": null, "show": true }, { "format": "short", "label": null, "logBase": 1, "max": null, "min": null, "show": false } ], "yaxis": { "align": false, "alignLevel": null } }, { "aliasColors": { "AKTUELLER_VERBRAUCH.mean": "dark-red", "Aktuelle Erzeugung": "rgb(0, 114, 255)", "Aktuelle Lieferung": "rgb(26, 255, 0)", "Aktueller Verbrauch": "rgb(255, 0, 27)" }, "bars": false, "dashLength": 10, "dashes": false, "datasource": null, "decimals": 2, "fill": 5, "fillGradient": 0, "gridPos": { "h": 7, "w": 7, "x": 14, "y": 7 }, "hiddenSeries": false, "hideTimeOverride": true, "id": 2, "legend": { "alignAsTable": false, "avg": false, "current": true, "hideEmpty": false, "hideZero": false, "max": true, "min": false, "rightSide": false, "show": true, "total": false, "values": true }, "lines": true, "linewidth": 1, "nullPointMode": "connected", "options": { "dataLinks": [] }, "percentage": false, "pointradius": 2, "points": false, "renderer": "flot", "seriesOverrides": [], "spaceLength": 10, "stack": false, "steppedLine": false, "targets": [ { "alias": "Aktuelle Lieferung", "groupBy": [ { "params": [ "$__interval" ], "type": "time" }, { "params": [ "previous" ], "type": "fill" } ], "measurement": "AKTUELLE_LIEFERUNG", "orderByTime": "ASC", "policy": "default", "refId": "A", "resultFormat": "time_series", "select": [ [ { "params": [ "value" ], "type": "field" }, { "params": [], "type": "last" } ] ], "tags": [] }, { "alias": "Aktueller Verbrauch", "groupBy": [ { "params": [ "$__interval" ], "type": "time" }, { "params": [ "previous" ], "type": "fill" } ], "measurement": "AKTUELLER_VERBRAUCH", "orderByTime": "ASC", "policy": "default", "refId": "B", "resultFormat": "time_series", "select": [ [ { "params": [ "value" ], "type": "field" }, { "params": [], "type": "last" } ] ], "tags": [] }, { "alias": "Aktuelle Erzeugung", "groupBy": [ { "params": [ "$__interval" ], "type": "time" }, { "params": [ "previous" ], "type": "fill" } ], "measurement": "fronius.0.inverter.1.PAC", "orderByTime": "ASC", "policy": "default", "refId": "C", "resultFormat": "time_series", "select": [ [ { "params": [ "value" ], "type": "field" }, { "params": [], "type": "last" } ] ], "tags": [] } ], "thresholds": [], "timeFrom": "24h", "timeRegions": [], "timeShift": null, "title": "Strom Verbrauch/Lieferung/Erzeugung 24 Stunden", "tooltip": { "shared": true, "sort": 0, "value_type": "individual" }, "transparent": true, "type": "graph", "xaxis": { "buckets": null, "mode": "time", "name": null, "show": true, "values": [] }, "yaxes": [ { "decimals": null, "format": "watth", "label": null, "logBase": 1, "max": null, "min": "0", "show": true }, { "decimals": null, "format": "watt", "label": null, "logBase": 1, "max": null, "min": "0", "show": false } ], "yaxis": { "align": false, "alignLevel": 0 } }, { "aliasColors": { "Verbrauch": "rgb(29, 255, 0)" }, "bars": false, "dashLength": 10, "dashes": false, "datasource": null, "fill": 5, "fillGradient": 10, "gridPos": { "h": 7, "w": 7, "x": 0, "y": 14 }, "hiddenSeries": false, "hideTimeOverride": true, "id": 22, "legend": { "alignAsTable": false, "avg": false, "current": true, "max": false, "min": false, "show": true, "total": false, "values": true }, "lines": true, "linewidth": 1, "nullPointMode": "connected", "options": { "dataLinks": [] }, "percentage": false, "pointradius": 2, "points": false, "renderer": "flot", "seriesOverrides": [], "spaceLength": 10, "stack": false, "steppedLine": false, "targets": [ { "alias": "Verbrauch", "groupBy": [ { "params": [ "$__interval" ], "type": "time" }, { "params": [ "null" ], "type": "fill" } ], "measurement": "Serverschrank_aktuell", "orderByTime": "ASC", "policy": "default", "refId": "A", "resultFormat": "time_series", "select": [ [ { "params": [ "value" ], "type": "field" }, { "params": [], "type": "mean" } ] ], "tags": [] } ], "thresholds": [], "timeFrom": "now/d", "timeRegions": [], "timeShift": null, "title": "Serverschrank aktuell", "tooltip": { "shared": true, "sort": 0, "value_type": "individual" }, "transparent": true, "type": "graph", "xaxis": { "buckets": null, "mode": "time", "name": null, "show": true, "values": [] }, "yaxes": [ { "format": "watt", "label": "", "logBase": 1, "max": null, "min": null, "show": true }, { "format": "short", "label": null, "logBase": 1, "max": null, "min": null, "show": false } ], "yaxis": { "align": false, "alignLevel": null } }, { "aliasColors": { "Aquarium_aktuell.mean": "rgb(60, 255, 0)", "Verbrauch": "rgb(59, 255, 0)" }, "bars": false, "dashLength": 10, "dashes": false, "datasource": null, "fill": 5, "fillGradient": 10, "gridPos": { "h": 7, "w": 7, "x": 7, "y": 14 }, "hiddenSeries": false, "hideTimeOverride": true, "id": 18, "interval": "", "legend": { "alignAsTable": false, "avg": false, "current": true, "hideEmpty": false, "hideZero": false, "max": true, "min": true, "show": true, "total": false, "values": true }, "lines": true, "linewidth": 1, "nullPointMode": "connected", "options": { "dataLinks": [] }, "percentage": false, "pointradius": 2, "points": false, "renderer": "flot", "repeat": null, "seriesOverrides": [], "spaceLength": 10, "stack": false, "steppedLine": false, "targets": [ { "alias": "Verbrauch", "groupBy": [ { "params": [ "$__interval" ], "type": "time" }, { "params": [ "null" ], "type": "fill" } ], "measurement": "Aquarium_aktuell", "orderByTime": "ASC", "policy": "default", "refId": "A", "resultFormat": "time_series", "select": [ [ { "params": [ "value" ], "type": "field" }, { "params": [], "type": "mean" } ] ], "tags": [] } ], "thresholds": [], "timeFrom": "now/d", "timeRegions": [], "timeShift": null, "title": "Aquarium aktuell", "tooltip": { "shared": true, "sort": 0, "value_type": "individual" }, "transparent": true, "type": "graph", "xaxis": { "buckets": null, "mode": "time", "name": null, "show": true, "values": [] }, "yaxes": [ { "decimals": null, "format": "watt", "label": "", "logBase": 1, "max": null, "min": null, "show": true }, { "format": "short", "label": null, "logBase": 1, "max": null, "min": null, "show": false } ], "yaxis": { "align": false, "alignLevel": null } }, { "aliasColors": { "aktuell": "rgb(29, 255, 0)" }, "bars": false, "dashLength": 10, "dashes": false, "datasource": null, "fill": 5, "fillGradient": 10, "gridPos": { "h": 7, "w": 7, "x": 14, "y": 14 }, "hiddenSeries": false, "hideTimeOverride": true, "id": 14, "legend": { "alignAsTable": false, "avg": false, "current": true, "hideEmpty": false, "hideZero": false, "max": true, "min": true, "show": true, "total": false, "values": true }, "lines": true, "linewidth": 1, "nullPointMode": "connected", "options": { "dataLinks": [] }, "percentage": false, "pointradius": 2, "points": false, "renderer": "flot", "seriesOverrides": [], "spaceLength": 10, "stack": false, "steppedLine": false, "targets": [ { "alias": "aktuell", "groupBy": [ { "params": [ "$__interval" ], "type": "time" }, { "params": [ "null" ], "type": "fill" } ], "measurement": "PC_aktuell", "orderByTime": "ASC", "policy": "default", "refId": "A", "resultFormat": "time_series", "select": [ [ { "params": [ "value" ], "type": "field" }, { "params": [], "type": "mean" } ] ], "tags": [] } ], "thresholds": [], "timeFrom": "now/d", "timeRegions": [], "timeShift": null, "title": "PC aktuell", "tooltip": { "shared": true, "sort": 0, "value_type": "individual" }, "transparent": true, "type": "graph", "xaxis": { "buckets": null, "mode": "time", "name": null, "show": true, "values": [] }, "yaxes": [ { "format": "watt", "label": null, "logBase": 1, "max": null, "min": null, "show": true }, { "format": "short", "label": null, "logBase": 1, "max": null, "min": null, "show": false } ], "yaxis": { "align": false, "alignLevel": null } }, { "aliasColors": { "Aussentemperatur": "rgb(0, 100, 255)", "Temperatur_aussen_aktuell.mean": "rgb(23, 0, 255)" }, "bars": false, "dashLength": 10, "dashes": false, "datasource": null, "decimals": 2, "description": "", "fill": 5, "fillGradient": 10, "gridPos": { "h": 7, "w": 7, "x": 0, "y": 21 }, "hiddenSeries": false, "hideTimeOverride": true, "id": 12, "legend": { "alignAsTable": false, "avg": false, "current": true, "max": true, "min": true, "show": true, "total": false, "values": true }, "lines": true, "linewidth": 1, "nullPointMode": "connected", "options": { "dataLinks": [] }, "percentage": false, "pointradius": 2, "points": false, "renderer": "flot", "seriesOverrides": [], "spaceLength": 10, "stack": false, "steppedLine": false, "targets": [ { "alias": "Aussentemperatur", "groupBy": [ { "params": [ "$__interval" ], "type": "time" }, { "params": [ "null" ], "type": "fill" } ], "measurement": "Aussentemp-Keller", "orderByTime": "ASC", "policy": "default", "refId": "A", "resultFormat": "time_series", "select": [ [ { "params": [ "value" ], "type": "field" }, { "params": [], "type": "mean" } ] ], "tags": [] } ], "thresholds": [], "timeFrom": "24h", "timeRegions": [], "timeShift": null, "title": "Aussentemperatur", "tooltip": { "shared": true, "sort": 0, "value_type": "individual" }, "transparent": true, "type": "graph", "xaxis": { "buckets": null, "mode": "time", "name": null, "show": true, "values": [] }, "yaxes": [ { "decimals": null, "format": "celsius", "label": null, "logBase": 1, "max": null, "min": null, "show": true }, { "format": "short", "label": null, "logBase": 1, "max": null, "min": null, "show": false } ], "yaxis": { "align": false, "alignLevel": null } }, { "aliasColors": { "Bad": "rgb(64, 255, 0)", "Kinderzimmer": "rgb(255, 0, 4)", "Temperatur_Bad.mean": "rgb(65, 255, 0)", "Temperatur_KiZi.mean": "rgb(255, 183, 0)", "Temperatur_WoZi.mean": "rgb(0, 218, 255)", "Wohnzimmer": "rgb(0, 218, 255)" }, "bars": false, "dashLength": 10, "dashes": false, "datasource": null, "decimals": 2, "fill": 5, "fillGradient": 10, "gridPos": { "h": 7, "w": 7, "x": 7, "y": 21 }, "hiddenSeries": false, "hideTimeOverride": true, "id": 10, "legend": { "alignAsTable": false, "avg": false, "current": false, "hideEmpty": false, "hideZero": false, "max": false, "min": false, "show": true, "total": false, "values": false }, "lines": true, "linewidth": 1, "nullPointMode": "connected", "options": { "dataLinks": [] }, "percentage": false, "pointradius": 2, "points": false, "renderer": "flot", "seriesOverrides": [], "spaceLength": 10, "stack": false, "steppedLine": false, "targets": [ { "alias": "Bad", "groupBy": [ { "params": [ "$__interval" ], "type": "time" }, { "params": [ "null" ], "type": "fill" } ], "measurement": "Temperatur_Bad", "orderByTime": "ASC", "policy": "default", "refId": "A", "resultFormat": "time_series", "select": [ [ { "params": [ "value" ], "type": "field" }, { "params": [], "type": "mean" } ] ], "tags": [] }, { "alias": "Kinderzimmer", "groupBy": [ { "params": [ "$__interval" ], "type": "time" }, { "params": [ "null" ], "type": "fill" } ], "measurement": "Temperatur_KiZi", "orderByTime": "ASC", "policy": "default", "refId": "B", "resultFormat": "time_series", "select": [ [ { "params": [ "value" ], "type": "field" }, { "params": [], "type": "mean" } ] ], "tags": [] }, { "alias": "Wohnzimmer", "groupBy": [ { "params": [ "$__interval" ], "type": "time" }, { "params": [ "null" ], "type": "fill" } ], "measurement": "Temperatur_WoZi", "orderByTime": "ASC", "policy": "default", "refId": "C", "resultFormat": "time_series", "select": [ [ { "params": [ "value" ], "type": "field" }, { "params": [], "type": "mean" } ] ], "tags": [] } ], "thresholds": [], "timeFrom": "24h", "timeRegions": [], "timeShift": null, "title": "Zimmertemperatur", "tooltip": { "shared": true, "sort": 0, "value_type": "individual" }, "transparent": true, "type": "graph", "xaxis": { "buckets": null, "mode": "time", "name": null, "show": true, "values": [] }, "yaxes": [ { "decimals": 2, "format": "celsius", "label": null, "logBase": 1, "max": null, "min": null, "show": true }, { "format": "short", "label": null, "logBase": 1, "max": null, "min": null, "show": false } ], "yaxis": { "align": true, "alignLevel": 0 } }, { "aliasColors": { "Download": "rgb(63, 255, 0)", "Upload": "rgb(255, 0, 23)", "Webspeedy Download.mean": "rgb(58, 255, 0)" }, "bars": false, "dashLength": 10, "dashes": false, "datasource": null, "fill": 5, "fillGradient": 0, "gridPos": { "h": 7, "w": 7, "x": 14, "y": 21 }, "hiddenSeries": false, "id": 6, "legend": { "alignAsTable": false, "avg": false, "current": false, "max": true, "min": true, "show": true, "total": false, "values": true }, "lines": true, "linewidth": 1, "nullPointMode": "connected", "options": { "dataLinks": [] }, "percentage": false, "pointradius": 2, "points": false, "renderer": "flot", "seriesOverrides": [], "spaceLength": 10, "stack": false, "steppedLine": false, "targets": [ { "alias": "Download", "groupBy": [ { "params": [ "$__interval" ], "type": "time" }, { "params": [ "null" ], "type": "fill" } ], "measurement": "Webspeedy Download", "orderByTime": "ASC", "policy": "default", "refId": "A", "resultFormat": "time_series", "select": [ [ { "params": [ "value" ], "type": "field" }, { "params": [], "type": "last" } ] ], "tags": [] }, { "alias": "Upload", "groupBy": [ { "params": [ "$__interval" ], "type": "time" }, { "params": [ "null" ], "type": "fill" } ], "measurement": "Webspeedy Upload", "orderByTime": "ASC", "policy": "default", "refId": "B", "resultFormat": "time_series", "select": [ [ { "params": [ "value" ], "type": "field" }, { "params": [], "type": "last" } ] ], "tags": [] } ], "thresholds": [], "timeFrom": "24h", "timeRegions": [], "timeShift": null, "title": "Speedtest", "tooltip": { "shared": true, "sort": 0, "value_type": "individual" }, "transparent": true, "type": "graph", "xaxis": { "buckets": null, "mode": "time", "name": null, "show": true, "values": [] }, "yaxes": [ { "decimals": 2, "format": "Mbits", "label": "", "logBase": 1, "max": null, "min": "0", "show": true }, { "format": "short", "label": null, "logBase": 1, "max": null, "min": null, "show": false } ], "yaxis": { "align": true, "alignLevel": 0 } } ], "refresh": "1m", "schemaVersion": 22, "style": "dark", "tags": [], "templating": { "list": [] }, "time": { "from": "now-24h", "to": "now" }, "timepicker": { "refresh_intervals": [ "5s", "10s", "30s", "1m", "5m", "15m", "30m", "1h", "2h", "1d" ] }, "timezone": "", "title": "Allgemein", "uid": "XMW0dj_Wz", "version": 119 }@Negalein Dankeschön, super, hat funktioniert!
Du verwendest den Sourceanalytix Adapter dazu, der legt die Tage an, so gehts.. ich verwende immer noch das olle Javascript mit der Verbrauchsmessung ( das erste, was damals so umherging..) :-) -
@Negalein Dankeschön, super, hat funktioniert!
Du verwendest den Sourceanalytix Adapter dazu, der legt die Tage an, so gehts.. ich verwende immer noch das olle Javascript mit der Verbrauchsmessung ( das erste, was damals so umherging..) :-)@ilovegym sagte in VIS von Sigi234:
Dankeschön, super, hat funktioniert!
freut mich
Du verwendest den Sourceanalytix Adapter dazu, der legt die Tage an, so gehts.. ich verwende immer noch das olle Javascript mit der Verbrauchsmessung ( das erste, was damals so umherging..) 🙂
Ja, aber noch in Version 0.3.0
Die 0.4.x läuft noch nicht so rund. -
Hallo, ich würde auch gerne meinen Stromverbrauch darstellen. Meinen Zähler lese ich mit dem Weidmann Lesekopf aus und bekomme ihn über die Smartmeter App in IO Broker. Leider bekomme ich nur die Linie mit dem absoluten Zählerstand. Zusätzlich habe ich den History Adapter installiert und die Linie aus dem Smartmeter hinzugefügt. Jetzt würde ich das gerne als Grafik bzw. auch als Stände darstellen .
Irgendwie bekomme ich bei Sourceanalytics keine Tagesstände. Und die Wochenstände passen nicht.
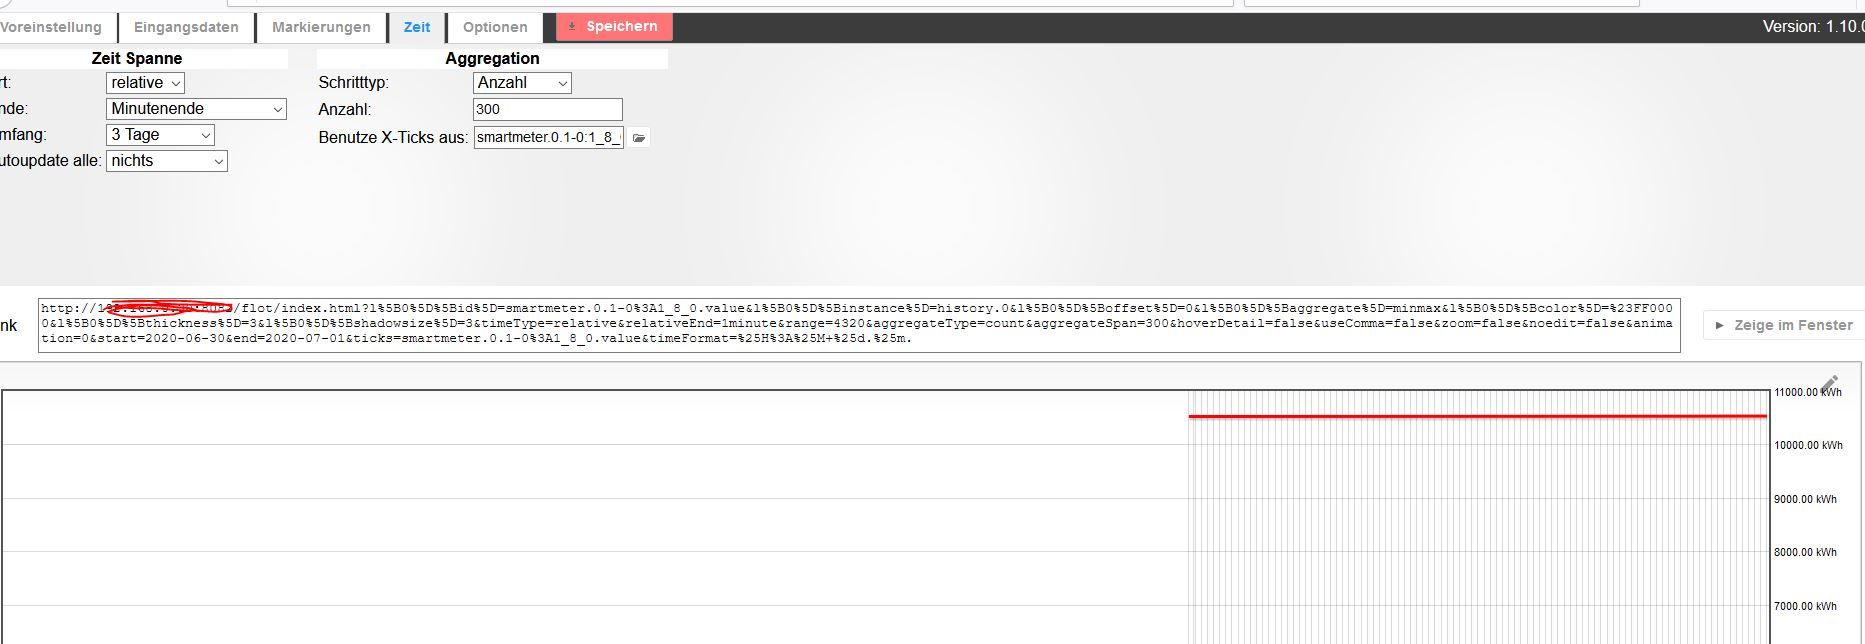
Beim Darstellen in Flot bekomme ich aber nur eine durchgängige Linie, weil ich logischerweise den Gesamt Zählerstand habe.
=:( kann ich die Sourceanalytics 0.3.0 noch irgendwo bekommen, wenn diese funktioniert hat oder gibt es eine alternative ? Kann ich auch Werte aus History darstellen ? Was muss ich machen, damit ich in Flot vernünftig darstellen kann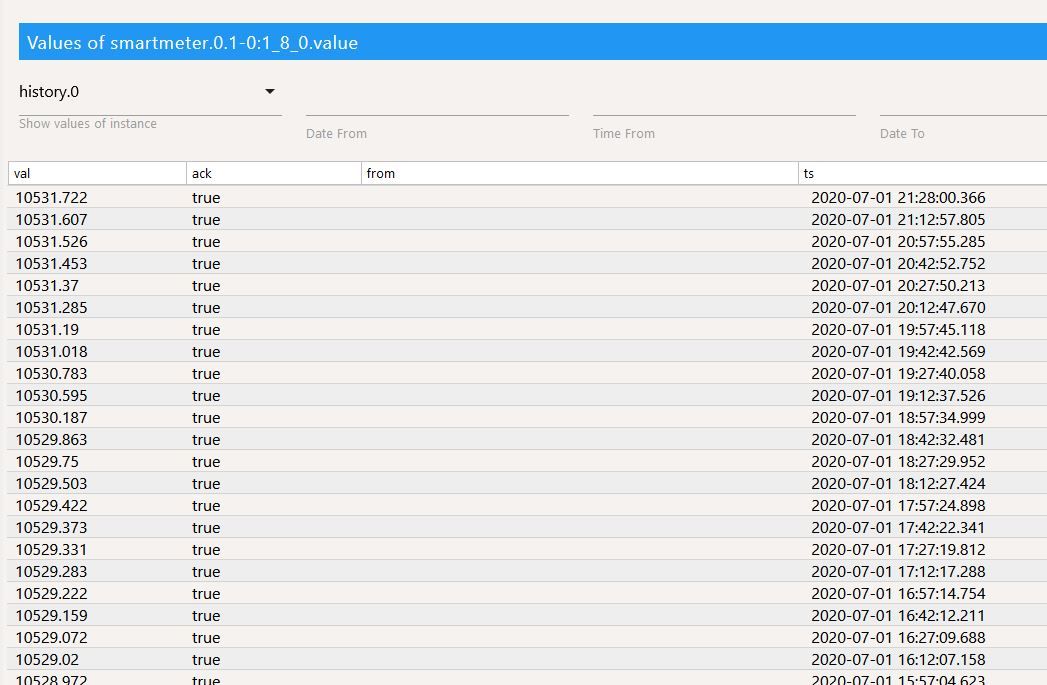
Hey! Du scheinst an dieser Unterhaltung interessiert zu sein, hast aber noch kein Konto.
Hast du es satt, bei jedem Besuch durch die gleichen Beiträge zu scrollen? Wenn du dich für ein Konto anmeldest, kommst du immer genau dorthin zurück, wo du zuvor warst, und kannst dich über neue Antworten benachrichtigen lassen (entweder per E-Mail oder Push-Benachrichtigung). Du kannst auch Lesezeichen speichern und Beiträge positiv bewerten, um anderen Community-Mitgliedern deine Wertschätzung zu zeigen.
Mit deinem Input könnte dieser Beitrag noch besser werden 💗
Registrieren AnmeldenSupport us
426
Online33.0k
Benutzer83.5k
Themen1.3m
Beiträge