

Grafana iFrame in VIS
-
also ich bekommen es einfach nicht hin.
weder als html noch iframe....also wenn ich im browser diesen Link eingebe, dann bekomme ich die gewünschte Anzeige zu sehen :
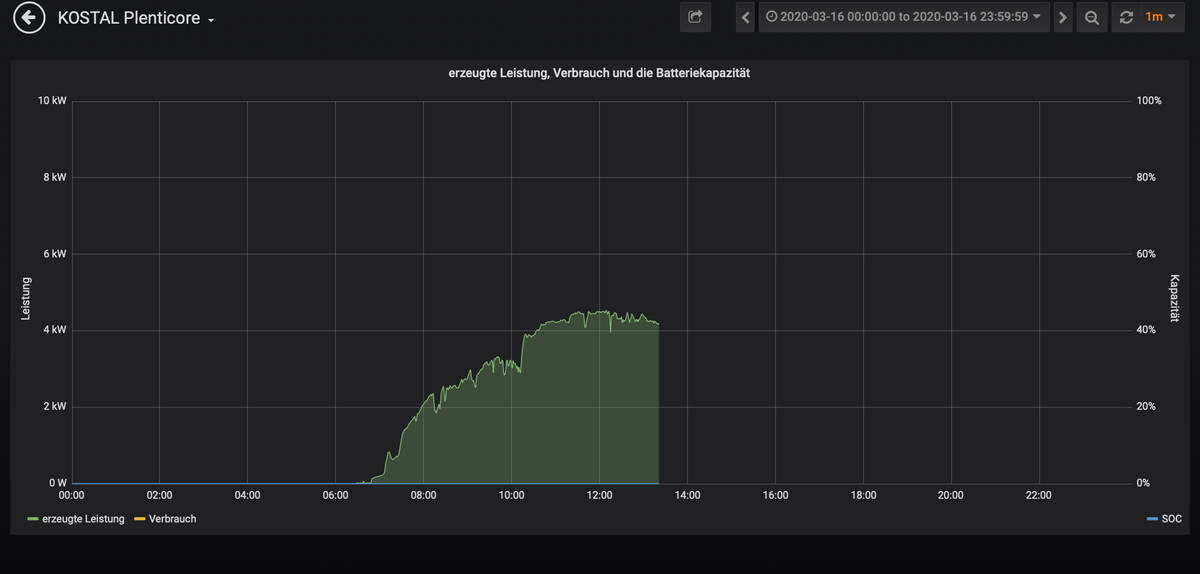
allerdings in VIS ist alles leer ?
Was mache ich falsch ?
oder wie geht es richtig ?
Kann mir jemand ein widget exportieren ? Welches funktioniert und ich nur noch die URL anpassen muss ?
les dir das mal durch ich musste am anfang auch lang rumkämpfen...
https://forum.iobroker.net/topic/23270/gelöst-grafana-diagramm-in-vis-einfügen
hast du das gemacht?
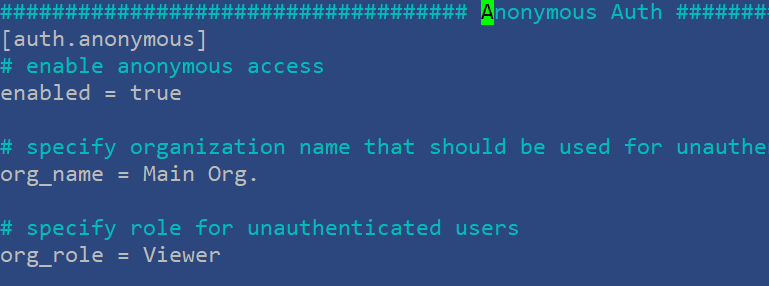
[auth.anonymous] enabled = true # Organization name that should be used for unauthenticated users org_name = Main Org. # Role for unauthenticated users, other valid values are `Editor` and `Admin` org_role = Viewer -
les dir das mal durch ich musste am anfang auch lang rumkämpfen...
https://forum.iobroker.net/topic/23270/gelöst-grafana-diagramm-in-vis-einfügen
hast du das gemacht?
[auth.anonymous] enabled = true # Organization name that should be used for unauthenticated users org_name = Main Org. # Role for unauthenticated users, other valid values are `Editor` and `Admin` org_role = Viewer@saeft_2003 wie lautet der Pfad zu der ini Datei ?
sudo nano -w /var/www/html/grafana.ini
geht nicht..., sorry für die dumme Frage, bin pi und linux Anfänger ( schlechte Kombi ich weis ;-) )
-
@saeft_2003 wie lautet der Pfad zu der ini Datei ?
sudo nano -w /var/www/html/grafana.ini
geht nicht..., sorry für die dumme Frage, bin pi und linux Anfänger ( schlechte Kombi ich weis ;-) )
-
@saeft_2003 wie lautet der Pfad zu der ini Datei ?
sudo nano -w /var/www/html/grafana.ini
geht nicht..., sorry für die dumme Frage, bin pi und linux Anfänger ( schlechte Kombi ich weis ;-) )
sudo nano /etc/grafana/grafana.ini
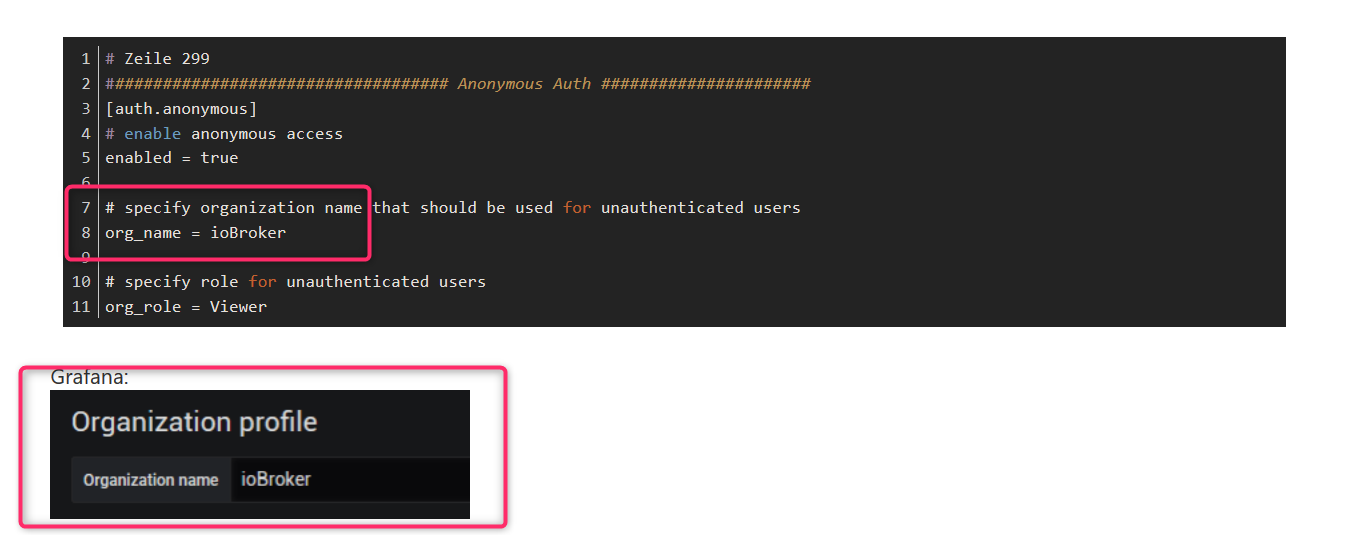
## Zeile 186
## set to true if you want to allow browsers to render Grafana in a <frame>, <iframe>, <embed> or <object>. default is false.
allow_embedding = true
# Zeile 232 #################################### Users ############################### [users] # disable user signup / registration allow_sign_up = false# Zeile 299 #################################### Anonymous Auth ###################### [auth.anonymous] # enable anonymous access enabled = true # specify organization name that should be used for unauthenticated users org_name = ioBroker # specify role for unauthenticated users org_role = ViewerGrafana:
-
Hallo Gemeinde,
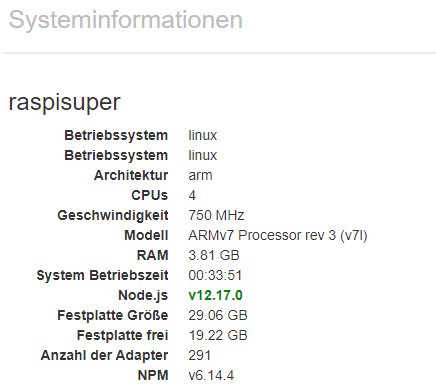
Ich muss hier mal einhaken, ich habe in den letzten beiden Tagen influxdb und grafana auf einem zweiten Pi installiert und in Iobroker integriert (influxdb-Adapter), soweit läuft alles. Nur ins VIS bekomme ich mein Dashboard nicht. Ich habe alle Tips hier im Thread abgearbeitet (mehrmals) Bringe jedoch keine anzeige im VIS zustande.
Jedoch eine Spur habe ich:
Das Iframe Dialog Widget bringt mir den Anmeldedialog des Grafana-Servers ins Vis. Anmeldung funktioniert jedoch trotz korrekten Passwortes nicht (oder nur kurz - es wird kein Dashboard aufgerufen)
Ich bin nun mit meinem Latein am Ende.
Könnt ihr mir helfen ?Grüße,
TorstenMein iobroker Server ist aktuell (Default Repository)
-
Hallo Gemeinde,
Ich muss hier mal einhaken, ich habe in den letzten beiden Tagen influxdb und grafana auf einem zweiten Pi installiert und in Iobroker integriert (influxdb-Adapter), soweit läuft alles. Nur ins VIS bekomme ich mein Dashboard nicht. Ich habe alle Tips hier im Thread abgearbeitet (mehrmals) Bringe jedoch keine anzeige im VIS zustande.
Jedoch eine Spur habe ich:
Das Iframe Dialog Widget bringt mir den Anmeldedialog des Grafana-Servers ins Vis. Anmeldung funktioniert jedoch trotz korrekten Passwortes nicht (oder nur kurz - es wird kein Dashboard aufgerufen)
Ich bin nun mit meinem Latein am Ende.
Könnt ihr mir helfen ?Grüße,
TorstenMein iobroker Server ist aktuell (Default Repository)
@crepp1967 du brauchst kein psw..
hast du im grafana den anonymous freigeschaltet ?
zigbee hab ich, zwave auch, nuc's genauso und HA auch
-
@crepp1967 du brauchst kein psw..
hast du im grafana den anonymous freigeschaltet ?
-
@crepp1967 mal so nebenbei....verwendest du das auch so? Main Org.??
-
hauptsache hier steht das gleiche. ich musste es aber auch einmal ändern das es funktioniert hat...
-
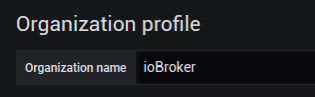
@crepp1967 naja Main Org. ist ja nur ein Beispiel, man kann da reinschreiben was man möchte. Sollte nur dann in Grafana übereinstimmen.
Zu finden bei Einstellungen -->Preferences-->Organization name -
Jetzt funktioniert es, es ist halt wie immer, kaum macht man es richtig, geht's ...

Es war ein Denkfehler meinerseits, ich dachte die Grafana GUI übernimmt die Einstellungen in der ini-Datei...Eine Frage habe ich aber noch:
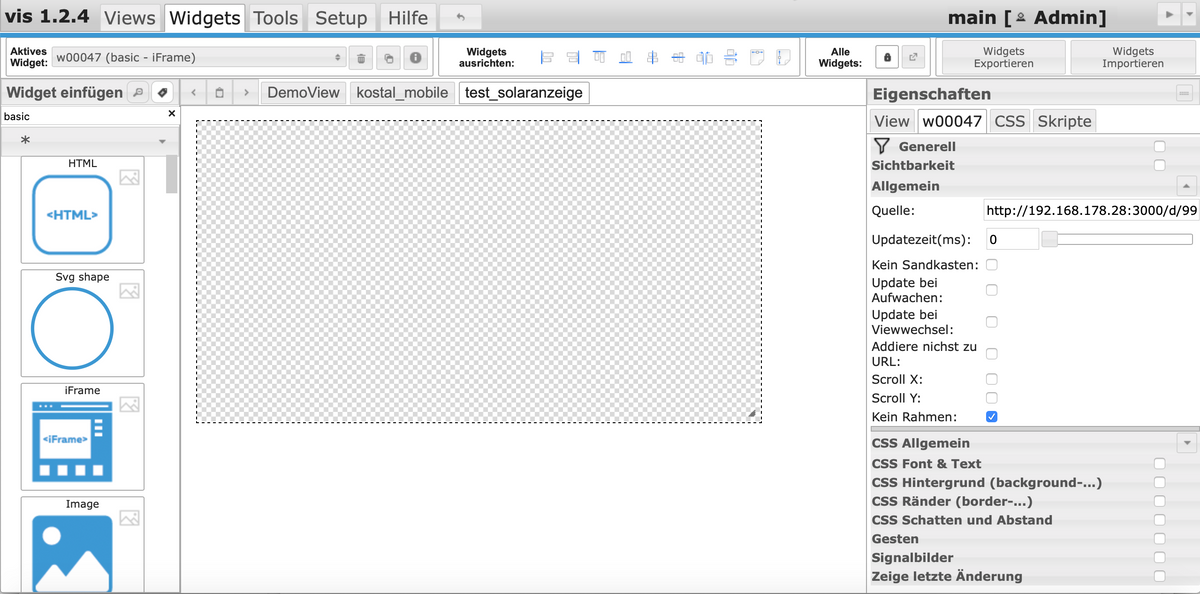
mit dem normalen iFrame-Widget sehe ich nichts, ich muss das iFrame Dialog-Widget nehmen, ganz unten in der Auswahl.Gruß Torsten
-
Jetzt funktioniert es, es ist halt wie immer, kaum macht man es richtig, geht's ...
Es war ein Denkfehler meinerseits, ich dachte die Grafana GUI übernimmt die Einstellungen in der ini-Datei...Eine Frage habe ich aber noch:
mit dem normalen iFrame-Widget sehe ich nichts, ich muss das iFrame Dialog-Widget nehmen, ganz unten in der Auswahl.Gruß Torsten
Das normale iframe geht bei mir ohne Probleme
-
Jetzt funktioniert es, es ist halt wie immer, kaum macht man es richtig, geht's ...
Es war ein Denkfehler meinerseits, ich dachte die Grafana GUI übernimmt die Einstellungen in der ini-Datei...Eine Frage habe ich aber noch:
mit dem normalen iFrame-Widget sehe ich nichts, ich muss das iFrame Dialog-Widget nehmen, ganz unten in der Auswahl.Gruß Torsten
@crepp1967 die ini ist für den Server der die Daten liefert.. die GUI ist halt nur die GUI
-
Das normale iframe geht bei mir ohne Probleme
oben der Dialog iFrame unten der normale iFrame
-
oben der Dialog iFrame unten der normale iFrame
Zeig mal die Quelle vom iframe da kommt nur der link rein...
-
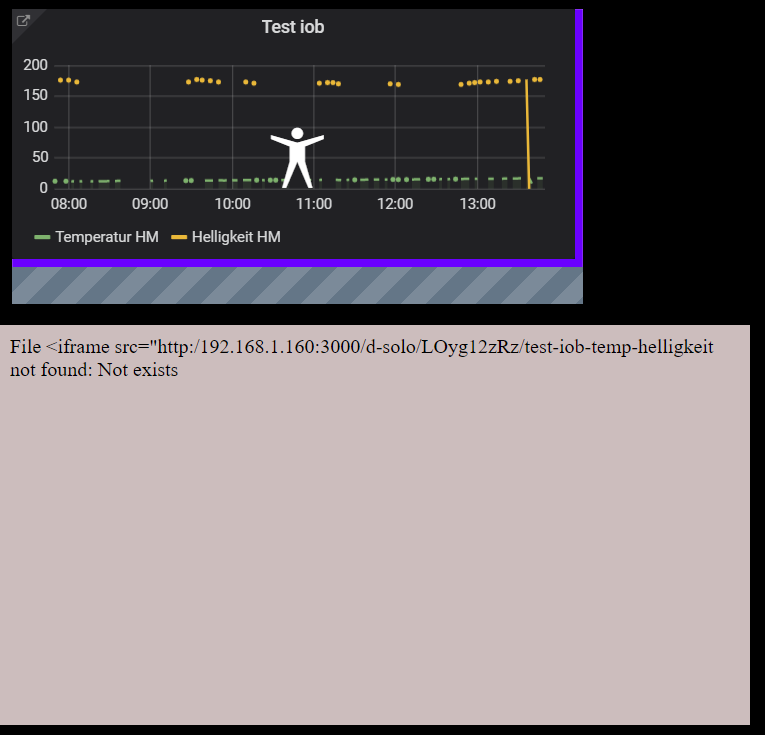
Hier die bei beiden widgets verwendete Quelle:
<iframe src="http://192.168.1.160:3000/d-solo/LOyg12zRz/test-iob-temp-helligkeit?orgId=1&panelId=2" width="450" height="200" frameborder="0"></iframe>
-
Hier die bei beiden widgets verwendete Quelle:
<iframe src="http://192.168.1.160:3000/d-solo/LOyg12zRz/test-iob-temp-helligkeit?orgId=1&panelId=2" width="450" height="200" frameborder="0"></iframe>
In das iframe kommt nur der http grafana link!
http://192.168.1.160:3000/d-solo/LOyg12zRz/test-iob-temp-helligkeit?orgId=1&panelId=2
-
Ich kämpfe nun auch schon eine Weile mit der Grafana Chart-Ansicht in VIS.
Die Settings für den enable anonymous access, org_name_org_role, allow_embedding habe ich nun alle schon mindestens 10 mal kontrolliert und den Grafana-Server neugestartet.
Der Org_Name in der Konfig ist gleich der in der WEBUI und wurde auch schon testweise mehrere male geändert.
Zugriff auf den Link eines gesharten Graphen "http://192.168.178.150:3000/d-solo/SUMXcb8Wz/smart-home-history?orgId=1&refresh=5s&panelId=3"per anderem Browser ohne den Admin-Logincookie klappt ohne Probleme und ohne Loginfenster.
Binde ich nun diesen Link im iFrame Widget in VIS ein, wird mir absolut garnichts angezeigt.
Ändere ich den Link ab auf "http://localhost:3000/d-solo/SUMXcb8Wz/smart-home-history?orgId=1&refresh=5s&panelId=3" oder "http://ubuntu-server:3000/d-solo/SUMXcb8Wz/smart-home-history?orgId=1&refresh=5s&panelId=3" wird mir angezeigt "Verbindung abgelehnt".localhost sollte ebenfalls klappen, da IOBroker und Grafana Server auf dem selben Host liegen.
Hat jemand noch eine Idee?
Hey! Du scheinst an dieser Unterhaltung interessiert zu sein, hast aber noch kein Konto.
Hast du es satt, bei jedem Besuch durch die gleichen Beiträge zu scrollen? Wenn du dich für ein Konto anmeldest, kommst du immer genau dorthin zurück, wo du zuvor warst, und kannst dich über neue Antworten benachrichtigen lassen (entweder per E-Mail oder Push-Benachrichtigung). Du kannst auch Lesezeichen speichern und Beiträge positiv bewerten, um anderen Community-Mitgliedern deine Wertschätzung zu zeigen.
Mit deinem Input könnte dieser Beitrag noch besser werden 💗
Registrieren AnmeldenSupport us
181
Online33.0k
Benutzer83.5k
Themen1.3m
Beiträge