

Diagramm mehrerer Datenpunkte ohne History
-
@sigi234 sagte in Diagramm mehrerer Datenpunkte ohne History:
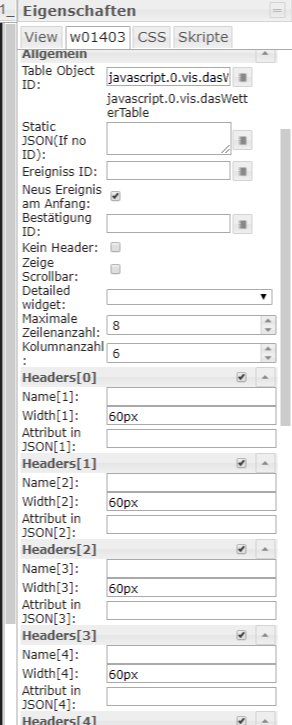
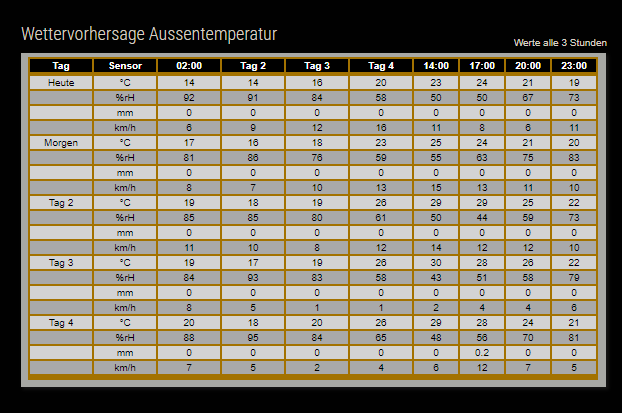
[{"tpl":"tplTableBody","data":{"g_fixed":true,"g_visibility":false,"g_css_font_text":true,"g_css_background":true,"g_css_shadow_padding":false,"g_css_border":false,"g_gestures":false,"g_signals":false,"g_last_change":false,"visibility-cond":"==","visibility-val":1,"visibility-groups-action":"hide","static_value":"","signals-cond-0":"==","signals-val-0":true,"signals-icon-0":"/vis/signals/lowbattery.png","signals-icon-size-0":0,"signals-blink-0":false,"signals-horz-0":0,"signals-vert-0":0,"signals-hide-edit-0":false,"signals-cond-1":"==","signals-val-1":true,"signals-icon-1":"/vis/signals/lowbattery.png","signals-icon-size-1":0,"signals-blink-1":false,"signals-horz-1":0,"signals-vert-1":0,"signals-hide-edit-1":false,"signals-cond-2":"==","signals-val-2":true,"signals-icon-2":"/vis/signals/lowbattery.png","signals-icon-size-2":0,"signals-blink-2":false,"signals-horz-2":0,"signals-vert-2":0,"signals-hide-edit-2":false,"lc-type":"last-change","lc-is-interval":true,"lc-is-moment":false,"lc-format":"","lc-position-vert":"top","lc-position-horz":"right","lc-offset-vert":0,"lc-offset-horz":0,"lc-font-size":"12px","lc-font-family":"","lc-font-style":"","lc-bkg-color":"","lc-color":"","lc-border-width":"0","lc-border-style":"","lc-border-color":"","lc-border-radius":10,"lc-zindex":0,"table_oid":"javascript.0.vis.dasWetterTable","max_rows":"8","colCount":"6","new_on_top":true,"colWidth1":"60px","colWidth2":"60px","colWidth3":"60px","colWidth4":"60px","colName2":"","colWidth5":"60px","colWidth6":"60px","class":""},"style":{"left":"32px","top":"320px","width":"571px","height":"204px","z-index":"5","text-align":"center","font-size":"medium","color":"","background-color":"","background":""},"widgetSet":"basic"}]Funktioniert nicht bei mir.
Ich hab keinen DP
javascript.0.vis.dasWetterTable
@Negalein sagte in Diagramm mehrerer Datenpunkte ohne History:
@sigi234 sagte in Diagramm mehrerer Datenpunkte ohne History:
Funktioniert nicht bei mir.
Ich hab keinen DP
javascript.0.vis.dasWetterTableDu brauchst das Skript von @paul53
var path    = "daswetter.0.NextDaysDetailed.Location_1."; // Pfad der String-Datenpunkte aus "list"
var idTable = "vis.dasWetterTable"; // Pfad des Datenpunkts für das vis-Json

// Datenpunkte anlegen
createState(idTable, "", {
  name: idTable,
  desc: 'Tabelle der Vorhersagewerte aus daswetter.com als Json-Objekt',
  type: 'string',
  unit: '',
  role: 'value'
});

function wetter() {
   var list = [];
   for(let i = 0; i < 8; i++) {
      list[i] = {};
      list[i].Zeit = getState(path + 'Day_1.Hour_' + (i + 1) + '.hour_value').val;
      list[i].Heute = getState(path + 'Day_1.Hour_' + (i + 1) + '.temp_value').val;
      list[i].Morgen = getState(path + 'Day_2.Hour_' + (i + 1) + '.temp_value').val;
      list[i].Tag_2 = getState(path + 'Day_3.Hour_' + (i + 1) + '.temp_value').val;
      list[i].Tag_3 = getState(path + 'Day_4.Hour_' + (i + 1) + '.temp_value').val;
      list[i].Tag_4 = getState(path + 'Day_5.Hour_' + (i + 1) + '.temp_value').val;
   }
   var json = JSON.stringify(list);
   // log(json);
   setState(idTable, json, true);
}

// Trigger
schedule('10 */15 * * * *', wetter);
Bitte benutzt das Voting rechts unten im Beitrag wenn er euch geholfen hat.
Immer Daten sichern! -
@Negalein sagte in Diagramm mehrerer Datenpunkte ohne History:
@sigi234 sagte in Diagramm mehrerer Datenpunkte ohne History:
Funktioniert nicht bei mir.
Ich hab keinen DP
javascript.0.vis.dasWetterTableDu brauchst das Skript von @paul53
var path = "daswetter.0.NextDaysDetailed.Location_1."; // Pfad der String-Datenpunkte aus "list" var idTable = "vis.dasWetterTable"; // Pfad des Datenpunkts für das vis-Json // Datenpunkte anlegen createState(idTable, "", { name: idTable, desc: 'Tabelle der Vorhersagewerte aus daswetter.com als Json-Objekt', type: 'string', unit: '', role: 'value' }); function wetter() { var list = []; for(let i = 0; i < 8; i++) { list[i] = {}; list[i].Zeit = getState(path + 'Day_1.Hour_' + (i + 1) + '.hour_value').val; list[i].Heute = getState(path + 'Day_1.Hour_' + (i + 1) + '.temp_value').val; list[i].Morgen = getState(path + 'Day_2.Hour_' + (i + 1) + '.temp_value').val; list[i].Tag_2 = getState(path + 'Day_3.Hour_' + (i + 1) + '.temp_value').val; list[i].Tag_3 = getState(path + 'Day_4.Hour_' + (i + 1) + '.temp_value').val; list[i].Tag_4 = getState(path + 'Day_5.Hour_' + (i + 1) + '.temp_value').val; } var json = JSON.stringify(list); // log(json); setState(idTable, json, true); } // Trigger schedule('10 */15 * * * *', wetter); -
Hast du die Zeile für die Einheiten (°C, km/h, %, mm) schon eingefügt?
Wo gehört das im Script von @paul53 eingetragen?° Node.js & System Update ---> sudo apt update, iob stop, sudo apt full-upgrade
° Node.js Fixer ---> iob nodejs-update
° Fixer ---> iob fix -
@Negalein sagte:
Wo gehört das im Script von @paul53 eingetragen?
Das Skript liefert nur die Temperaturwerte. Mit °C:
      list[i].Heute = getState(path + 'Day_1.Hour_' + (i + 1) + '.temp_value').val + ' °C';
      list[i].Morgen = getState(path + 'Day_2.Hour_' + (i + 1) + '.temp_value').val + ' °C';
      list[i].Tag_2 = getState(path + 'Day_3.Hour_' + (i + 1) + '.temp_value').val + ' °C';
      list[i].Tag_3 = getState(path + 'Day_4.Hour_' + (i + 1) + '.temp_value').val + ' °C';
      list[i].Tag_4 = getState(path + 'Day_5.Hour_' + (i + 1) + '.temp_value').val + ' °C';
Bitte verzichtet auf Chat-Nachrichten, denn die Handhabung ist grauenhaft !
Produktiv: Asus PN 42 / N100 / 8 GB / 500 GB; Proxmox mit 2 VM (iob / openCCU) -
@Negalein sagte:
Wo gehört das im Script von @paul53 eingetragen?
Das Skript liefert nur die Temperaturwerte. Mit °C:
list[i].Heute = getState(path + 'Day_1.Hour_' + (i + 1) + '.temp_value').val + ' °C'; list[i].Morgen = getState(path + 'Day_2.Hour_' + (i + 1) + '.temp_value').val + ' °C'; list[i].Tag_2 = getState(path + 'Day_3.Hour_' + (i + 1) + '.temp_value').val + ' °C'; list[i].Tag_3 = getState(path + 'Day_4.Hour_' + (i + 1) + '.temp_value').val + ' °C'; list[i].Tag_4 = getState(path + 'Day_5.Hour_' + (i + 1) + '.temp_value').val + ' °C';@paul53 sagte in Diagramm mehrerer Datenpunkte ohne History:
@Negalein sagte:
Wo gehört das im Script von @paul53 eingetragen?
Das Skript liefert nur die Temperaturwerte. Mit °C:
Könnte man das auf die anderen Werte noch erweitern?
° Node.js & System Update ---> sudo apt update, iob stop, sudo apt full-upgrade
° Node.js Fixer ---> iob nodejs-update
° Fixer ---> iob fix -
@paul53 sagte in Diagramm mehrerer Datenpunkte ohne History:
@Negalein sagte:
Wo gehört das im Script von @paul53 eingetragen?
Das Skript liefert nur die Temperaturwerte. Mit °C:
Könnte man das auf die anderen Werte noch erweitern?
@Negalein sagte:
Könnte man das auf die anderen Werte noch erweitern?
Wie soll die Tabelle dann aussehen ? Oder mehrere Tabellen ?
Bitte verzichtet auf Chat-Nachrichten, denn die Handhabung ist grauenhaft !
Produktiv: Asus PN 42 / N100 / 8 GB / 500 GB; Proxmox mit 2 VM (iob / openCCU) -
@Negalein sagte:
Könnte man das auf die anderen Werte noch erweitern?
Wie soll die Tabelle dann aussehen ? Oder mehrere Tabellen ?
@paul53 sagte in Diagramm mehrerer Datenpunkte ohne History:
@Negalein sagte:
Könnte man das auf die anderen Werte noch erweitern?
Wie soll die Tabelle dann aussehen ? Oder mehrere Tabellen ?
° Node.js & System Update ---> sudo apt update, iob stop, sudo apt full-upgrade
° Node.js Fixer ---> iob nodejs-update
° Fixer ---> iob fix -
@paul53 sagte in Diagramm mehrerer Datenpunkte ohne History:
@Negalein sagte:
Könnte man das auf die anderen Werte noch erweitern?
Wie soll die Tabelle dann aussehen ? Oder mehrere Tabellen ?
-
@paul53 sagte in Diagramm mehrerer Datenpunkte ohne History:
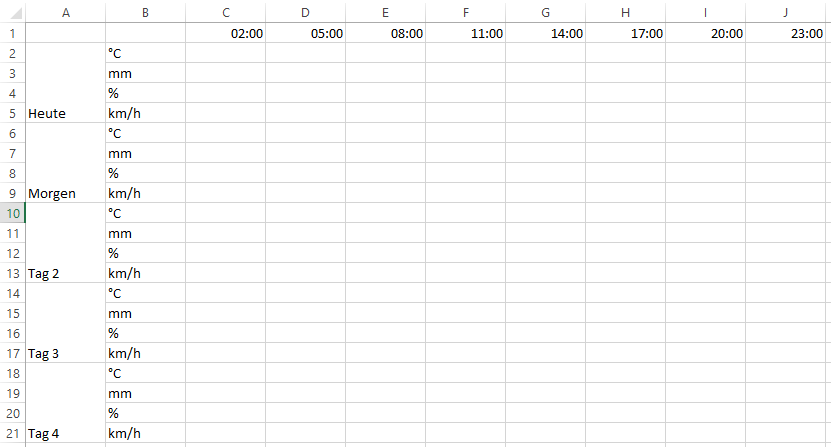
@Negalein 40 Zeilen ?
So zB hätte ich gedacht
° Node.js & System Update ---> sudo apt update, iob stop, sudo apt full-upgrade
° Node.js Fixer ---> iob nodejs-update
° Fixer ---> iob fix -
Hier gingen jetzt zwei Sachen durcheinander. Zum Einen das Skript von @paul53 zur Erstellung einer JSON-Tabelle und dann meine Version, die die Grundlage für charts.js bilden sollte. Das sollten wir vielleicht klarer trennen.
Mir ging es in erster Linie um eine grafische Darstellung der Vorhersagewerte. Eine JSON-Tabelle ist da ggf. nicht so zielführend, zumal man die Werte ja auch problemlos einzeln mit entsprechenden Widgets als Tabelle darstellen kann.
@paul53: hab die Units aus den Array-Datenpunkten ebenfalls entfernt. Danke für den Hinweis.
Hab mir nun mal charts.js mit
npm install chart.js --saveinstalliert. Unter node_modules befinden sich auch die entsprechenden charts.js-Verzeichnisse. Doch nun stocke ich bei der Erstellung des entsprechenden Skripts mit
require(['chart.js/dist/Chart.js'], function(Chart){
  var myChart = new Chart(ctx, {...});
});
Wie und wo zeige ich die entsprechenden Daten an? Jemand eine Idee?
ioBroker im Docker-Container auf Synology DiskStation DS718+, HomeMatic IP über CCU3, IKEA Dirigera inkl. Matter, Apple Homekit, Amazon Alexa.
-
Hier gingen jetzt zwei Sachen durcheinander. Zum Einen das Skript von @paul53 zur Erstellung einer JSON-Tabelle und dann meine Version, die die Grundlage für charts.js bilden sollte. Das sollten wir vielleicht klarer trennen.
Mir ging es in erster Linie um eine grafische Darstellung der Vorhersagewerte. Eine JSON-Tabelle ist da ggf. nicht so zielführend, zumal man die Werte ja auch problemlos einzeln mit entsprechenden Widgets als Tabelle darstellen kann.
@paul53: hab die Units aus den Array-Datenpunkten ebenfalls entfernt. Danke für den Hinweis.
Hab mir nun mal charts.js mit
npm install chart.js --saveinstalliert. Unter node_modules befinden sich auch die entsprechenden charts.js-Verzeichnisse. Doch nun stocke ich bei der Erstellung des entsprechenden Skripts mit
require(['chart.js/dist/Chart.js'], function(Chart){
  var myChart = new Chart(ctx, {...});
});
Wie und wo zeige ich die entsprechenden Daten an? Jemand eine Idee?
-
@paul53 sagte in Diagramm mehrerer Datenpunkte ohne History:
@Negalein 40 Zeilen ?
So zB hätte ich gedacht
@Negalein sagte:
So zB hätte ich gedacht
Versuche es mal so (nicht getestet)
var path    = "daswetter.0.NextDaysDetailed.Location_1.Day_"; // Pfad der String-Datenpunkte aus "list"
var idTable = "vis.dasWetterTable"; // Pfad des Datenpunkts für das vis-Json

// Datenpunkte anlegen
createState(idTable, "", {
  name: idTable,
  desc: 'Tabelle der Vorhersagewerte aus daswetter.com als Json-Objekt',
  type: 'string',
  role: 'json'
});

function wetter() {
   var list = [];
   for(let i = 0; i < 20; i++) {
      var j = i % 4;
      var sensor = 'temp_value';
      var unit = '°C';
      if(j == 1) {
	     sensor = 'humidity_value';
	     unit = '%rH';
      }
      else if(j == 2) {
	     sensor = 'rain_value';
	     unit = 'mm';
      }
      else if(j == 3) {
	     sensor = 'wind_value';
             unit = 'km/h';
      }
      var day = Math.floor(i / 4);
      var tage = ['Heute','Morgen','Tag 2','Tag 3','Tag 4']
      list[i] = {};
      if(j == 0) list[i].Tag = tage[day];
      list[i].Sensor = unit;
      day = day + 1;
      list[i]['02:00'] = getState(path + day + '.Hour_1.' + sensor).val;
      list[i]['05:00'] = getState(path + day + '.Hour_2.' + sensor).val;
      list[i]['08:00'] = getState(path + day + '.Hour_3.' + sensor).val;
      list[i]['11:00'] = getState(path + day + '.Hour_4.' + sensor).val;
      list[i]['14:00'] = getState(path + day + '.Hour_5.' + sensor).val;
      list[i]['17:00'] = getState(path + day + '.Hour_6.' + sensor).val;
      list[i]['20:00'] = getState(path + day + '.Hour_7.' + sensor).val;
      list[i]['23:00'] = getState(path + day + '.Hour_8.' + sensor).val;
   }
   var json = JSON.stringify(list);
   // log(json);
   setState(idTable, json, true);
}

// Trigger
schedule('10 */15 * * * *', wetter);
Bitte verzichtet auf Chat-Nachrichten, denn die Handhabung ist grauenhaft !
Produktiv: Asus PN 42 / N100 / 8 GB / 500 GB; Proxmox mit 2 VM (iob / openCCU) -
@Negalein sagte:
So zB hätte ich gedacht
Versuche es mal so (nicht getestet)
var path = "daswetter.0.NextDaysDetailed.Location_1.Day_"; // Pfad der String-Datenpunkte aus "list" var idTable = "vis.dasWetterTable"; // Pfad des Datenpunkts für das vis-Json // Datenpunkte anlegen createState(idTable, "", { name: idTable, desc: 'Tabelle der Vorhersagewerte aus daswetter.com als Json-Objekt', type: 'string', role: 'json' }); function wetter() { var list = []; for(let i = 0; i < 20; i++) { var j = i % 4; var sensor = 'temp_value'; var unit = '°C'; if(j == 1) { sensor = 'humidity_value'; unit = '%rH'; } else if(j == 2) { sensor = 'rain_value'; unit = 'mm'; } else if(j == 3) { sensor = 'wind_value'; unit = 'km/h'; } var day = Math.floor(i / 4); var tage = ['Heute','Morgen','Tag 2','Tag 3','Tag 4'] list[i] = {}; if(j == 0) list[i].Tag = tage[day]; list[i].Sensor = unit; day = day + 1; list[i]['02:00'] = getState(path + day + '.Hour_1.' + sensor).val; list[i]['05:00'] = getState(path + day + '.Hour_2.' + sensor).val; list[i]['08:00'] = getState(path + day + '.Hour_3.' + sensor).val; list[i]['11:00'] = getState(path + day + '.Hour_4.' + sensor).val; list[i]['14:00'] = getState(path + day + '.Hour_5.' + sensor).val; list[i]['17:00'] = getState(path + day + '.Hour_6.' + sensor).val; list[i]['20:00'] = getState(path + day + '.Hour_7.' + sensor).val; list[i]['23:00'] = getState(path + day + '.Hour_8.' + sensor).val; } var json = JSON.stringify(list); // log(json); setState(idTable, json, true); } // Trigger schedule('10 */15 * * * *', wetter);@paul53 sagte in Diagramm mehrerer Datenpunkte ohne History:
@Negalein sagte:
So zB hätte ich gedacht
Versuche es mal so (nicht getestet)
Funktioniert leider nicht.
Aber egal. Ich versuchs irgendwie grafisch umzusetzen.Danke
° Node.js & System Update ---> sudo apt update, iob stop, sudo apt full-upgrade
° Node.js Fixer ---> iob nodejs-update
° Fixer ---> iob fix -
@paul53 sagte in Diagramm mehrerer Datenpunkte ohne History:
@Negalein sagte:
So zB hätte ich gedacht
Versuche es mal so (nicht getestet)
Funktioniert leider nicht.
Aber egal. Ich versuchs irgendwie grafisch umzusetzen.Danke
@Negalein
Ändere malif(j == 0) list[i].Tag = tage[day];in
      if(j == 0) list[i].Tag = tage[day];
      else list[i].Tag = '';
Bitte verzichtet auf Chat-Nachrichten, denn die Handhabung ist grauenhaft !
Produktiv: Asus PN 42 / N100 / 8 GB / 500 GB; Proxmox mit 2 VM (iob / openCCU) -
@Negalein
Ändere malif(j == 0) list[i].Tag = tage[day];in
if(j == 0) list[i].Tag = tage[day]; else list[i].Tag = '';@paul53 sagte in Diagramm mehrerer Datenpunkte ohne History:
@Negalein
Ändere malif(j == 0) list[i].Tag = tage[day];in
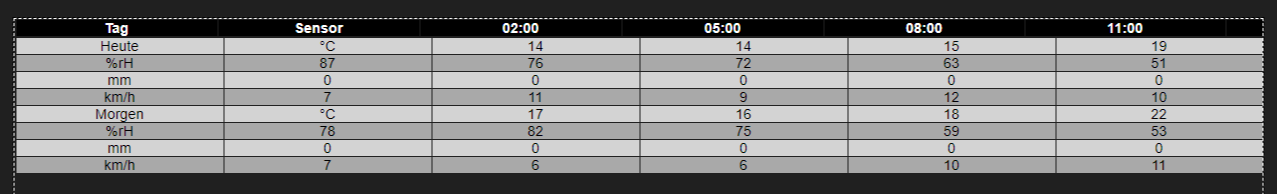
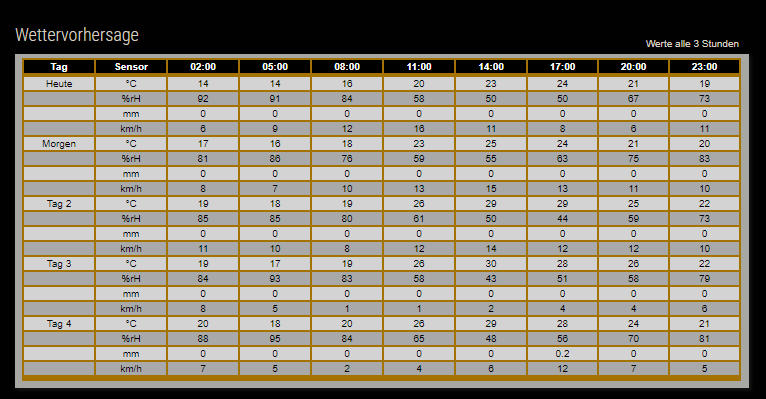
      if(j == 0) list[i].Tag = tage[day];
      else list[i].Tag = '';
Schaut bei mir so aus:
Edit:
Bitte benutzt das Voting rechts unten im Beitrag wenn er euch geholfen hat.
Immer Daten sichern! -
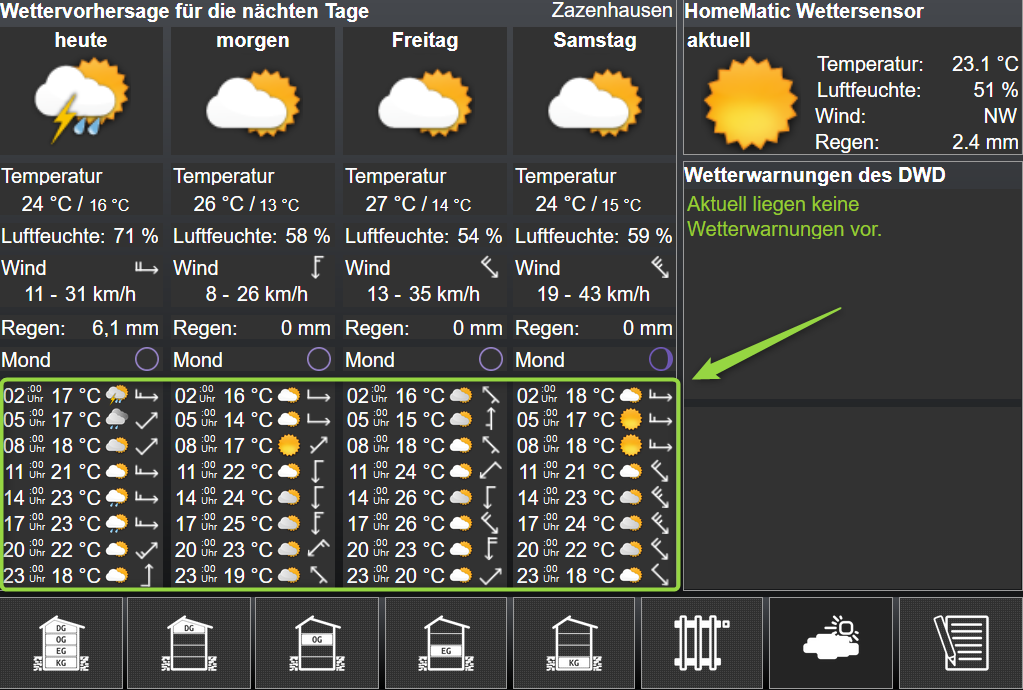
Also das finde ich aber ehrlich gesagt alles andere, als übersichtlich. Da würde ich lieber bei der Ansicht aus meinem Ausgangsposting bleiben.
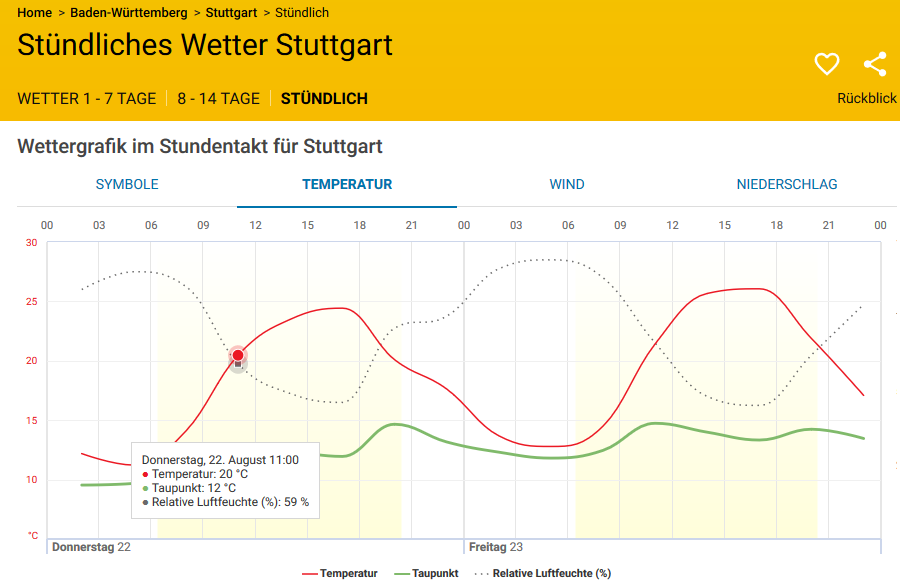
Eigentlich schwebte mir eher sowas vor:
ioBroker im Docker-Container auf Synology DiskStation DS718+, HomeMatic IP über CCU3, IKEA Dirigera inkl. Matter, Apple Homekit, Amazon Alexa.
-
@paul53 sagte in Diagramm mehrerer Datenpunkte ohne History:
@Negalein
Ändere malif(j == 0) list[i].Tag = tage[day];in
      if(j == 0) list[i].Tag = tage[day];
      else list[i].Tag = '';
Schaut bei mir so aus:
Edit:
-
@paul53 sagte in Diagramm mehrerer Datenpunkte ohne History:
@sigi234 sagte:
Edit:
Passt doch zur Excel-Tabelle von @Negalein.
Ja sag ich eh...........

-
Also das finde ich aber ehrlich gesagt alles andere, als übersichtlich. Da würde ich lieber bei der Ansicht aus meinem Ausgangsposting bleiben.
Eigentlich schwebte mir eher sowas vor:
Hey! Du scheinst an dieser Unterhaltung interessiert zu sein, hast aber noch kein Konto.
Hast du es satt, bei jedem Besuch durch die gleichen Beiträge zu scrollen? Wenn du dich für ein Konto anmeldest, kommst du immer genau dorthin zurück, wo du zuvor warst, und kannst dich über neue Antworten benachrichtigen lassen (entweder per E-Mail oder Push-Benachrichtigung). Du kannst auch Lesezeichen speichern und Beiträge positiv bewerten, um anderen Community-Mitgliedern deine Wertschätzung zu zeigen.
Mit deinem Input könnte dieser Beitrag noch besser werden 💗
Registrieren AnmeldenSupport us
532
Online33.0k
Benutzer83.4k
Themen1.3m
Beiträge