NEWS


-
@thomas-braun said in Keinen zugriff auf Influx DB:
systemctl status grafana
pi@raspberrypi:~ $ systemctl status grafana
Unit grafana.service could not be found.
pi@raspberrypi:~ $
?? Aber die Installation war doch ohne Probleme ?
systemctl status grafana* -
systemctl status grafana*@thomas-braun said in Keinen zugriff auf Influx DB:
systemctl status grafana*
pi@raspberrypi:~ $ systemctl status grafana* pi@raspberrypi:~ $ systemctl status grafana Unit grafana.service could not be found. pi@raspberrypi:~ $ systemctl status grafana* pi@raspberrypi:~ $ -
@thomas-braun said in Keinen zugriff auf Influx DB:
systemctl status grafana*
pi@raspberrypi:~ $ systemctl status grafana* pi@raspberrypi:~ $ systemctl status grafana Unit grafana.service could not be found. pi@raspberrypi:~ $ systemctl status grafana* pi@raspberrypi:~ $sudo apt update apt policy grafana* -
@thomas-braun said in Keinen zugriff auf Influx DB:
systemctl status grafana*
pi@raspberrypi:~ $ systemctl status grafana* pi@raspberrypi:~ $ systemctl status grafana Unit grafana.service could not be found. pi@raspberrypi:~ $ systemctl status grafana* pi@raspberrypi:~ $Bzw:
sudo systemctl daemon-reload sudo systemctl start grafana-server sudo systemctl status grafana-server -
Bzw:
sudo systemctl daemon-reload sudo systemctl start grafana-server sudo systemctl status grafana-serverpi@raspberrypi:~ $ systemctl status grafana* ● grafana-server.service - Grafana instance Loaded: loaded (/lib/systemd/system/grafana-server.service; disabled; preset: enabled) Active: active (running) since Tue 2024-01-23 00:04:49 CET; 34s ago Docs: http://docs.grafana.org Main PID: 19823 (grafana) Tasks: 15 (limit: 457) CPU: 9.853s CGroup: /system.slice/grafana-server.service └─19823 /usr/share/grafana/bin/grafana server --config=/etc/grafana/grafana.ini --pidfile=/run/grafana/grafana-server.pid --packaging=deb cfg:default.pat> Jan 23 00:05:10 raspberrypi grafana[19823]: logger=provisioning.alerting t=2024-01-23T00:05:10.484274781+01:00 level=info msg="finished to provision alerting" Jan 23 00:05:10 raspberrypi grafana[19823]: logger=ngalert.state.manager t=2024-01-23T00:05:10.487621618+01:00 level=info msg="Warming state cache for startup" Jan 23 00:05:10 raspberrypi grafana[19823]: logger=ngalert.state.manager t=2024-01-23T00:05:10.489519141+01:00 level=info msg="State cache has been initialized" state> Jan 23 00:05:10 raspberrypi grafana[19823]: logger=ngalert.scheduler t=2024-01-23T00:05:10.489682063+01:00 level=info msg="Starting scheduler" tickInterval=10s Jan 23 00:05:10 raspberrypi grafana[19823]: logger=ticker t=2024-01-23T00:05:10.498451052+01:00 level=info msg=starting first_tick=2024-01-23T00:05:20+01:00 Jan 23 00:05:10 raspberrypi grafana[19823]: logger=ngalert.multiorg.alertmanager t=2024-01-23T00:05:10.498873707+01:00 level=info msg="Starting MultiOrg Alertmanager" Jan 23 00:05:10 raspberrypi grafana[19823]: logger=grafanaStorageLogger t=2024-01-23T00:05:10.505991925+01:00 level=info msg="Storage starting" Jan 23 00:05:10 raspberrypi grafana[19823]: logger=http.server t=2024-01-23T00:05:10.531073444+01:00 level=info msg="HTTP Server Listen" address=[::]:3000 protocol=ht> Jan 23 00:05:10 raspberrypi grafana[19823]: logger=grafana.update.checker t=2024-01-23T00:05:10.849257594+01:00 level=info msg="Update check succeeded" duration=342.5> Jan 23 00:05:10 raspberrypi grafana[19823]: logger=plugins.update.checker t=2024-01-23T00:05:10.868909627+01:00 level=info msg="Update check succeeded" dSehr cool danke. Jetzt geht es.
-
@herrx
Schau mal ob der auch nach einem Neustart auf die Beine kommt. -
@herrx
Schau mal ob der auch nach einem Neustart auf die Beine kommt. -
@thomas-braun ok da kommt mein Grafana nicht wieder auf die Beine
sudo systemctl enable grafana-server.service sudo systemctl start grafana-server.service -
sudo systemctl enable grafana-server.service sudo systemctl start grafana-server.service@thomas-braun Super Danke das hat geholfen. Muss ich das nach jedem reboot wieder eingeben?
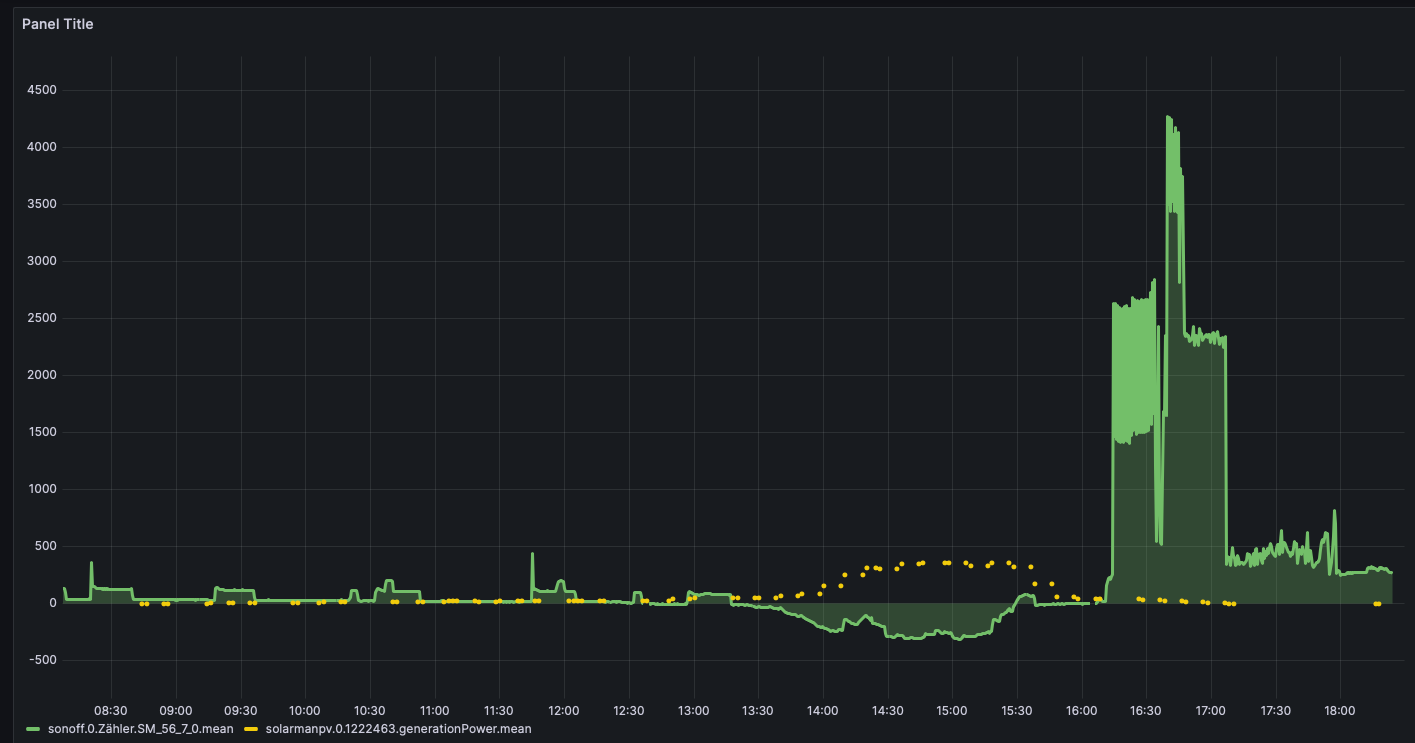
jetzt habe ich die Grafana anzeige wieder. Allerdings gibt mir mein Solarman nur alle 6min den aktuellen Leistungswert. Kann ich die Punkte dazwischen interpolieren? oder zumindest die Punkte verbinden?
-
@thomas-braun Super Danke das hat geholfen. Muss ich das nach jedem reboot wieder eingeben?
jetzt habe ich die Grafana anzeige wieder. Allerdings gibt mir mein Solarman nur alle 6min den aktuellen Leistungswert. Kann ich die Punkte dazwischen interpolieren? oder zumindest die Punkte verbinden?
@herrx sagte in Keinen zugriff auf Influx DB:
Muss ich das nach jedem reboot wieder eingeben?
Nein, der Service sollte nun beim booten gestartet werden.
Support us
715
Online32.6k
Users82.3k
Topics1.3m
Posts