NEWS


-
@thomas-braun said in Keinen zugriff auf Influx DB:
sudo rm /etc/apt/sources.list.d/influx* wget -q https://repos.influxdata.com/influxdata-archive_compat.key echo '393e8779c89ac8d958f81f942f9ad7fb82a25e133faddaf92e15b16e6ac9ce4c influxdata-archive_compat.key' | sha256sum -c && cat influxdata-archive_compat.key | gpg --dearmor | sudo tee /usr/share/keyrings/influxdata-archive_compat.gpg > /dev/null echo 'deb [signed-by=/usr/share/keyrings/influxdata-archive_compat.gpg] https://repos.influxdata.com/debian stable main' | sudo tee /etc/apt/sources.list.d/influxdata.list rm influxdata-archive_compat.ke*
pi@raspberrypi:~ $ sudo rm /etc/apt/sources.list.d/influx*
wget -q https://repos.influxdata.com/influxdata-archive_compat.key

echo '393e8779c89ac8d958f81f942f9ad7fb82a25e133faddaf92e15b16e6ac9ce4c influxdata-archive_compat.key' | sha256sum -c && cat influxdata-archive_compat.key | gpg --dearmor | sudo tee /usr/share/keyrings/influxdata-archive_compat.gpg > /dev/null

echo 'deb [signed-by=/usr/share/keyrings/influxdata-archive_compat.gpg] https://repos.influxdata.com/debian stable main' | sudo tee /etc/apt/sources.list.d/influxdata.list

rm influxdata-archive_compat.ke*
influxdata-archive_compat.key: OK
deb [signed-by=/usr/share/keyrings/influxdata-archive_compat.gpg] https://repos.influxdata.com/debian stable main
pi@raspberrypi:~ $
pi@raspberrypi:~ $ sudo apt update apt policy influx* Hit:1 http://archive.raspberrypi.com/debian bookworm InRelease Hit:2 http://deb.debian.org/debian bookworm InRelease Hit:3 http://deb.debian.org/debian-security bookworm-security InRelease Get:4 http://deb.debian.org/debian bookworm-updates InRelease [52.1 kB] Hit:5 https://repos.influxdata.com/debian stable InRelease Hit:6 https://apt.grafana.com stable InRelease Hit:7 https://deb.nodesource.com/node_18.x nodistro InRelease Fetched 52.1 kB in 2s (26.4 kB/s) Reading package lists... Done Building dependency tree... Done Reading state information... Done All packages are up to date. influxdb2-cli: Installed: (none) Candidate: 2.7.3-1 Version table: 2.7.3-1 500 500 https://repos.influxdata.com/debian stable/main arm64 Packages 2.7.1-2 500 500 https://repos.influxdata.com/debian stable/main arm64 Packages 2.6.1 500 500 https://repos.influxdata.com/debian stable/main arm64 Packages 2.6.0 500 500 https://repos.influxdata.com/debian stable/main arm64 Packages 2.5.0 500 500 https://repos.influxdata.com/debian stable/main arm64 Packages 2.4.0 500 500 https://repos.influxdata.com/debian stable/main arm64 Packages 2.3.0 500 500 https://repos.influxdata.com/debian stable/main arm64 Packages influxdb-client: Installed: (none) Candidate: 1.6.7~rc0-1+b13 Version table: 1.6.7~rc0-1+b13 500 500 http://deb.debian.org/debian bookworm/main arm64 Packages influxdb-dev: Installed: (none) Candidate: (none) Version table: influxdb2-client: Installed: (none) Candidate: 2.7.1-1 Version table: 2.7.1-1 500 500 https://repos.influxdata.com/debian stable/main arm64 Packages influxdb: Installed: 1.8.10-1 Candidate: 1.8.10-1 Version table: *** 1.8.10-1 500 500 https://repos.influxdata.com/debian stable/main arm64 Packages 100 /var/lib/dpkg/status 1.6.7~rc0-1+b13 500 500 http://deb.debian.org/debian bookworm/main arm64 Packages influxctl: Installed: (none) Candidate: 2.4.3 Version table: 2.4.3 500 500 https://repos.influxdata.com/debian stable/main arm64 Packages 2.4.2 500 500 https://repos.influxdata.com/debian stable/main arm64 Packages 2.4.1 500 500 https://repos.influxdata.com/debian stable/main arm64 Packages 2.4.0 500 500 https://repos.influxdata.com/debian stable/main arm64 Packages 2.3.1 500 500 https://repos.influxdata.com/debian stable/main arm64 Packages 2.3.0 500 500 https://repos.influxdata.com/debian stable/main arm64 Packages 2.2.0 500 500 https://repos.influxdata.com/debian stable/main arm64 Packages 2.1.0 500 500 https://repos.influxdata.com/debian stable/main arm64 Packages 2.0.4 500 500 https://repos.influxdata.com/debian stable/main arm64 Packages 2.0.3 500 500 https://repos.influxdata.com/debian stable/main arm64 Packages 2.0.2 500 500 https://repos.influxdata.com/debian stable/main arm64 Packages 2.0.1 500 500 https://repos.influxdata.com/debian stable/main arm64 Packages 2.0.0 500 500 https://repos.influxdata.com/debian stable/main arm64 Packages influxdb2: Installed: (none) Candidate: 2.7.5-1 Version table: 2.7.5-1 500 500 https://repos.influxdata.com/debian stable/main arm64 Packages 2.7.4-1 500 500 https://repos.influxdata.com/debian stable/main arm64 Packages 2.7.3-1 500 500 https://repos.influxdata.com/debian stable/main arm64 Packages 2.7.1-1 500 500 https://repos.influxdata.com/debian stable/main arm64 Packages 2.7.0-1 500 500 https://repos.influxdata.com/debian stable/main arm64 Packages 2.6.1-1 500 500 https://repos.influxdata.com/debian stable/main arm64 Packages 2.6.0-1 500 500 https://repos.influxdata.com/debian stable/main arm64 Packages 2.5.1-1 500 500 https://repos.influxdata.com/debian stable/main arm64 Packages 2.4.0-1 500 500 https://repos.influxdata.com/debian stable/main arm64 Packages 2.3.0-1 500 500 https://repos.influxdata.com/debian stable/main arm64 Packages 2.2.0 500 500 https://repos.influxdata.com/debian stable/main arm64 Packages pi@raspberrypi:~ $pi@raspberrypi:~ $ cat /etc/apt/sources.list.d/influxdb.list cat: /etc/apt/sources.list.d/influxdb.list: No such file or directory@herrx sagte in Keinen zugriff auf Influx DB:
cat: /etc/apt/sources.list.d/influxdb.list: No such file or directory
Richtig. Das heißt ja auch
cat /etc/apt/sources.list.d/influxdata.list -
@herrx sagte in Keinen zugriff auf Influx DB:
cat: /etc/apt/sources.list.d/influxdb.list: No such file or directory
Richtig. Das heißt ja auch
cat /etc/apt/sources.list.d/influxdata.list@thomas-braun Aber ich komme immer noch nicht auf das interface via http://RPI-IP:8086
-
@thomas-braun Aber ich komme immer noch nicht auf das interface via http://RPI-IP:8086
Wenn ich auf die Webseite gehe http://RPI-IP:8086 bekomme ich den Fehler 404 page not found.
Kann ja auch nix kommen, die influxdb 1.8 hat auch kein WebGUI.
Gibt es erst ab influxdb2. -
Wenn ich auf die Webseite gehe http://RPI-IP:8086 bekomme ich den Fehler 404 page not found.
Kann ja auch nix kommen, die influxdb 1.8 hat auch kein WebGUI.
Gibt es erst ab influxdb2. -
@thomas-braun Ah ok das macht Sinn. Hast du noch eine Anleitung um Grafana zu installieren =! Youtube?
Grafana:
sudo apt-get install -y apt-transport-https
sudo apt-get install -y software-properties-common wget
sudo wget -q -O /usr/share/keyrings/grafana.key https://apt.grafana.com/gpg.key
echo "deb [signed-by=/usr/share/keyrings/grafana.key] https://apt.grafana.com stable main" | sudo tee /etc/apt/sources.list.d/grafana.list
sudo apt update sudo apt install grafana -
Grafana:
sudo apt-get install -y apt-transport-https sudo apt-get install -y software-properties-common wget sudo wget -q -O /usr/share/keyrings/grafana.key https://apt.grafana.com/gpg.key echo "deb [signed-by=/usr/share/keyrings/grafana.key] https://apt.grafana.com stable main" | sudo tee /etc/apt/sources.list.d/grafana.listsudo apt update sudo apt install grafana@thomas-braun said in Keinen zugriff auf Influx DB:
sudo apt update sudo apt install grafanapi@raspberrypi:~ $ sudo apt-get install -y apt-transport-https sudo apt-get install -y software-properties-common wget sudo wget -q -O /usr/share/keyrings/grafana.key https://apt.grafana.com/gpg.key echo "deb [signed-by=/usr/share/keyrings/grafana.key] https://apt.grafana.com stable main" | sudo tee /etc/apt/sources.list.d/grafana.list Reading package lists... Done Building dependency tree... Done Reading state information... Done apt-transport-https is already the newest version (2.6.1). 0 upgraded, 0 newly installed, 0 to remove and 0 not upgraded. Reading package lists... Done Building dependency tree... Done Reading state information... Done software-properties-common is already the newest version (0.99.30-4). wget is already the newest version (1.21.3-1+b1). 0 upgraded, 0 newly installed, 0 to remove and 0 not upgraded. deb [signed-by=/usr/share/keyrings/grafana.key] https://apt.grafana.com stable main pi@raspberrypi:~ $ sudo apt update sudo apt install grafana Hit:1 http://deb.debian.org/debian bookworm InRelease Hit:2 http://deb.debian.org/debian-security bookworm-security InRelease Hit:3 http://deb.debian.org/debian bookworm-updates InRelease Hit:4 http://archive.raspberrypi.com/debian bookworm InRelease Hit:5 https://repos.influxdata.com/debian stable InRelease Hit:6 https://apt.grafana.com stable InRelease Hit:7 https://deb.nodesource.com/node_18.x nodistro InRelease Reading package lists... Done Building dependency tree... Done Reading state information... Done All packages are up to date. Reading package lists... Done Building dependency tree... Done Reading state information... Done grafana is already the newest version (10.2.3). 0 upgraded, 0 newly installed, 0 to remove and 0 not upgraded.Super Danke. Aber Grafana kann ich ebenfalls nicht über die RPI-IP:3000 erreichen.
-
@thomas-braun said in Keinen zugriff auf Influx DB:
sudo apt update sudo apt install grafanapi@raspberrypi:~ $ sudo apt-get install -y apt-transport-https sudo apt-get install -y software-properties-common wget sudo wget -q -O /usr/share/keyrings/grafana.key https://apt.grafana.com/gpg.key echo "deb [signed-by=/usr/share/keyrings/grafana.key] https://apt.grafana.com stable main" | sudo tee /etc/apt/sources.list.d/grafana.list Reading package lists... Done Building dependency tree... Done Reading state information... Done apt-transport-https is already the newest version (2.6.1). 0 upgraded, 0 newly installed, 0 to remove and 0 not upgraded. Reading package lists... Done Building dependency tree... Done Reading state information... Done software-properties-common is already the newest version (0.99.30-4). wget is already the newest version (1.21.3-1+b1). 0 upgraded, 0 newly installed, 0 to remove and 0 not upgraded. deb [signed-by=/usr/share/keyrings/grafana.key] https://apt.grafana.com stable main pi@raspberrypi:~ $ sudo apt update sudo apt install grafana Hit:1 http://deb.debian.org/debian bookworm InRelease Hit:2 http://deb.debian.org/debian-security bookworm-security InRelease Hit:3 http://deb.debian.org/debian bookworm-updates InRelease Hit:4 http://archive.raspberrypi.com/debian bookworm InRelease Hit:5 https://repos.influxdata.com/debian stable InRelease Hit:6 https://apt.grafana.com stable InRelease Hit:7 https://deb.nodesource.com/node_18.x nodistro InRelease Reading package lists... Done Building dependency tree... Done Reading state information... Done All packages are up to date. Reading package lists... Done Building dependency tree... Done Reading state information... Done grafana is already the newest version (10.2.3). 0 upgraded, 0 newly installed, 0 to remove and 0 not upgraded.Super Danke. Aber Grafana kann ich ebenfalls nicht über die RPI-IP:3000 erreichen.
systemctl status grafana -
systemctl status grafana@thomas-braun said in Keinen zugriff auf Influx DB:
systemctl status grafana
pi@raspberrypi:~ $ systemctl status grafana
Unit grafana.service could not be found.
pi@raspberrypi:~ $
?? Aber die Installation war doch ohne Probleme ?
-
@thomas-braun said in Keinen zugriff auf Influx DB:
systemctl status grafana
pi@raspberrypi:~ $ systemctl status grafana
Unit grafana.service could not be found.
pi@raspberrypi:~ $
?? Aber die Installation war doch ohne Probleme ?
systemctl status grafana* -
systemctl status grafana*@thomas-braun said in Keinen zugriff auf Influx DB:
systemctl status grafana*
pi@raspberrypi:~ $ systemctl status grafana* pi@raspberrypi:~ $ systemctl status grafana Unit grafana.service could not be found. pi@raspberrypi:~ $ systemctl status grafana* pi@raspberrypi:~ $ -
@thomas-braun said in Keinen zugriff auf Influx DB:
systemctl status grafana*
pi@raspberrypi:~ $ systemctl status grafana* pi@raspberrypi:~ $ systemctl status grafana Unit grafana.service could not be found. pi@raspberrypi:~ $ systemctl status grafana* pi@raspberrypi:~ $sudo apt update apt policy grafana* -
@thomas-braun said in Keinen zugriff auf Influx DB:
systemctl status grafana*
pi@raspberrypi:~ $ systemctl status grafana* pi@raspberrypi:~ $ systemctl status grafana Unit grafana.service could not be found. pi@raspberrypi:~ $ systemctl status grafana* pi@raspberrypi:~ $Bzw:
sudo systemctl daemon-reload sudo systemctl start grafana-server sudo systemctl status grafana-server -
Bzw:
sudo systemctl daemon-reload sudo systemctl start grafana-server sudo systemctl status grafana-serverpi@raspberrypi:~ $ systemctl status grafana* ● grafana-server.service - Grafana instance Loaded: loaded (/lib/systemd/system/grafana-server.service; disabled; preset: enabled) Active: active (running) since Tue 2024-01-23 00:04:49 CET; 34s ago Docs: http://docs.grafana.org Main PID: 19823 (grafana) Tasks: 15 (limit: 457) CPU: 9.853s CGroup: /system.slice/grafana-server.service └─19823 /usr/share/grafana/bin/grafana server --config=/etc/grafana/grafana.ini --pidfile=/run/grafana/grafana-server.pid --packaging=deb cfg:default.pat> Jan 23 00:05:10 raspberrypi grafana[19823]: logger=provisioning.alerting t=2024-01-23T00:05:10.484274781+01:00 level=info msg="finished to provision alerting" Jan 23 00:05:10 raspberrypi grafana[19823]: logger=ngalert.state.manager t=2024-01-23T00:05:10.487621618+01:00 level=info msg="Warming state cache for startup" Jan 23 00:05:10 raspberrypi grafana[19823]: logger=ngalert.state.manager t=2024-01-23T00:05:10.489519141+01:00 level=info msg="State cache has been initialized" state> Jan 23 00:05:10 raspberrypi grafana[19823]: logger=ngalert.scheduler t=2024-01-23T00:05:10.489682063+01:00 level=info msg="Starting scheduler" tickInterval=10s Jan 23 00:05:10 raspberrypi grafana[19823]: logger=ticker t=2024-01-23T00:05:10.498451052+01:00 level=info msg=starting first_tick=2024-01-23T00:05:20+01:00 Jan 23 00:05:10 raspberrypi grafana[19823]: logger=ngalert.multiorg.alertmanager t=2024-01-23T00:05:10.498873707+01:00 level=info msg="Starting MultiOrg Alertmanager" Jan 23 00:05:10 raspberrypi grafana[19823]: logger=grafanaStorageLogger t=2024-01-23T00:05:10.505991925+01:00 level=info msg="Storage starting" Jan 23 00:05:10 raspberrypi grafana[19823]: logger=http.server t=2024-01-23T00:05:10.531073444+01:00 level=info msg="HTTP Server Listen" address=[::]:3000 protocol=ht> Jan 23 00:05:10 raspberrypi grafana[19823]: logger=grafana.update.checker t=2024-01-23T00:05:10.849257594+01:00 level=info msg="Update check succeeded" duration=342.5> Jan 23 00:05:10 raspberrypi grafana[19823]: logger=plugins.update.checker t=2024-01-23T00:05:10.868909627+01:00 level=info msg="Update check succeeded" dSehr cool danke. Jetzt geht es.
-
@herrx
Schau mal ob der auch nach einem Neustart auf die Beine kommt. -
@herrx
Schau mal ob der auch nach einem Neustart auf die Beine kommt. -
@thomas-braun ok da kommt mein Grafana nicht wieder auf die Beine
sudo systemctl enable grafana-server.service sudo systemctl start grafana-server.service -
sudo systemctl enable grafana-server.service sudo systemctl start grafana-server.service@thomas-braun Super Danke das hat geholfen. Muss ich das nach jedem reboot wieder eingeben?
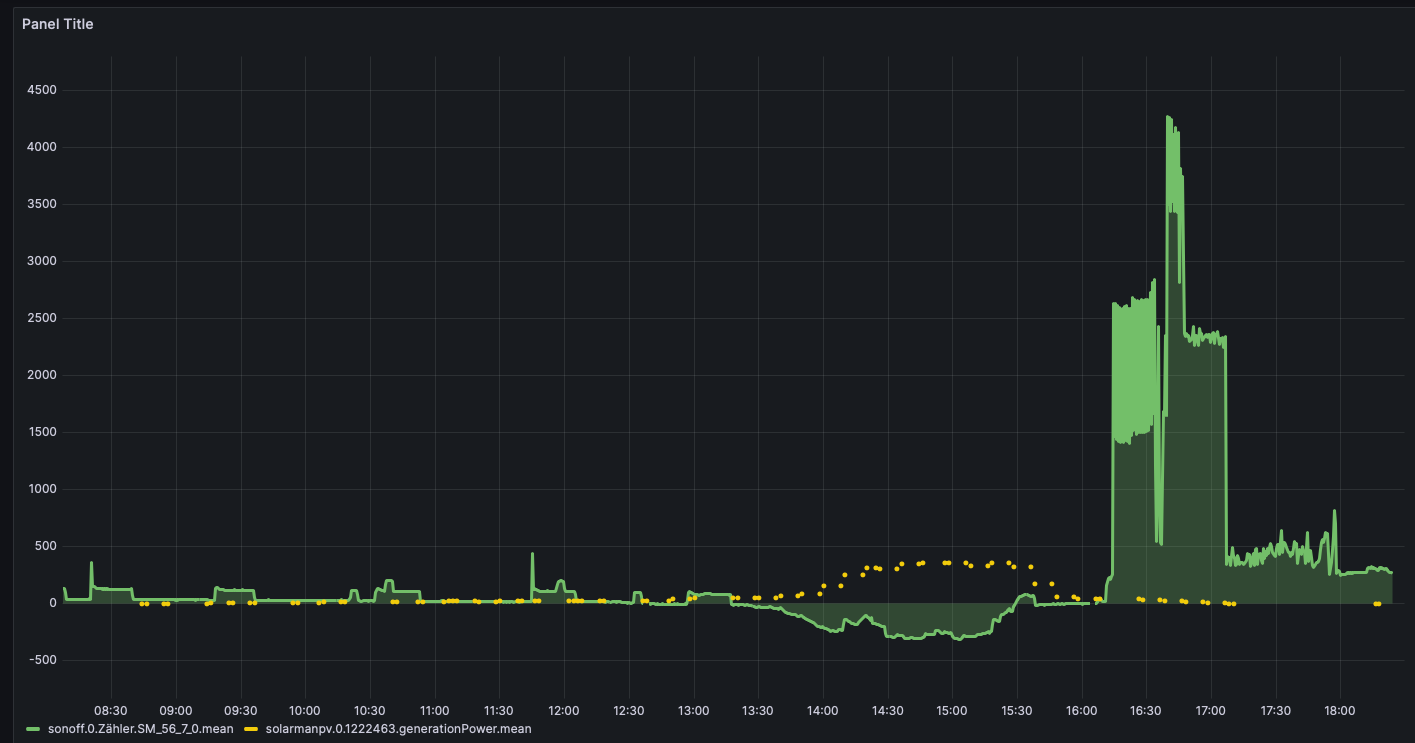
jetzt habe ich die Grafana anzeige wieder. Allerdings gibt mir mein Solarman nur alle 6min den aktuellen Leistungswert. Kann ich die Punkte dazwischen interpolieren? oder zumindest die Punkte verbinden?
-
@thomas-braun Super Danke das hat geholfen. Muss ich das nach jedem reboot wieder eingeben?
jetzt habe ich die Grafana anzeige wieder. Allerdings gibt mir mein Solarman nur alle 6min den aktuellen Leistungswert. Kann ich die Punkte dazwischen interpolieren? oder zumindest die Punkte verbinden?
@herrx sagte in Keinen zugriff auf Influx DB:
Muss ich das nach jedem reboot wieder eingeben?
Nein, der Service sollte nun beim booten gestartet werden.
Support us
526
Online32.6k
Users82.3k
Topics1.3m
Posts