

[GELÖST] Influx Dashboard in Vis einbinden
-
wahrscheinlich bildet das JSON eine Tabellenstruktur ab.
Dann erstelle dir unter 0_userdata.0 einen Datenpunkt (Typ string/json) , wo du das JSON vom Influx reinschreibst. Im VIS benutzt du dann eine "json Table".
-
@peterk34
hmm, vielleicht vorher etwas aufbereiten?Sie dir das mal dort an: http://json2table.com/
JSON reinwerfen und dann auf Play drücken.Willst du das wirklich so in deiner VIS haben?
Ist für die json Tables im Vis aktuell zu komplex aufgebaut, würde ich mal sagen.
Dann kannst du das zunächst einmal in ein Objekt parsen, die Werte so aggregieren, dass da eine saubere Tabelle herauspurzelt und dann in Vis einbinden.
Installationsanleitung, Tipps, Alias-Definitionen, FAQ für das Sonoff NSPanel mit lovelace UI unter ioBroker
https://github.com/joBr99/nspanel-lovelace-ui/wikiBenutzt das Voting rechts unten im Beitrag wenn er euch geholfen hat.
-
@peterk34
hmm, vielleicht vorher etwas aufbereiten?Sie dir das mal dort an: http://json2table.com/
JSON reinwerfen und dann auf Play drücken.Willst du das wirklich so in deiner VIS haben?
Ist für die json Tables im Vis aktuell zu komplex aufgebaut, würde ich mal sagen.
Dann kannst du das zunächst einmal in ein Objekt parsen, die Werte so aggregieren, dass da eine saubere Tabelle herauspurzelt und dann in Vis einbinden.
-
-
ich würde gerne ein influxdb Dashboard in VIS darstellen ...
Bei Grafana ging das über einen html Code ... gibts da mit Influxdb auch eine Möglichkeit? Das Dashboard kann als JSON exportiert werden - aber wie bringe ich es dann ins VIS?
@peterk34 sagte in Influx Dashboard in Vis einbinden:
ich würde gerne ein influxdb Dashboard in VIS darstellen
Schau Dir mal den Adapter echarts an, der sollte Dir helfen.
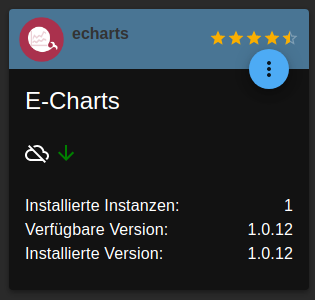
Dann in VIS das echart Widget auswählen und dort die ID von echarts eintragen
Schau mal hier:
Youtube -
@peterk34 sagte in Influx Dashboard in Vis einbinden:
ich würde gerne ein influxdb Dashboard in VIS darstellen
Schau Dir mal den Adapter echarts an, der sollte Dir helfen.
Dann in VIS das echart Widget auswählen und dort die ID von echarts eintragen
Schau mal hier:
Youtube@hagst was soll denn jetzt der echarts Adapter hier bewirken ?
@peterk34 möchte das Dashboard 1:1 optisch in VIS darstellen.Lehrling seit 1975 !!!
Beitrag geholfen ? dann gerne ein upvote rechts unten im Beitrag klicken ;)
https://forum.iobroker.net/topic/51555/hinweise-f%C3%BCr-gute-forenbeitr%C3%A4ge -
@peterk34
Wenn es in Grafana bereits läuft, warum bindest du dann nicht das Grafana-Dashboard in Vis ein?Installationsanleitung, Tipps, Alias-Definitionen, FAQ für das Sonoff NSPanel mit lovelace UI unter ioBroker
https://github.com/joBr99/nspanel-lovelace-ui/wikiBenutzt das Voting rechts unten im Beitrag wenn er euch geholfen hat.
-
@peterk34
Wenn es in Grafana bereits läuft, warum bindest du dann nicht das Grafana-Dashboard in Vis ein?@armilar sagte in Influx Dashboard in Vis einbinden:
Wenn es in Grafana bereits läuft, warum bindest du dann nicht das Grafana-Dashboard in Vis ein
??? Glaub nicht dass Du mich da markieren wolltest ?!
Lehrling seit 1975 !!!
Beitrag geholfen ? dann gerne ein upvote rechts unten im Beitrag klicken ;)
https://forum.iobroker.net/topic/51555/hinweise-f%C3%BCr-gute-forenbeitr%C3%A4ge -
@armilar sagte in Influx Dashboard in Vis einbinden:
Wenn es in Grafana bereits läuft, warum bindest du dann nicht das Grafana-Dashboard in Vis ein
??? Glaub nicht dass Du mich da markieren wolltest ?!
@djmarc75
das ist wohl richtig ;-) -
@peterk34
Wenn es in Grafana bereits läuft, warum bindest du dann nicht das Grafana-Dashboard in Vis ein? -
Habe jetzt influxdb und grafana neu aufgesetzt ... integriere es jetzt über grafana da influxdb offenbar nicht geht und hab sofort ein neues Problem:

jemand eine Idee?
Bitte keine Bildchen von Text.
Text in CodeTags eingebettet hier rein.Diagnose: Der user 'pi' darf in /var/lib/grafana/plugins nicht schreiben.
Ich bin mir auch nicht sicher, ob das der übliche Weg ist plugins zu installieren.
Wie sehen denn die Rechte an dem Verzeichnis aus?
-
Bitte keine Bildchen von Text.
Text in CodeTags eingebettet hier rein.Diagnose: Der user 'pi' darf in /var/lib/grafana/plugins nicht schreiben.
Ich bin mir auch nicht sicher, ob das der übliche Weg ist plugins zu installieren.
Wie sehen denn die Rechte an dem Verzeichnis aus?
@thomas-braun laut doku schon ... hab das Verzeichnis nun manuell angelegt mit dem Ergebnis, dass das plugin mit meiner Grafana Version gar nicht kompatibel ist ...
pi@IOB-KEP:/var/lib/grafana $ grafana-cli plugins install grafana-image-renderer
Error: ✗ grafana-image-renderer v is not supported on your system (Grafana v9.2.1 linux-arm64)
man brauchts aber offenbar um in VIS sichtbar zu werden ...

-
@thomas-braun laut doku schon ... hab das Verzeichnis nun manuell angelegt mit dem Ergebnis, dass das plugin mit meiner Grafana Version gar nicht kompatibel ist ...
pi@IOB-KEP:/var/lib/grafana $ grafana-cli plugins install grafana-image-renderer
Error: ✗ grafana-image-renderer v is not supported on your system (Grafana v9.2.1 linux-arm64)
man brauchts aber offenbar um in VIS sichtbar zu werden ...
Supported operating systems
Linux (x64)
Windows (x64)
Mac OS X (x64)
Dein arm64 wird nicht unterstützt.
-
Supported operating systems
Linux (x64)
Windows (x64)
Mac OS X (x64)
Dein arm64 wird nicht unterstützt.
schaut so aus ...
-
ich würde gerne ein influxdb Dashboard in VIS darstellen ...
Bei Grafana ging das über einen html Code ... gibts da mit Influxdb auch eine Möglichkeit? Das Dashboard kann als JSON exportiert werden - aber wie bringe ich es dann ins VIS?
-
Finale Lösung:
über Grafana, den Renderer brauchts nicht.
in grafana.ini:
allow_embedding = true und anonymus auth dann gehts wunderbar
dann Link als Iframe ins Vis wie oft beschrieben
Danke für die Unterstützung
-
@peterk34
Servus Peter, kannst du uns deine Lösung näher bringen.
Bin auf einem Raspi mit Grafanainstallation.
Was ist nun zu tun dass ich Screens aus Grafana abrufen und speichen kann?Grüße Reiner
Das ist ein
GelösterPost und sollte nach meinem dafür nicht wieder aufgemacht werden, besser einen Neue aufmachen und konkret sein Problem beschreiben, hast Du jetzt ein Problem mit Grafana oder beim Import in der VIS?Eine Schritt für Schritt Anleitung für Grafana?
- auf Deinem RasPi als User einloggen
- per sudo die Konfiguration von Grafana editieren
dp20eic@grafana:~$ ls -la /etc/grafana/grafana.ini -rw-r----- 1 root grafana 42835 Apr 20 2022 /etc/grafana/grafana.ini sudo vi /etc/grafana/grafana.ini - in der geöffneten Datei nach dem Eintrag
allow_embeddingsuchen - das
;vor dem Eintrag entfernen - falls dort noch
falsesteht auftrueändern, sieht dann so aus# set to true if you want to allow browsers to render Grafana in a <frame>, <iframe>, <embed> or <object>. default is false. allow_embedding = true - das gleiche für den anonymous zugriff machen
 #################################### Anonymous Auth ######################
 [auth.anonymous]
 # enable anonymous access
 ;enabled = false
Ich hab es nicht gesetzt geht hier auch so, ich must mich dann nur einmal einloggen, dass umgehst Du wenn
enabled = truesetzt
7. Datei speichern
8. Grafana restartensudo systemctl restart grafana-server.service- Dashboard oder Panel exportieren und in der VIS wie gewünscht einfügen.
VG
Bernd -
Das ist ein
GelösterPost und sollte nach meinem dafür nicht wieder aufgemacht werden, besser einen Neue aufmachen und konkret sein Problem beschreiben, hast Du jetzt ein Problem mit Grafana oder beim Import in der VIS?Eine Schritt für Schritt Anleitung für Grafana?
- auf Deinem RasPi als User einloggen
- per sudo die Konfiguration von Grafana editieren
dp20eic@grafana:~$ ls -la /etc/grafana/grafana.ini -rw-r----- 1 root grafana 42835 Apr 20 2022 /etc/grafana/grafana.ini sudo vi /etc/grafana/grafana.ini - in der geöffneten Datei nach dem Eintrag
allow_embeddingsuchen - das
;vor dem Eintrag entfernen - falls dort noch
falsesteht auftrueändern, sieht dann so aus# set to true if you want to allow browsers to render Grafana in a <frame>, <iframe>, <embed> or <object>. default is false. allow_embedding = true - das gleiche für den anonymous zugriff machen
 #################################### Anonymous Auth ######################
 [auth.anonymous]
 # enable anonymous access
 ;enabled = false
Ich hab es nicht gesetzt geht hier auch so, ich must mich dann nur einmal einloggen, dass umgehst Du wenn
enabled = truesetzt
7. Datei speichern
8. Grafana restartensudo systemctl restart grafana-server.service- Dashboard oder Panel exportieren und in der VIS wie gewünscht einfügen.
VG
Bernd
Hey! Du scheinst an dieser Unterhaltung interessiert zu sein, hast aber noch kein Konto.
Hast du es satt, bei jedem Besuch durch die gleichen Beiträge zu scrollen? Wenn du dich für ein Konto anmeldest, kommst du immer genau dorthin zurück, wo du zuvor warst, und kannst dich über neue Antworten benachrichtigen lassen (entweder per E-Mail oder Push-Benachrichtigung). Du kannst auch Lesezeichen speichern und Beiträge positiv bewerten, um anderen Community-Mitgliedern deine Wertschätzung zu zeigen.
Mit deinem Input könnte dieser Beitrag noch besser werden 💗
Registrieren AnmeldenSupport us
533
Online33.0k
Benutzer83.3k
Themen1.3m
Beiträge