

Forecast.solar mit dem Systeminfo Adapter
-
@jb_sullivan Da ist noch was nicht richtig. Ich schau grade
So , liegt auf GIT. Hab die api key mit drin.
Schau mal bitte ob bei Dir dann der url Pfad im Log stimmt.Zu der Rückwärtssuche :
Früher gab es eine api von Klicktel zur Rückwärtssuche, die gibt es nicht mehr. Auch eine andere gibt es nicht.
Aufgefallen ist mir das, als mein Gigaset keine Namen mehr angezeigt hat.Das Script wird aktiviert wenn der tr-064 Ringing aktiviert ist.
Wenn in der Fritzbox kein Namen eingetragen ist, sucht er auf der Webseite nach class="st-treff-name" und setzt in "tr-064.0.callmonitor.inbound.callerName" den Namen ein.Das ganze hat einen Haken : Wenn sich die Webseite ändert funktioniert das Ganze nicht mehr.
EDIT : Ich hab gesehen es gibt OPENCNAME. Ich hab da ein Beispiel von einem Response gesehen. Da steht alles drin, auch Dein Geburtstag usw.
Allerdings ist es mir nicht gelungen einen free Account anzulegen. Kaum hatte ich meine Email angegeben, ist die Seite zurückgesprungen.
Dazu gibt es auch ein Artikel
hierin den Zeilen 52 & 56 wird mir "myschedule" unterstrichen - ist da noch etwas nicht in in Ordnung?
ioBroker (since 2018) auf Intel Core i3-5005U NUC und Windwos10 Pro
-
in den Zeilen 52 & 56 wird mir "myschedule" unterstrichen - ist da noch etwas nicht in in Ordnung?
@jb_sullivan ja, auweih.
setz mal ein var davor -
in den Zeilen 52 & 56 wird mir "myschedule" unterstrichen - ist da noch etwas nicht in in Ordnung?
@jb_sullivan sagte: "myschedule" unterstrichen - ist da noch etwas nicht in in Ordnung?
Setze ein const oder var vor die Deklaration (Zeile 52).
-
Wer von Euch beiden hat nun recht?

ioBroker (since 2018) auf Intel Core i3-5005U NUC und Windwos10 Pro
-
Wer von Euch beiden hat nun recht?
@jb_sullivan kannst auch const schreiben. In JS ist allerdings const keine Konstante mit konstanten Wert sondert der Typ ist konstant. Das nur zur Verwirrung

Sag mir bitte Bescheid, wenn alles durch ist. Dann änder ich das noch im GIT.
Danke für die Mitarbeit
-
@jb_sullivan kannst auch const schreiben. In JS ist allerdings const keine Konstante mit konstanten Wert sondert der Typ ist konstant. Das nur zur Verwirrung
Sag mir bitte Bescheid, wenn alles durch ist. Dann änder ich das noch im GIT.
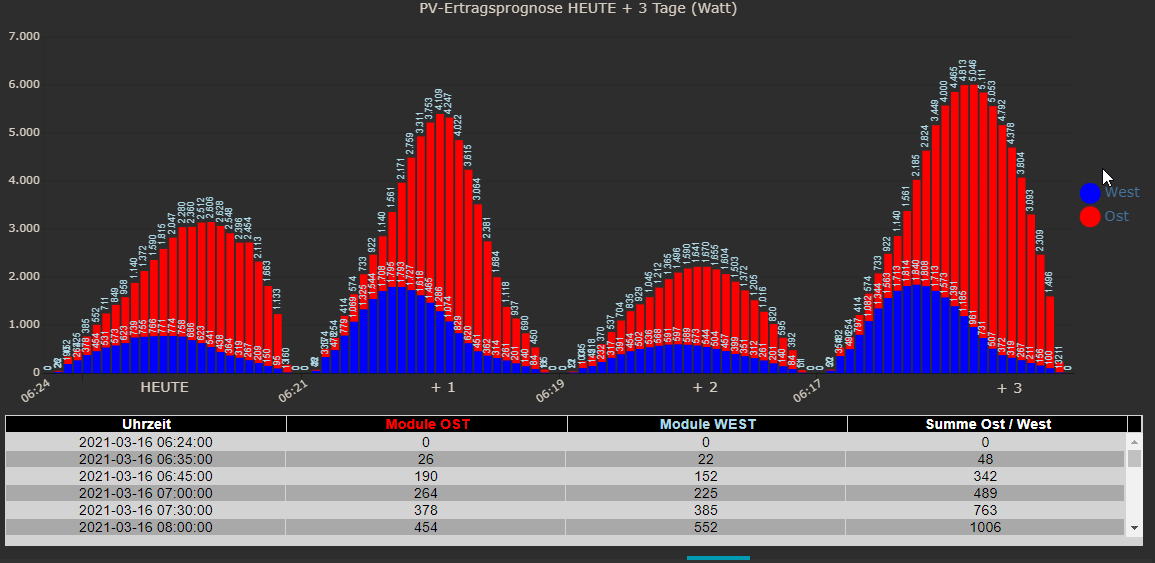
Danke für die MitarbeitIch bin gerade noch am suchen, warum OST und WEST im Grafpgen falsch herum dargestellt werden. Die Farben in der Legende sind richtig, aber im Graphen nicht.
Die mit den höheren Werten müssten blau (WEST) sein.
ioBroker (since 2018) auf Intel Core i3-5005U NUC und Windwos10 Pro
-
Ich bin gerade noch am suchen, warum OST und WEST im Grafpgen falsch herum dargestellt werden. Die Farben in der Legende sind richtig, aber im Graphen nicht.
Die mit den höheren Werten müssten blau (WEST) sein.
@jb_sullivan hab gesehen :
90° ist west , -90° ist ost.
Also entweder Du drehstconst legendTest = ["Ost","West"];um oder
Du drehstconst declination = ['40','40']; const azimuth = ['90','-90']; const kwp = ['7.26','2.64'];in
const declination = ['40','40'];
const azimuth = ['-90','90'];
const kwp = ['2.64','7.26'];
Dann sollte Ost als erstes kommen
-
@jb_sullivan hab gesehen :
90° ist west , -90° ist ost.
Also entweder Du drehstconst legendTest = ["Ost","West"];um oder
Du drehstconst declination = ['40','40']; const azimuth = ['90','-90']; const kwp = ['7.26','2.64'];in
const declination = ['40','40'];
const azimuth = ['-90','90'];
const kwp = ['2.64','7.26'];
Dann sollte Ost als erstes kommen
OK - nun passt alles.
Hier nochmal der Finale Code zum abgleich
/* read solar forecasts for 2 different orientations
Author : gargano
Display in VIS : use JSON Chart from Scrounger
Version 1.0.1
Last Update 16.3.2021
Change history :
1.0.1 / 16.3.2021   :   use setStateAsync(myUrl.mySolarJSON.. to avoid time conflicts
                        dp's are now saved in '0_userdata.0.'
                        use variables for setting lat, lon, color..
*/

const prefix = 'javascript.0.';

const SolarJSON1            = prefix+"SolarForecast.JSON1";
const SolarJSON2            = prefix+"SolarForecast.JSON2";
const SolarJSONAll1         = prefix+"SolarForecast.JSONAll1";
const SolarJSONAll2         = prefix+"SolarForecast.JSONAll2";
const SolarJSONGraphAll1    = prefix+"SolarForecast.JSONGraphAll1";
const SolarJSONGraphAll2    = prefix+"SolarForecast.JSONGraphAll2";
const SolarJSONTable        = prefix+"SolarForecast.JSONTable";
const SolarJSONGraph        = prefix+"SolarForecast.JSONGraph";

const createStateList = [
    {name :SolarJSON1, type:"string", role : "value"},
    {name :SolarJSON2, type:"string", role : "value"},
    {name :SolarJSONAll1, type:"string", role : "value"},
    {name :SolarJSONAll2, type:"string", role : "value"},
    {name :SolarJSONGraphAll1, type:"string", role : "value"},
    {name :SolarJSONGraphAll2, type:"string", role : "value"},
    {name :SolarJSONTable, type:"string", role : "value"},
    {name :SolarJSONGraph, type:"string", role : "value"}
]

// create states if not exists
async function createMyState(item) {
    if (!existsState(item.name)) {
    await createStateAsync(item.name, {
            type: item.type,
            min: 0,
            def: 0,
            role: item.role
        });
    }
}

async function makeMyStateList (array) {
    // map array to promises
    const promises = array.map(createMyState);
    await Promise.all(promises);
}

var mySchedule = '0,30 * * * *';

async function main () {
    await makeMyStateList(createStateList);
    schedule(mySchedule, getSolar );
    getSolar();
}

main();

// set logging = true for logging
const logging = true;

var request = require('request');


/* https://api.forecast.solar/estimate/:lat/:lon/:dec/:az/:kwp
lat - latitude of location, -90 (south) … 90 (north)
lon - longitude of location, -180 (west) … 180 (east)
dec - plane declination, 0 (horizontal) … 90 (vertical)
az - plane azimuth, -180 … 180 (-180 = north, -90 = east, 0 = south, 90 = west, 180 = north)
kwp - installed modules power in kilo watt
*/

// set lat and lon for the destination
const lat = 'xx.yyyy'
const lon = 'xx.yyy'

const forcastUrl = 'https://api.forecast.solar';

// if use the api key remove '//' and insert '//' in front of const api = '';
//const api = '/xxxxxxxxxxxxxxxx;
// else
const api = '/xxxxxxxxxx';

const declination = ['40','40'];
const azimuth = ['-90','90'];
const kwp = ['7.26','2.64'];

var options1 = {url: forcastUrl+api+'/estimate/'+lat+'/'+lon+'/'+declination[0]+'/'+azimuth[0]+'/'+kwp[0], method: 'GET', headers: { 'User-Agent': 'request' }};
var options2 = {url: forcastUrl+api+'/estimate/'+lat+'/'+lon+'/'+declination[1]+'/'+azimuth[1]+'/'+kwp[1], method: 'GET', headers: { 'User-Agent': 'request' }};

const legendTest = ["West","Ost"];
const graphColor = ["blue","red"];
const datalabelColor = ["lightblue","lightblue"];

const tooltip_AppendText= " Watt";

var urls = [
  {myUrl:options1,mySolarJSON:SolarJSON1,mySolarJSONAll:SolarJSONAll1,mySolarJSONGraphAll:SolarJSONGraphAll1},
  {myUrl:options2,mySolarJSON:SolarJSON2,mySolarJSONAll:SolarJSONAll2,mySolarJSONGraphAll:SolarJSONGraphAll2}
]


// handle the request : convert the result to table and graph
function myAsyncRequest(myUrl) {
  log('Request '+myUrl.myUrl.url);
  return new Promise((resolve, reject) => {
     request(myUrl.myUrl.url, async function(error, response, body) {
        if (!error && response.statusCode == 200) {
            if (logging) console.log ('body : '+body);
            let watts = JSON.parse(body).result.watts;
            setState(myUrl.mySolarJSONAll, JSON.stringify(watts), true);
            let table = [];
            for(let time in watts) {
                    let entry = {};
                    entry.Uhrzeit = time;
                    entry.Leistung = watts[time];
                    table.push(entry);
            }
            if (logging) console.log ('JSON: '+myUrl.mySolarJSON);
            await setStateAsync(myUrl.mySolarJSON, JSON.stringify(table), true);

            // make GraphTable
            let graphTimeData = [];
                 for(let time in watts) {
                    let graphEntry ={};
                    graphEntry.t = Date.parse(time);
                    graphEntry.y = watts[time];
                    graphTimeData.push(graphEntry);
            }
            var graph = {};
            var graphData ={};
            var graphAllData = [];
            graphData.data = graphTimeData;
            graphAllData.push(graphData);
            graph.graphs=graphAllData;
            setState(myUrl.mySolarJSONGraphAll, JSON.stringify(graph), true);

            resolve (body);
        } else
            reject(new Error("Could not load " + myUrl.myUrl.url+' Error '+error +'Status '+ response.statusCode));
    });
  })
}


// summarize the single watts results to table and graph
function makeTable () {
    if (logging) console.log ('MakeTable');
    let watts1 = JSON.parse(getState(SolarJSON1).val);
    let watts2 = JSON.parse(getState(SolarJSON2).val);
    if (logging) console.log ('Items: '+watts1.length);
    let table = [];
	let axisLabels = [];

    // make table
    for(var n=0;n<watts1.length;n++) {
            let entry = {};
            entry.Uhrzeit = watts1[n].Uhrzeit;
            entry.Leistung1 = watts1[n].Leistung;
            entry.Leistung2 = watts2[n].Leistung;
            entry.Summe = watts1[n].Leistung + watts2[n].Leistung;
            table.push(entry);
    }

    // prepare data for graph
	let graphTimeData1 = [];
    for(var n=0;n<watts1.length;n++) {
    	graphTimeData1.push(watts1[n].Leistung);
        let time = watts1[n].Uhrzeit.substr(11,5);
        axisLabels.push(time);
    }

	let graphTimeData2 = [];
    for(var n=0;n<watts2.length;n++) {
   		graphTimeData2.push(watts2[n].Leistung);
    }

    // make total graph
    var graph = {};
    var graphAllData = [];
    var graphData = {"tooltip_AppendText":  tooltip_AppendText,"legendText": legendTest[0],"yAxis_id": 1,"type": "bar","displayOrder": 2,"barIsStacked": true,"color":graphColor[0],"barStackId":1,"datalabel_rotation":-90,"datalabel_color":datalabelColor[0],"datalabel_fontSize":10};
    graphData.data = graphTimeData1;
    graphAllData.push(graphData);
	graphData = {"tooltip_AppendText": tooltip_AppendText,"legendText": legendTest[1],"yAxis_id": 1,"type": "bar","displayOrder": 1,"barIsStacked": true,"color":graphColor[1],"barStackId":1,"datalabel_rotation":-90,"datalabel_color":datalabelColor[1],"datalabel_fontSize":10};
    graphData.data = graphTimeData2;
    graphAllData.push(graphData);
    graph.graphs=graphAllData;
	graph.axisLabels =  axisLabels;
    setState(SolarJSONTable, JSON.stringify(table), true);
    setState(SolarJSONGraph, JSON.stringify(graph), true);
}

// get the requests
async function getSolar() {
   let promises = urls.map(myAsyncRequest);
   await Promise.all(promises)
    .then(function(bodys) {
        if (logging) console.log("All url loaded");
        makeTable();
    })
    .catch(error => {
        console.log('Error : '+error)
    })
}
ioBroker (since 2018) auf Intel Core i3-5005U NUC und Windwos10 Pro
-
OK - nun passt alles.
Hier nochmal der Finale Code zum abgleich
/* read solar forecasts for 2 different orientations Author : gargano Display in VIS : use JSON Chart from Scrounger Version 1.0.1 Last Update 16.3.2021 Change history : 1.0.1 / 16.3.2021 : use setStateAsync(myUrl.mySolarJSON.. to avoid time conflicts dp's are now saved in '0_userdata.0.' use variables for setting lat, lon, color.. */ const prefix = 'javascript.0.'; const SolarJSON1 = prefix+"SolarForecast.JSON1"; const SolarJSON2 = prefix+"SolarForecast.JSON2"; const SolarJSONAll1 = prefix+"SolarForecast.JSONAll1"; const SolarJSONAll2 = prefix+"SolarForecast.JSONAll2"; const SolarJSONGraphAll1 = prefix+"SolarForecast.JSONGraphAll1"; const SolarJSONGraphAll2 = prefix+"SolarForecast.JSONGraphAll2"; const SolarJSONTable = prefix+"SolarForecast.JSONTable"; const SolarJSONGraph = prefix+"SolarForecast.JSONGraph"; const createStateList = [ {name :SolarJSON1, type:"string", role : "value"}, {name :SolarJSON2, type:"string", role : "value"}, {name :SolarJSONAll1, type:"string", role : "value"}, {name :SolarJSONAll2, type:"string", role : "value"}, {name :SolarJSONGraphAll1, type:"string", role : "value"}, {name :SolarJSONGraphAll2, type:"string", role : "value"}, {name :SolarJSONTable, type:"string", role : "value"}, {name :SolarJSONGraph, type:"string", role : "value"} ] // create states if not exists async function createMyState(item) { if (!existsState(item.name)) { await createStateAsync(item.name, { type: item.type, min: 0, def: 0, role: item.role }); } } async function makeMyStateList (array) { // map array to promises const promises = array.map(createMyState); await Promise.all(promises); } var mySchedule = '0,30 * * * *'; async function main () { await makeMyStateList(createStateList); schedule(mySchedule, getSolar ); getSolar(); } main(); // set logging = true for logging const logging = true; var request = require('request'); /* https://api.forecast.solar/estimate/:lat/:lon/:dec/:az/:kwp lat - latitude of location, -90 (south) … 90 (north) lon - longitude of location, -180 (west) … 180 (east) dec - plane declination, 0 (horizontal) … 90 (vertical) az - plane azimuth, -180 … 180 (-180 = north, -90 = east, 0 = south, 90 = west, 180 = north) kwp - installed modules power in kilo watt */ // set lat and lon for the destination const lat = 'xx.yyyy' const lon = 'xx.yyy' const forcastUrl = 'https://api.forecast.solar'; // if use the api key remove '//' and insert '//' in front of const api = ''; //const api = '/xxxxxxxxxxxxxxxx; // else const api = '/xxxxxxxxxx'; const declination = ['40','40']; const azimuth = ['-90','90']; const kwp = ['7.26','2.64']; var options1 = {url: forcastUrl+api+'/estimate/'+lat+'/'+lon+'/'+declination[0]+'/'+azimuth[0]+'/'+kwp[0], method: 'GET', headers: { 'User-Agent': 'request' }}; var options2 = {url: forcastUrl+api+'/estimate/'+lat+'/'+lon+'/'+declination[1]+'/'+azimuth[1]+'/'+kwp[1], method: 'GET', headers: { 'User-Agent': 'request' }}; const legendTest = ["West","Ost"]; const graphColor = ["blue","red"]; const datalabelColor = ["lightblue","lightblue"]; const tooltip_AppendText= " Watt"; var urls = [ {myUrl:options1,mySolarJSON:SolarJSON1,mySolarJSONAll:SolarJSONAll1,mySolarJSONGraphAll:SolarJSONGraphAll1}, {myUrl:options2,mySolarJSON:SolarJSON2,mySolarJSONAll:SolarJSONAll2,mySolarJSONGraphAll:SolarJSONGraphAll2} ] // handle the request : convert the result to table and graph function myAsyncRequest(myUrl) { log('Request '+myUrl.myUrl.url); return new Promise((resolve, reject) => { request(myUrl.myUrl.url, async function(error, response, body) { if (!error && response.statusCode == 200) { if (logging) console.log ('body : '+body); let watts = JSON.parse(body).result.watts; setState(myUrl.mySolarJSONAll, JSON.stringify(watts), true); let table = []; for(let time in watts) { let entry = {}; entry.Uhrzeit = time; entry.Leistung = watts[time]; table.push(entry); } if (logging) console.log ('JSON: '+myUrl.mySolarJSON); await setStateAsync(myUrl.mySolarJSON, JSON.stringify(table), true); // make GraphTable let graphTimeData = []; for(let time in watts) { let graphEntry ={}; graphEntry.t = Date.parse(time); graphEntry.y = watts[time]; graphTimeData.push(graphEntry); } var graph = {}; var graphData ={}; var graphAllData = []; graphData.data = graphTimeData; graphAllData.push(graphData); graph.graphs=graphAllData; setState(myUrl.mySolarJSONGraphAll, JSON.stringify(graph), true); resolve (body); } else reject(new Error("Could not load " + myUrl.myUrl.url+' Error '+error +'Status '+ response.statusCode)); }); }) } // summarize the single watts results to table and graph function makeTable () { if (logging) console.log ('MakeTable'); let watts1 = JSON.parse(getState(SolarJSON1).val); let watts2 = JSON.parse(getState(SolarJSON2).val); if (logging) console.log ('Items: '+watts1.length); let table = []; let axisLabels = []; // make table for(var n=0;n<watts1.length;n++) { let entry = {}; entry.Uhrzeit = watts1[n].Uhrzeit; entry.Leistung1 = watts1[n].Leistung; entry.Leistung2 = watts2[n].Leistung; entry.Summe = watts1[n].Leistung + watts2[n].Leistung; table.push(entry); } // prepare data for graph let graphTimeData1 = []; for(var n=0;n<watts1.length;n++) { graphTimeData1.push(watts1[n].Leistung); let time = watts1[n].Uhrzeit.substr(11,5); axisLabels.push(time); } let graphTimeData2 = []; for(var n=0;n<watts2.length;n++) { graphTimeData2.push(watts2[n].Leistung); } // make total graph var graph = {}; var graphAllData = []; var graphData = {"tooltip_AppendText": tooltip_AppendText,"legendText": legendTest[0],"yAxis_id": 1,"type": "bar","displayOrder": 2,"barIsStacked": true,"color":graphColor[0],"barStackId":1,"datalabel_rotation":-90,"datalabel_color":datalabelColor[0],"datalabel_fontSize":10}; graphData.data = graphTimeData1; graphAllData.push(graphData); graphData = {"tooltip_AppendText": tooltip_AppendText,"legendText": legendTest[1],"yAxis_id": 1,"type": "bar","displayOrder": 1,"barIsStacked": true,"color":graphColor[1],"barStackId":1,"datalabel_rotation":-90,"datalabel_color":datalabelColor[1],"datalabel_fontSize":10}; graphData.data = graphTimeData2; graphAllData.push(graphData); graph.graphs=graphAllData; graph.axisLabels = axisLabels; setState(SolarJSONTable, JSON.stringify(table), true); setState(SolarJSONGraph, JSON.stringify(graph), true); } // get the requests async function getSolar() { let promises = urls.map(myAsyncRequest); await Promise.all(promises) .then(function(bodys) { if (logging) console.log("All url loaded"); makeTable(); }) .catch(error => { console.log('Error : '+error) }) } -
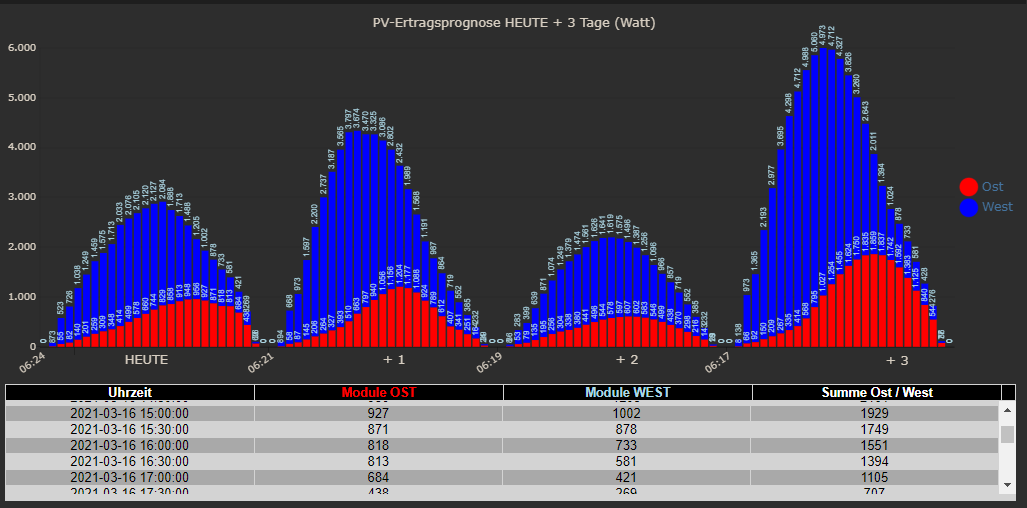
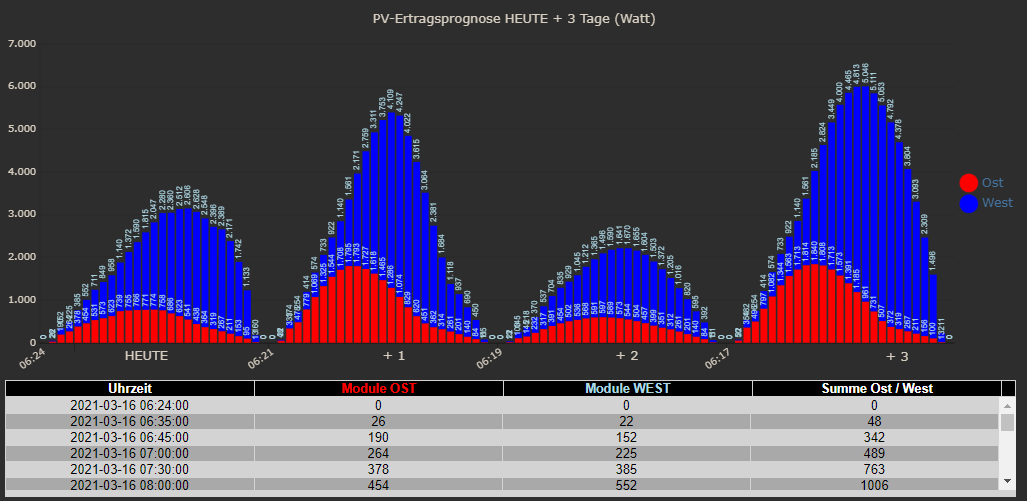
@jb_sullivan Dann wäre Dein Panel West das mit 7,26 kW und Dein Ost mit 2.64 kW.
Wie passt dann die Ausrichtung -90 und 90 Azimuth zu West und Ost ?
Genau die Modulleistungen sind so wie du sagst, aber was meinst du mit den Himmelsrichtungen?
Passt doch / -90 =Ost - 90=West
az - plane azimuth, -180 … 180 (-180 = north, -90 = east, 0 = south, 90 = west, 180 = north)Also Passt im Sinne das Diagramm ist richtig. Ostseite weniger Ertrag als die Westseite
ioBroker (since 2018) auf Intel Core i3-5005U NUC und Windwos10 Pro
-
Genau die Modulleistungen sind so wie du sagst, aber was meinst du mit den Himmelsrichtungen?
Passt doch / -90 =Ost - 90=West
az - plane azimuth, -180 … 180 (-180 = north, -90 = east, 0 = south, 90 = west, 180 = north)Also Passt im Sinne das Diagramm ist richtig. Ostseite weniger Ertrag als die Westseite
@jb_sullivan In der LegendText
const legendTest = ["West","Ost"];kommt als erstes "West" dann "Ost"
in Azimuth kommt als erstesconst azimuth = ['-90','90'];-90 ,also Ost
Also Passt im Sinne das Diagramm ist richtig. Ostseite weniger Ertrag als die Westseite
Dann müsste umgekehrt sein
const kwp = ['2.64','7.26'];
const legendTest = ["Ost","West"];
Vom Ertrag her gleich aber logisch jetzt richtig.
Der 1. Response ist Ost (-90), dann West (90) -
@jb_sullivan In der LegendText
const legendTest = ["West","Ost"];kommt als erstes "West" dann "Ost"
in Azimuth kommt als erstesconst azimuth = ['-90','90'];-90 ,also Ost
Also Passt im Sinne das Diagramm ist richtig. Ostseite weniger Ertrag als die Westseite
Dann müsste umgekehrt sein
const kwp = ['2.64','7.26'];
const legendTest = ["Ost","West"];
Vom Ertrag her gleich aber logisch jetzt richtig.
Der 1. Response ist Ost (-90), dann West (90)UPS - jetzt sehe ich es auch
OST Richtig
OST Falsch
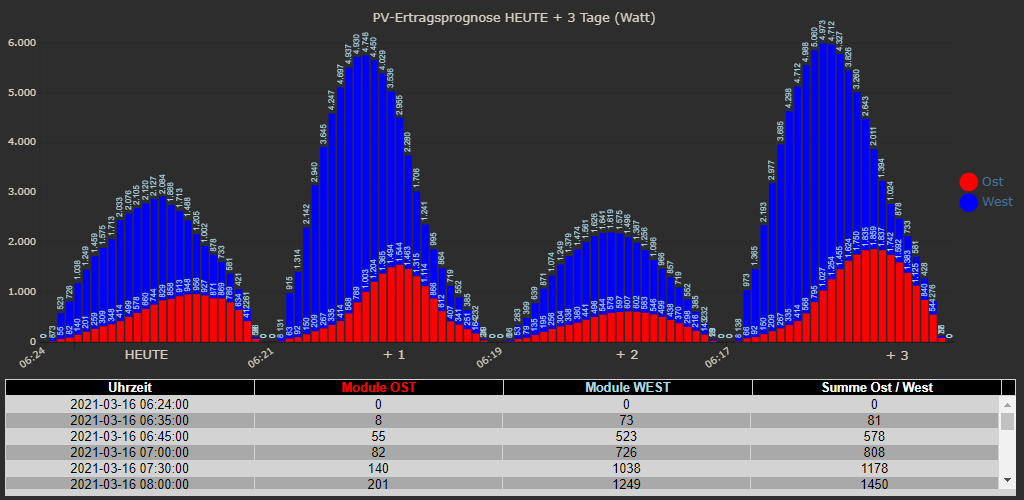
Auch der Ertrag ist auf addiert unterschiedlich. Kleines Zeichen große Wirkung.
-
Hallo,
bin gerade dran einen Adapter zu schreiben. Denke die Grundfunktione sind drin, allerdings keine Anlagen addition oder Grafiken.
@gargano Hast du schon Adapter programmiert?
@patrickwalther sagte in Forecast.solar mit dem Systeminfo Adapter:
Hast du schon Adapter programmiert?
Nicht von Anfang an, hab beim Resol Adapter mitgemacht.
Hast Du den Adapter auf GIT ? -
@patrickwalther sagte in Forecast.solar mit dem Systeminfo Adapter:
Hast du schon Adapter programmiert?
Nicht von Anfang an, hab beim Resol Adapter mitgemacht.
Hast Du den Adapter auf GIT ?@gargano habe leider noch Problem den umzubenennen und auf Github zu bringen.
Für den Befehl "gulp rename ... " fehlt mir eine Datei. Habe das ganze nach dem Youtube Video Luftdaten aufgestetzt der Adapter funktioniert bisher nur auf meinem PI.Verusch das ganze später nochmal nach der Anleitung:
https://forum.iobroker.net/assets/uploads/files/282_entwickler_howto_v0.2.pdfVielleicht hast du ne Idee.
-
@gargano habe leider noch Problem den umzubenennen und auf Github zu bringen.
Für den Befehl "gulp rename ... " fehlt mir eine Datei. Habe das ganze nach dem Youtube Video Luftdaten aufgestetzt der Adapter funktioniert bisher nur auf meinem PI.Verusch das ganze später nochmal nach der Anleitung:
https://forum.iobroker.net/assets/uploads/files/282_entwickler_howto_v0.2.pdfVielleicht hast du ne Idee.
@patrickwalther ich mach es immer so (unter Windows):
Leeres, neues Repo in Github erzeugen.
Clonen. Files in Directories kopieren.
Adden und Push mit Tortoise GIT -
@paul53 log (info.result)
{'watts':{'2020-12-15 07:49:00':0,'2020-12-15 08:25:00':80,'2020-12-15 09:00:00':590,'2020-12-15 10:00:00':1230,'2020-12-15 11:00:00':1810,'2020-12-15 12:00:00':2040,'2020-12-15 13:00:00':1560,'2020-12-15 14:00:00':1120,'2020-12-15 15:00:00':570,'2020-12-15 15:41:00':80,'2020-12-15 16:22:00':0,'2020-12-16 07:50:00':0,'2020-12-16 08:25:00':60,'2020-12-16 09:00:00':380,'2020-12-16 10:00:00':770,'2020-12-16 11:00:00':1140,'2020-12-16 12:00:00':1400,'2020-12-16 13:00:00':1360,'2020-12-16 14:00:00':1080,'2020-12-16 15:00:00':560,'2020-12-16 15:41:00':80,'2020-12-16 16:22:00':0},'watt_hours':{'2020-12-15 07:49:00':0,'2020-12-15 08:25:00':50,'2020-12-15 09:00:00':390,'2020-12-15 10:00:00':1620,'2020-12-15 11:00:00':3430,'2020-12-15 12:00:00':5470,'2020-12-15 13:00:00':7030,'2020-12-15 14:00:00':8150,'2020-12-15 15:00:00':8720,'2020-12-15 15:41:00':8780,'2020-12-15 16:22:00':8780,'2020-12-16 07:50:00':0,'2020-12-16 08:25:00':40,'2020-12-16 09:00:00':260,'2020-12-16 10:00:00':1030,'2020-12-16 11:00:00':2170,'2020-12-16 12:00:00':3570,'2020-12-16 13:00:00':4930,'2020-12-16 14:00:00':6010,'2020-12-16 15:00:00':6570,'2020-12-16 15:41:00':6620,'2020-12-16 16:22:00':6620},'watt_hours_day':{'2020-12-15':8780,'2020-12-16':6620}}const options = {url: 'https://api.forecast.solar/estimate/Dein-Lat/Dein-Lon/45/45/10', method: 'GET', headers: { 'User-Agent': 'request' }}; request(options, function(error, response, body) { if (!error && response.statusCode == 200) { let res = JSON.parse(body).result.watts; // res ist ein Objekt log(res); } });Hallo,
kann mir jemand sagen wie ich die obigen Daten des aktuellen Tages morgens um 1 Uhr mit folgendem Code in die InfluxDB bekomme? Ziel ist es in grafana eine Prognose für den Tag zu erstellen.
Die Tabelle kann von der Anzahl und den Zeitstempeln variieren.
Ich denke man muss eine Schleife programmieren die die Daten nacheinander in die DB schreibt.sendTo('influxdb.0', 'storeState', {id: 'PV_Forecast', state: {ts: ZEIT AUS LISTE, val: WERT AUS LISTE, ack: true, from: "javascript.0", q: 0}}); -
@glitzi sagte: Schleife programmieren die die Daten nacheinander in die DB schreibt.
Ja:
for(let key in res) { let ts = new Date(key).getTime(); // ms let watt = res[key]; // in DB schreiben }@paul53
Hallo,
leider bin ich ein absoluter Anfänger was die Programmierung angeht, kannst Du mir bitte den Code etwas zusammen stellen?
Die zuletzt geschrieben Code-Schnipsel habe ich mir nur zusammengesucht, aber verstehen tue ich da noch lange nichts ;-)
Gerade der Teil wo ich die unterschiedlichen Zeit Stempel zerlegen muss, diese können täglich variieren.MfG
-
@paul53
Hallo,
leider bin ich ein absoluter Anfänger was die Programmierung angeht, kannst Du mir bitte den Code etwas zusammen stellen?
Die zuletzt geschrieben Code-Schnipsel habe ich mir nur zusammengesucht, aber verstehen tue ich da noch lange nichts ;-)
Gerade der Teil wo ich die unterschiedlichen Zeit Stempel zerlegen muss, diese können täglich variieren.MfG
@glitzi sagte: Gerade der Teil wo ich die unterschiedlichen Zeit Stempel zerlegen muss, diese können täglich variieren.
Von Datenbanken habe ich keine Ahnung, weshalb ich das Schreiben in die DB nur als Kommentar angegeben habe. Wie muss der Zeitstempel in der InfluxDB vorliegen? In meinem Vorschlag - der direkt nach
let res = JSON.parse(body).result.watts; // res ist ein Objektausgeführt werden muss - werden die Zeiten im Objekt res in ms umgerechnet und stehen in der Variablen ts zur Verfügung.
Hey! Du scheinst an dieser Unterhaltung interessiert zu sein, hast aber noch kein Konto.
Hast du es satt, bei jedem Besuch durch die gleichen Beiträge zu scrollen? Wenn du dich für ein Konto anmeldest, kommst du immer genau dorthin zurück, wo du zuvor warst, und kannst dich über neue Antworten benachrichtigen lassen (entweder per E-Mail oder Push-Benachrichtigung). Du kannst auch Lesezeichen speichern und Beiträge positiv bewerten, um anderen Community-Mitgliedern deine Wertschätzung zu zeigen.
Mit deinem Input könnte dieser Beitrag noch besser werden 💗
Registrieren Anmelden280
Online33.0k
Benutzer83.5k
Themen1.3m
Beiträge