

[Linux Shell-Skript] WLAN-Wetterstation
-
@Petersilie sagte in [Linux Shell-Skript] WLAN-Wetterstation:
Das Skript selbst funktioniert auch und liest die Daten meiner DNT Weatherscreen PRO ein und übergibt diese nach ioBroker.
Danke für die Rückmeldung, auch bzgl. des neuen Stationstypes :)
@SBorg sagte in [Linux Shell-Skript] WLAN-Wetterstation:
@Petersilie sagte in [Linux Shell-Skript] WLAN-Wetterstation:
Das Skript selbst funktioniert auch und liest die Daten meiner DNT Weatherscreen PRO ein und übergibt diese nach ioBroker.
Danke für die Rückmeldung, auch bzgl. des neuen Stationstypes :)
Gerne. Die Anzeige in Grafana funktioniert jetzt auch. Die Typen im influxdb Adapter für die Wetterdaten waren durcheinander und die meisten Daten als String übermittelt. Da funktionierten die Queries nicht mehr.
-
Hallo und erstmal Danke für dieses tolle Projekt.
Ich bin seit ein paar Tagen am testen mit einer froggit hp1000se pro und zusätzlich einen DP100. Als Protokoll ist Ecowitt ausgewählt.
Nach einer kleinen Änderung funktioniert nun auch der Zusatzsensor DP100.
Ich habe in der Zeile 204 von wetterstation.shif [[ ${MESSWERTERAWIN[$i]} =~ ^soilmoisture1[1-8]= ]] auf if [[ ${MESSWERTERAWIN[$i]} =~ ^soilmoisture[1-8]= ]]geändert.
Und in Zeile 188 von wettersation.sub
         if [[ "${MESSWERTE[$i]}" =~ ^soilmoisture[1-8] ]]; then IOBOUT="${IOBOUT}&${PRE_DP}.DP100.${MESSWERTE[$i]:12:1}.Batterie=${MESSWERTE[$(($i+1))]}"; fiin

auf

         if [[ "${MESSWERTE[$i]}" =~ ^soilmoisture[1-8] ]]; then IOBOUT="${IOBOUT}&${PRE_DP}.DP100.${MESSWERTE[$i]:12:1}.Bodenfeuchtigkeit=${MESSWERTE[$(($i+1))]}"; fi
geändert.
Vielleicht ist dieses ja noch ein kleiner Fehler im Code.
DATA von Wetterstation:
PASSKEY=xxxx&stationtype=EasyWeatherV1.4.6&dateutc=2021-01-04+20:28:43&tempinf=42.3&humidityin=74&baromrelin=29.988&baromabsin=29.988&tempf=34.3&humidity=96&winddir=8&winddir_avg10m=18&windspeedmph=1.8&windspdmph_avg10m=1.8&windgustmph=3.4&maxdailygust=9.2&rainratein=0.000&eventrainin=0.000&hourlyrainin=0.000&dailyrainin=0.189&weeklyrainin=0.331&monthlyrainin=0.339&yearlyrainin=0.339&solarradiation=0.00&uv=0&soilmoisture1=23&wh65batt=0&wh25batt=0&soilbatt1=1.5&freq=868M&model=HP1000SE-PRO_Pro_V1.6.7 -
Hallo und erstmal Danke für dieses tolle Projekt.
Ich bin seit ein paar Tagen am testen mit einer froggit hp1000se pro und zusätzlich einen DP100. Als Protokoll ist Ecowitt ausgewählt.
Nach einer kleinen Änderung funktioniert nun auch der Zusatzsensor DP100.
Ich habe in der Zeile 204 von wetterstation.shif [[ ${MESSWERTERAWIN[$i]} =~ ^soilmoisture1[1-8]= ]] auf if [[ ${MESSWERTERAWIN[$i]} =~ ^soilmoisture[1-8]= ]]geändert.
Und in Zeile 188 von wettersation.sub
         if [[ "${MESSWERTE[$i]}" =~ ^soilmoisture[1-8] ]]; then IOBOUT="${IOBOUT}&${PRE_DP}.DP100.${MESSWERTE[$i]:12:1}.Batterie=${MESSWERTE[$(($i+1))]}"; fiin

auf

         if [[ "${MESSWERTE[$i]}" =~ ^soilmoisture[1-8] ]]; then IOBOUT="${IOBOUT}&${PRE_DP}.DP100.${MESSWERTE[$i]:12:1}.Bodenfeuchtigkeit=${MESSWERTE[$(($i+1))]}"; fi
geändert.
Vielleicht ist dieses ja noch ein kleiner Fehler im Code.
DATA von Wetterstation:
PASSKEY=xxxx&stationtype=EasyWeatherV1.4.6&dateutc=2021-01-04+20:28:43&tempinf=42.3&humidityin=74&baromrelin=29.988&baromabsin=29.988&tempf=34.3&humidity=96&winddir=8&winddir_avg10m=18&windspeedmph=1.8&windspdmph_avg10m=1.8&windgustmph=3.4&maxdailygust=9.2&rainratein=0.000&eventrainin=0.000&hourlyrainin=0.000&dailyrainin=0.189&weeklyrainin=0.331&monthlyrainin=0.339&yearlyrainin=0.339&solarradiation=0.00&uv=0&soilmoisture1=23&wh65batt=0&wh25batt=0&soilbatt1=1.5&freq=868M&model=HP1000SE-PRO_Pro_V1.6.7@christian90 sagte in [Linux Shell-Skript] WLAN-Wetterstation:
soilmoisture
Vielen Dank. Das habe ich verbrochen. natürlich muss die 1 bei soilmoisture1 weg und . Es sind blöde cut&paste Fehler. Da ich aber keinen DP100 Sensor habe, konnte ich es auch nicht testen. Wir werden diese Korrekturen in die nächste Version übernehmen.
-
@SBorg sagte in [Linux Shell-Skript] WLAN-Wetterstation:
@Nashra sagte in [Linux Shell-Skript] WLAN-Wetterstation:
Und das war es jetzt? Hat nur die .conf geändert :-)
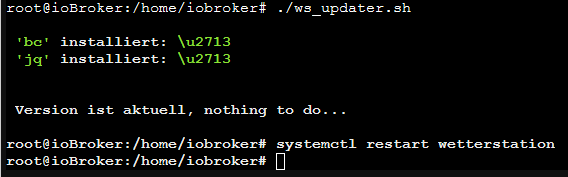
Kannst du bitte mal probieren ob er da bei dir dann den "Haken" anzeigt? Komischerweise zeigt er bei dir den Unicode an...
Direkt 1:1 per C&P:echo -e '✓'Wird angezeigt
@Nashra sagte in [Linux Shell-Skript] WLAN-Wetterstation:
Wird angezeigt
Danke, dann ändere ich es für die nächste Version :)
@Petersilie sagte in [Linux Shell-Skript] WLAN-Wetterstation:
...und die meisten Daten als String übermittelt.
Passiert leider bei "Automatisch" öfters. Ich habe mir angewöhnt es auf Number bzw. String zu stellen.
@christian90 sagte in [Linux Shell-Skript] WLAN-Wetterstation:
Nach einer kleinen Änderung funktioniert nun auch der Zusatzsensor DP100.
So will ich das ab jetzt immer haben. Fehler finden und gleich den passenden Fix mitliefern...


-
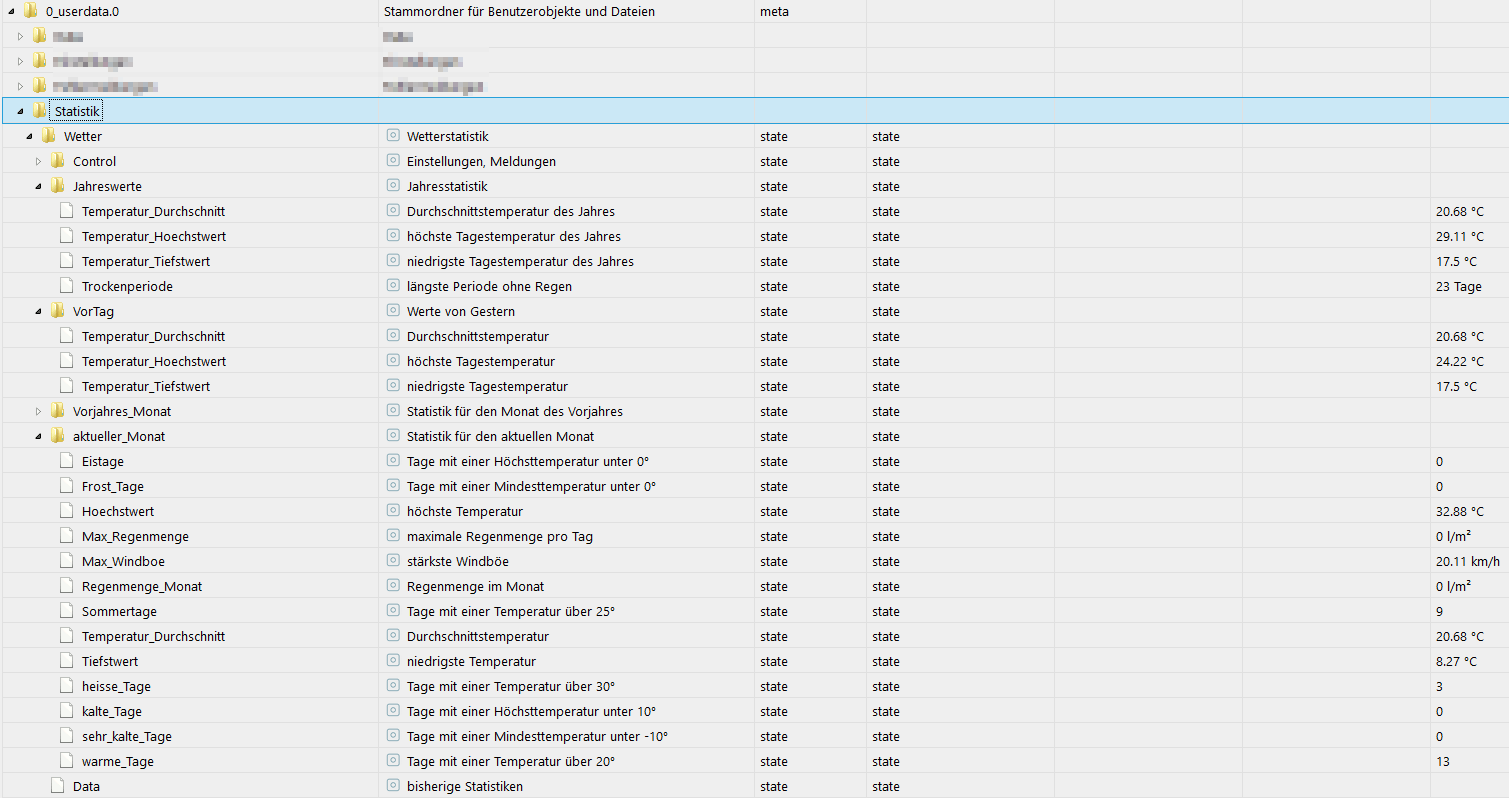
@sonystar sagte in [Linux Shell-Skript] WLAN-Wetterstation:
Eine Frage: Kann ich die Datenpunkte für aktuelle Monats-/Jahresdurchschnittstemperatur manuell anpassen? Wird dann mit dem neuen Wert weitergerechnet?
Ja und ja. Wie mir @Latzi gedanklich auf die Sprünge mit der Gewichtung half, wird dies berücksichtigt. Heute (04.01.) hätten wir einen Monatsdurchschnitt vom 01.01. und 02.01. und einen Tagesdurchschnitt vom 03.01. Somit bekommt der Monatsdurchschnitt eine Gewichtung von 66.6% (er zählt also mehr, da er auch den Durchschnitt von zwei Tagen darstellt), der Tagesdurchschnitt dann die restlichen 33.3%
In Formel: (Monatsdurchschnitt * (aktueller Tag -1) + Tagesdurchschnitt) / aktueller Tag
Beispiel: 1° / 1° / 7° = Durchschnitt 3° [(1°+1°+7°) / 3]Dann wäre nun der bisherige Monatsdurchschnitt für den 1. und 2. Tag =1° [(1°+1°) / 2]
und dann lt. Formel: (1° * (2) + 7°) / 3 = 3°...und mein bisheriger Fehler ohne die Gewichtung (die 1° für den 1. und 2. Tag stimmt da noch, der Fehler summiert sich dann erst ab dem 3. Tag usw. auf): (1° + 7°) / 2 = 4°
-
Massiver Rundumschlag
:Neue Version des Wetterstation-Statistik-Addons auf GitHub V0.1.7
- ~Fix für fehlerhafte/fehlende Speicherung Jahreswerte + Trockenperiode
Wie immer zu finden im GitHub (wetterstation-statistik.js)
Neues Release des WLAN-Shellskriptes auf GitHub V2.0.0
- + Unterstützung des Gateways und Zusatzsensoren (@a200)
- + Protokoll (wunderground oder ecowitt) wählbar
Wie immer zu finden im GitHub
Neues Beta-Release des WLAN-Shellskriptes auf GitHub V2.1.0
- + zusätzliches Protokoll "9" für userspezifische Abfrage
- ~ Fix Reset kumulierte Regenmenge zum Jahresanfang
Wie immer zu finden im GitHub
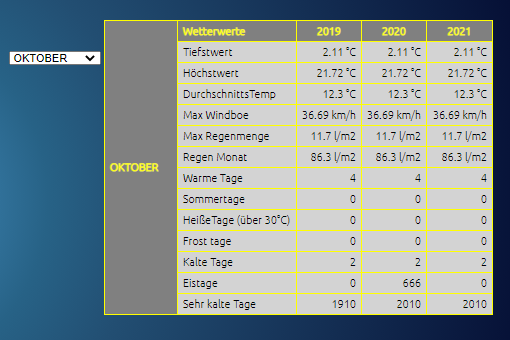
Neue Version des Wetterstation-Statistik-Addons auf GitHub V0.1.8
- +max. Windböe für Gestern und Jahres-/Rekordwerte
Wie immer zu finden im GitHub (wetterstation-statistik.js)
LG SBorg ( SBorg auf GitHub)
Projekte: Lebensmittelwarnung.de | WLAN-Wetterstation | PimpMyStation -
Neue Version des Wetterstation-Statistik-Addons auf GitHub V0.1.8
- +max. Windböe für Gestern und Jahres-/Rekordwerte
Wie immer zu finden im GitHub (wetterstation-statistik.js)
-
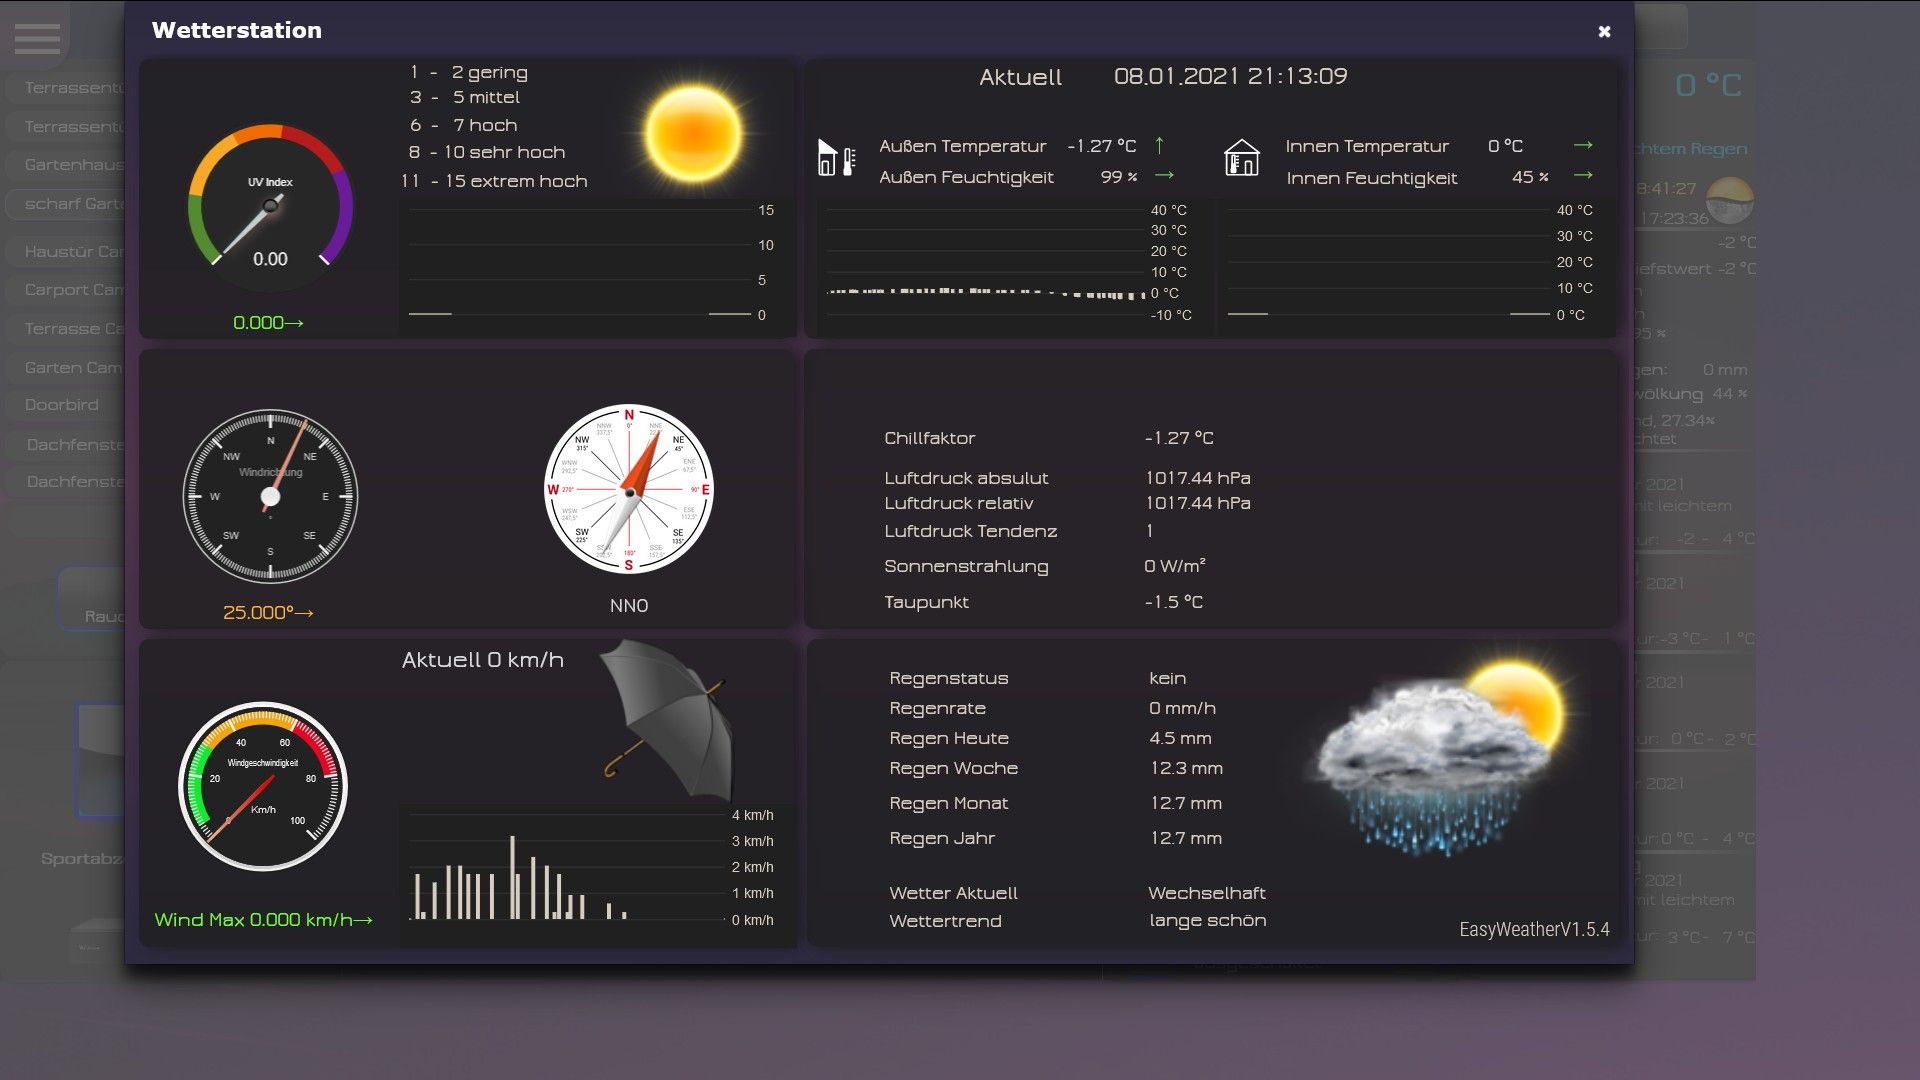
@sonystar sagte in [Linux Shell-Skript] WLAN-Wetterstation:
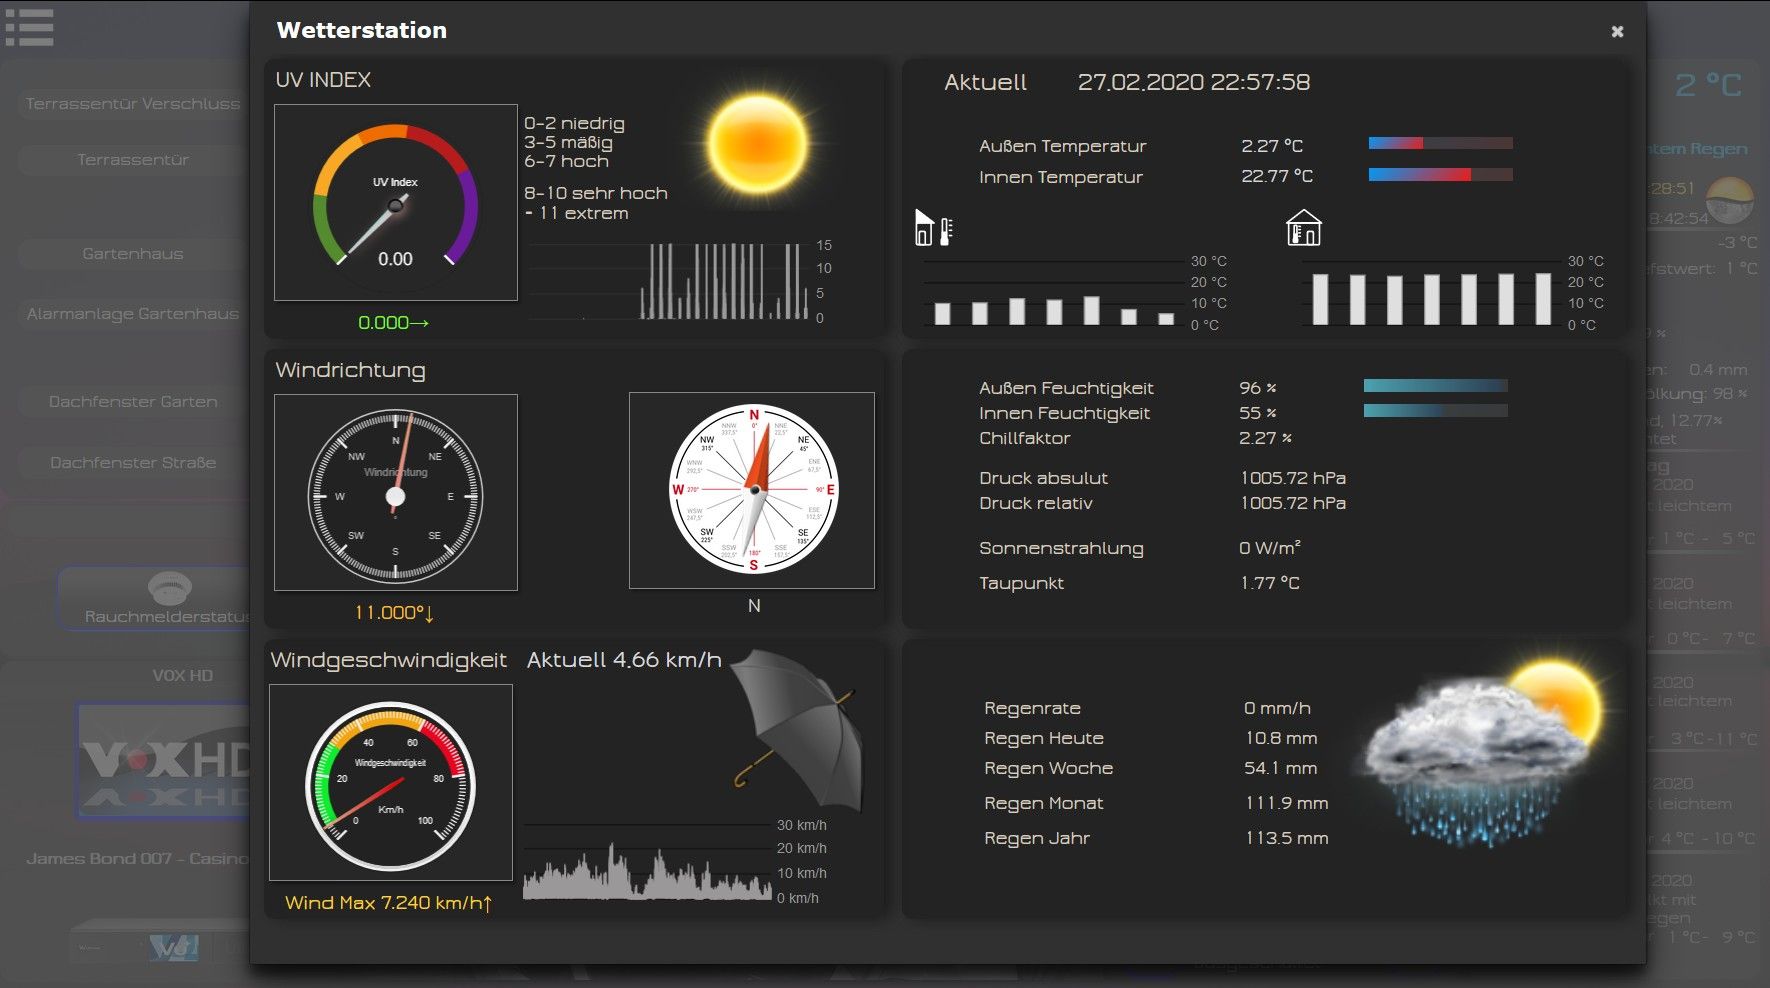
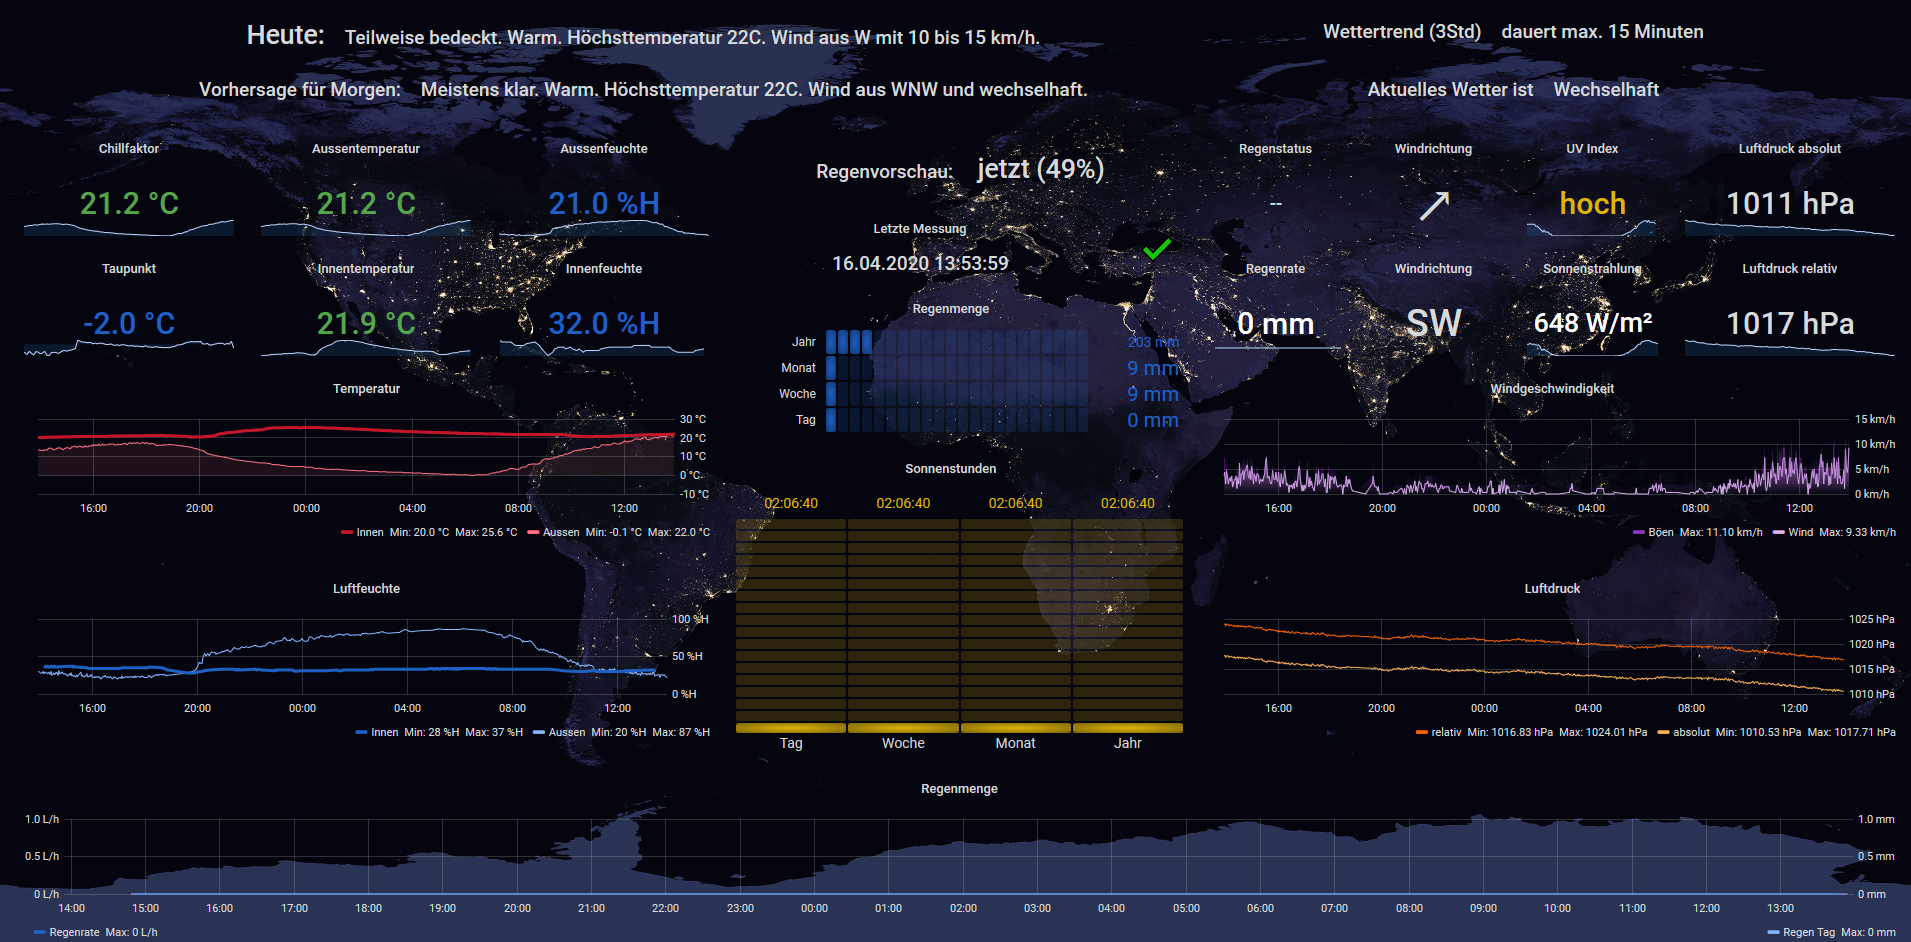
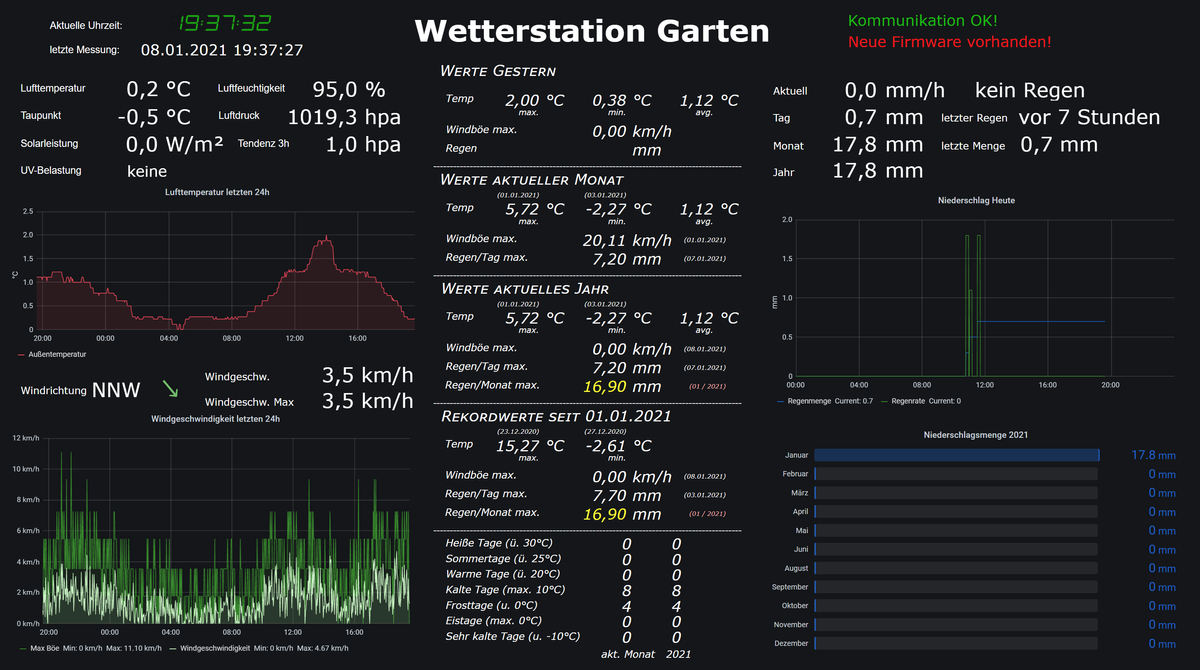
Langsam nimmt meine Visu auch Formen an
schaut gut aus!
Würdest du den mittleren und rechten unteren Teil als Json exportieren?
Oder falls einzeln nicht geht, das ganze Dashboard.Würde gern Teile davon übernehmen.
-
@sonystar sagte in [Linux Shell-Skript] WLAN-Wetterstation:
Langsam nimmt meine Visu auch Formen an
schaut gut aus!
Würdest du den mittleren und rechten unteren Teil als Json exportieren?
Oder falls einzeln nicht geht, das ganze Dashboard.Würde gern Teile davon übernehmen.
-
Danke!
Wenn du mir sagst wie das geht mach ich das gerne.
Rechts unten sind allerdings Datenpunkte aus dem Sourceanalytix-Adapter. -
@sonystar sagte in [Linux Shell-Skript] WLAN-Wetterstation:
Wenn du mir sagst wie das geht mach ich das gerne.
Danke
Rechts unten sind allerdings Datenpunkte aus dem Sourceanalytix-Adapter.
kein Problem. Damit logge ich auch.
-
@Negalein
Hier (hoffentlich) das JSON für das Diagramm unten rechts.
Die Visu ist allerdings in VIS aufgebaut, nur die Diagramme kommen aus Grafana.
-
@sonystar sagte in [Linux Shell-Skript] WLAN-Wetterstation:
Hier (hoffentlich) das JSON für das Diagramm unten rechts.
Danke, hat geklappt! :)
Schaffst du den mittleren Teil auch noch? -
Wie gesagt, die Visu ist in VIS, nur die Diagramme kommen aus Grafana.
Kann dir gerne den View exportieren wenn du das möchtest? -
@sonystar sagte in [Linux Shell-Skript] WLAN-Wetterstation:
Wie gesagt, die Visu ist in VIS, nur die Diagramme kommen aus Grafana.
Ah, jetzt versteh ich! :)
Kann dir gerne den View exportieren wenn du das möchtest?
Ja bitte
-
Hier der View aus VIS
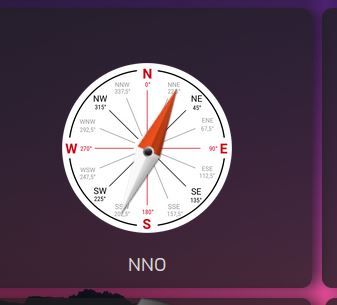
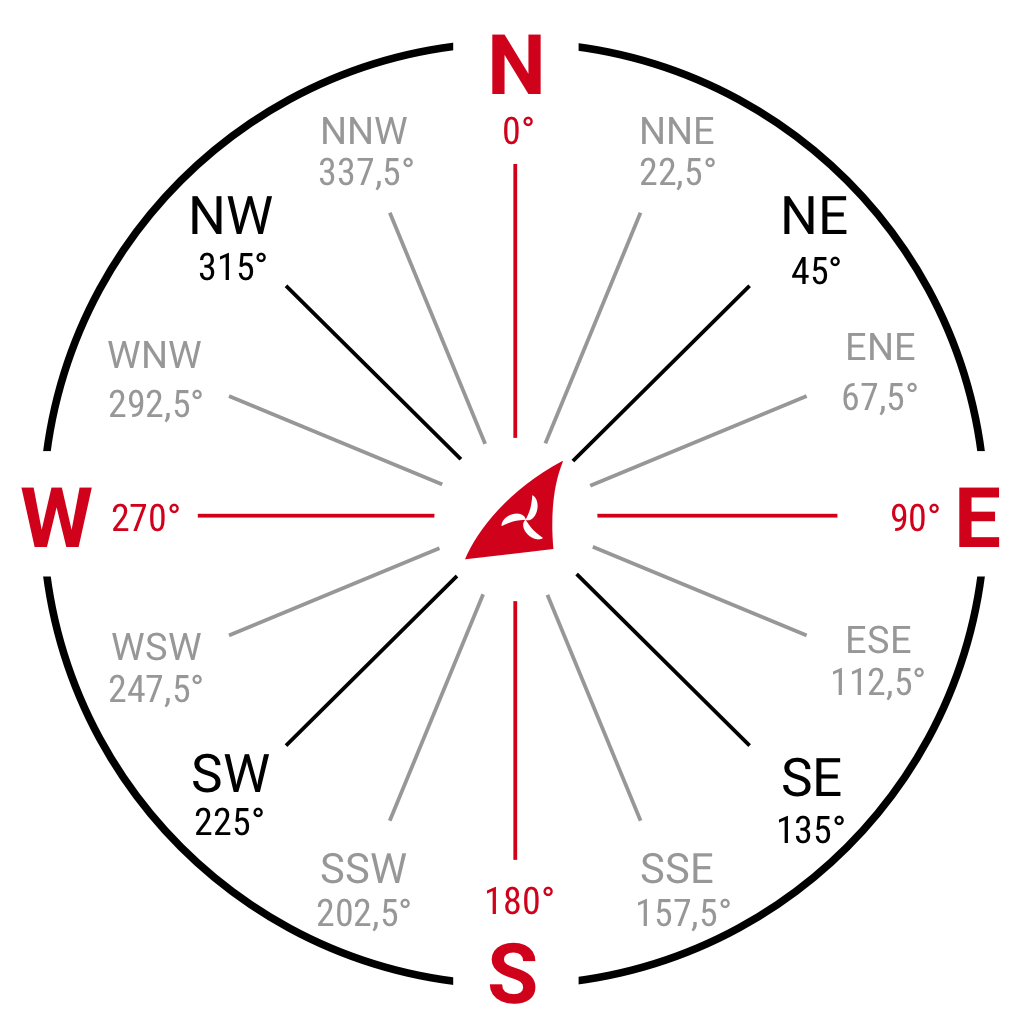
Mir gefällt die Windrose noch nicht, da hätte ich gerne so etwas wie @Glasfaser z.B., aber in Vis. Bin da noch nicht so richtig dahintergestiegen.
-
@Glasfaser Wenn du so freundlich wärst? Kommt das aus VIS oder Grafana?
-
-
Dann bitte ja

Synology 918+ 16GB - ioBroker in Docker v9 , VISO auf Trekstor Primebook C13 13,3" , Hikvision Domkameras mit Surveillance Station .. CCU RaspberryMatic in Synology VM .. Zigbee CC2538+CC2592 .. Sonoff .. KNX .. Modbus ..


Hey! Du scheinst an dieser Unterhaltung interessiert zu sein, hast aber noch kein Konto.
Hast du es satt, bei jedem Besuch durch die gleichen Beiträge zu scrollen? Wenn du dich für ein Konto anmeldest, kommst du immer genau dorthin zurück, wo du zuvor warst, und kannst dich über neue Antworten benachrichtigen lassen (entweder per E-Mail oder Push-Benachrichtigung). Du kannst auch Lesezeichen speichern und Beiträge positiv bewerten, um anderen Community-Mitgliedern deine Wertschätzung zu zeigen.
Mit deinem Input könnte dieser Beitrag noch besser werden 💗
Registrieren AnmeldenSupport us
398
Online33.0k
Benutzer83.4k
Themen1.3m
Beiträge