NEWS


Test eCharts Adapter
-
Nachdem es bei mir Dank Bluefox' unermüdlichem Einsatz auch auf dem alten Cubietruck wieder läuft und jetzt die 0.4.9 da ist, habe ich mich mal wieder etwas mit dem Adapter beschäftigt.
Auch bei mir sind es einige Luxus"probleme".
- Bei Aufruf eines Datenpunktes ohne preset ist die Form des Graphen immer Linie, egal was man oben einstellt
- Ebenso ist das Datum dann immer anscheinend US-Format AM/PM ohne dass dieses angezeigt wird. Eben nur
3:48 - Im preset lässt sich dann alles korrekt einstellen, wobei bei Standard-Zeitformat auch
3:49angezeigt wird - Wenn man gezoomt hat fehlt mir der resetbutton aus flot
- In den Einstellungen der Optionen steht
Nullen ausblenden- gemeint sind sicher
null-Werte, zumindest verschwinden diese
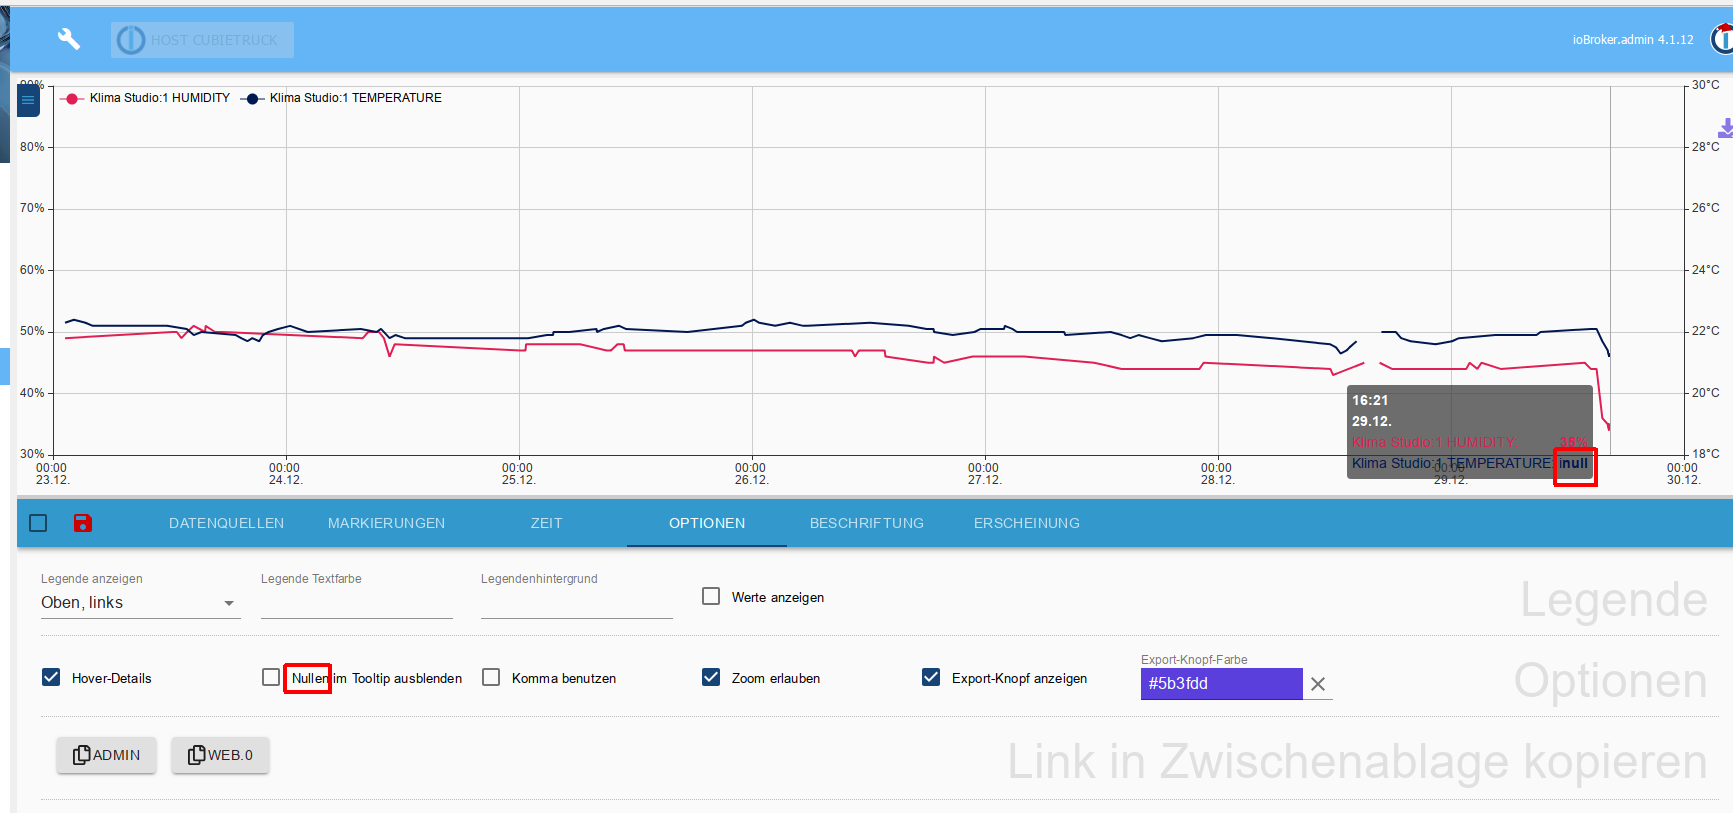
- gemeint sind sicher
- besteht die Möglichkeit im Tooltip -ähnlich der Legende- einen Color-Dot zu nehmen und den Text in einer "lesbaren" Farbe, wie bei der Zeit?
- kann man die Legende ggf. auch mehrspaltig anzeigen?
Wie gesagt - alles Luxusproblem!
:fireworks: guten Rutsch! :fireworks:
@Bluefox , @all
Guten Morgen,
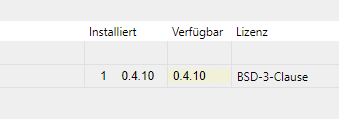
heute gab es ein Update auf die 0.4.10. Das System zeigt mir an, das der Adapter erfolgreich aktuallisiert wurde.
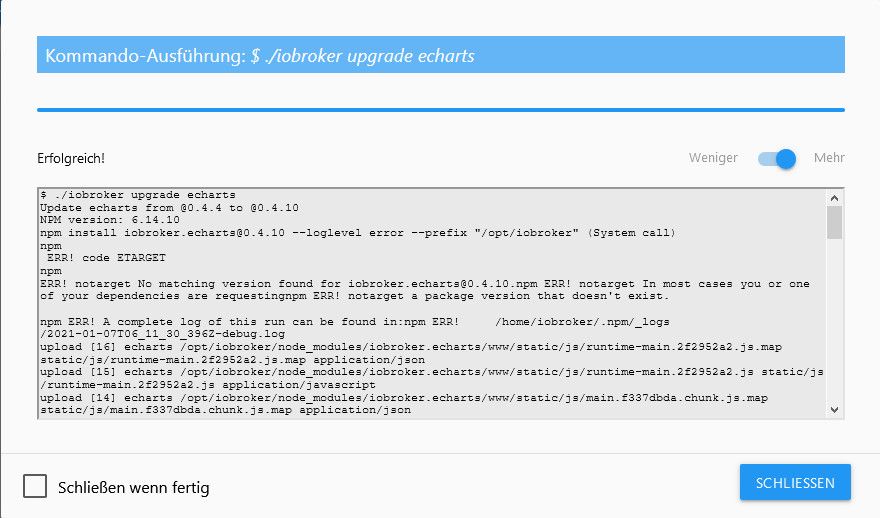
Im Anschluss wird mir aber weiterhin das Update angezeigt.
Das System wurde bereits einmal komplett durchgestartet.Jemand eine Idee?
-
Habe gerade eben auf einem weiteren Testsystem eCharts installieren wollen und dort den selben Fehler erhalten:
$ ./iobroker add echarts  --host raspberrypi
NPM version: 6.14.4
npm install iobroker.echarts@0.4.10 --loglevel error --prefix "/opt/iobroker" (System call)
npm
 ERR! code ETARGET
npm ERR! notarget No matching version found for iobroker.echarts@0.4.10.npm ERR! notarget In most cases you or one of your dependencies are requestingnpm ERR! notarget a package version that doesn't exist.

npm ERR! A complete log of this run can be found in:npm ERR!     /home/iobroker/.npm/_logs/2021-01-07T10_48_23_634Z-debug.log
ERROR: host.raspberrypi Cannot install iobroker.echarts@0.4.10: 1
ERROR: process exited with code 25
Allerdings läuft es bei mir nicht durch
Das npm log sieht so aus:
0 info it worked if it ends with ok 1 verbose cli [ '/usr/bin/node', 1 verbose cli '/usr/bin/npm', 1 verbose cli 'install', 1 verbose cli 'iobroker.echarts@0.4.10', 1 verbose cli '--loglevel', 1 verbose cli 'error', 1 verbose cli '--prefix', 1 verbose cli '/opt/iobroker' ] 2 info using npm@6.14.4 3 info using node@v10.21.0 4 verbose npm-session dbd94f739da18c9d 5 silly install loadCurrentTree 6 silly install readLocalPackageData 7 http fetch GET 200 https://registry.npmjs.org/iobroker.echarts 289ms 8 silly fetchPackageMetaData error for iobroker.echarts@0.4.10 No matching version found for iobroker.echarts@0.4.10. 9 timing stage:rollbackFailedOptional Completed in 1ms 10 timing stage:runTopLevelLifecycles Completed in 5163ms 11 verbose type version 12 verbose stack iobroker.echarts: No matching version found for iobroker.echarts@0.4.10. 12 verbose stack at pickManifest (/usr/lib/node_modules/npm/node_modules/npm-pick-manifest/index.js:122:13) 12 verbose stack at fetchPackument.then.packument (/usr/lib/node_modules/npm/node_modules/pacote/lib/fetchers/registry/manifest.js:24:14) 12 verbose stack at tryCatcher (/usr/lib/node_modules/npm/node_modules/bluebird/js/release/util.js:16:23) 12 verbose stack at Promise._settlePromiseFromHandler (/usr/lib/node_modules/npm/node_modules/bluebird/js/release/promise.js:517:31) 12 verbose stack at Promise._settlePromise (/usr/lib/node_modules/npm/node_modules/bluebird/js/release/promise.js:574:18) 12 verbose stack at Promise._settlePromise0 (/usr/lib/node_modules/npm/node_modules/bluebird/js/release/promise.js:619:10) 12 verbose stack at Promise._settlePromises (/usr/lib/node_modules/npm/node_modules/bluebird/js/release/promise.js:699:18) 12 verbose stack at _drainQueueStep (/usr/lib/node_modules/npm/node_modules/bluebird/js/release/async.js:138:12) 12 verbose stack at _drainQueue (/usr/lib/node_modules/npm/node_modules/bluebird/js/release/async.js:131:9) 12 verbose stack at Async._drainQueues (/usr/lib/node_modules/npm/node_modules/bluebird/js/release/async.js:147:5) 12 verbose stack at Immediate.Async.drainQueues [as _onImmediate] (/usr/lib/node_modules/npm/node_modules/bluebird/js/release/async.js:17:14) 12 verbose stack at runCallback (timers.js:705:18) 12 verbose stack at tryOnImmediate (timers.js:676:5) 12 verbose stack at processImmediate (timers.js:658:5) 13 verbose cwd /opt/iobroker 14 verbose Linux 4.19.118-v7l+ 15 verbose argv "/usr/bin/node" "/usr/bin/npm" "install" "iobroker.echarts@0.4.10" "--loglevel" "error" "--prefix" "/opt/iobroker" 16 verbose node v10.21.0 17 verbose npm v6.14.4 18 error code ETARGET 19 error notarget No matching version found for iobroker.echarts@0.4.10. 20 error notarget In most cases you or one of your dependencies are requesting 20 error notarget a package version that doesn't exist. 21 verbose exit [ 1, true ] -
@Bluefox , @all
Guten Morgen,
heute gab es ein Update auf die 0.4.10. Das System zeigt mir an, das der Adapter erfolgreich aktuallisiert wurde.
Im Anschluss wird mir aber weiterhin das Update angezeigt.
Das System wurde bereits einmal komplett durchgestartet.Jemand eine Idee?
-
@falke69 ich hatte das gleich Problem. Habe dann nochmal über github probiert. Hat nun funktioniert:
:+1: -
Super Adapter ! Besten Dank Blue !!
Endlich keine Probleme mehr mit Grafana das die Charts alle paar Monate aus irgendwelchen Gründen nicht mehr funktionieren und zusätzlich eine VM oder Container gespart.
Wenn man mit Flow oder Graf schon gearbeitet hat braucht man auch keine Einarbeitungszeit, ist alles wirklich selbsterklärend und meine Charts waren waren schnell erstellt.Zwei Fragen habe ich dennoch ? eine wurde schon als Issue gemeldet, jedoch ohne Antwort.
Ist es möglich den Hintergrund vom Tooltip zu ändern ?Bringt das Widget zufällig einen Vorteil ? bspw Hintergrundbilder oder ähnliches ?
Ich habe mein System uptoDate jedoch habe ich das Widget nicht. Lies sich aber auch super über IFrame einbinden. -
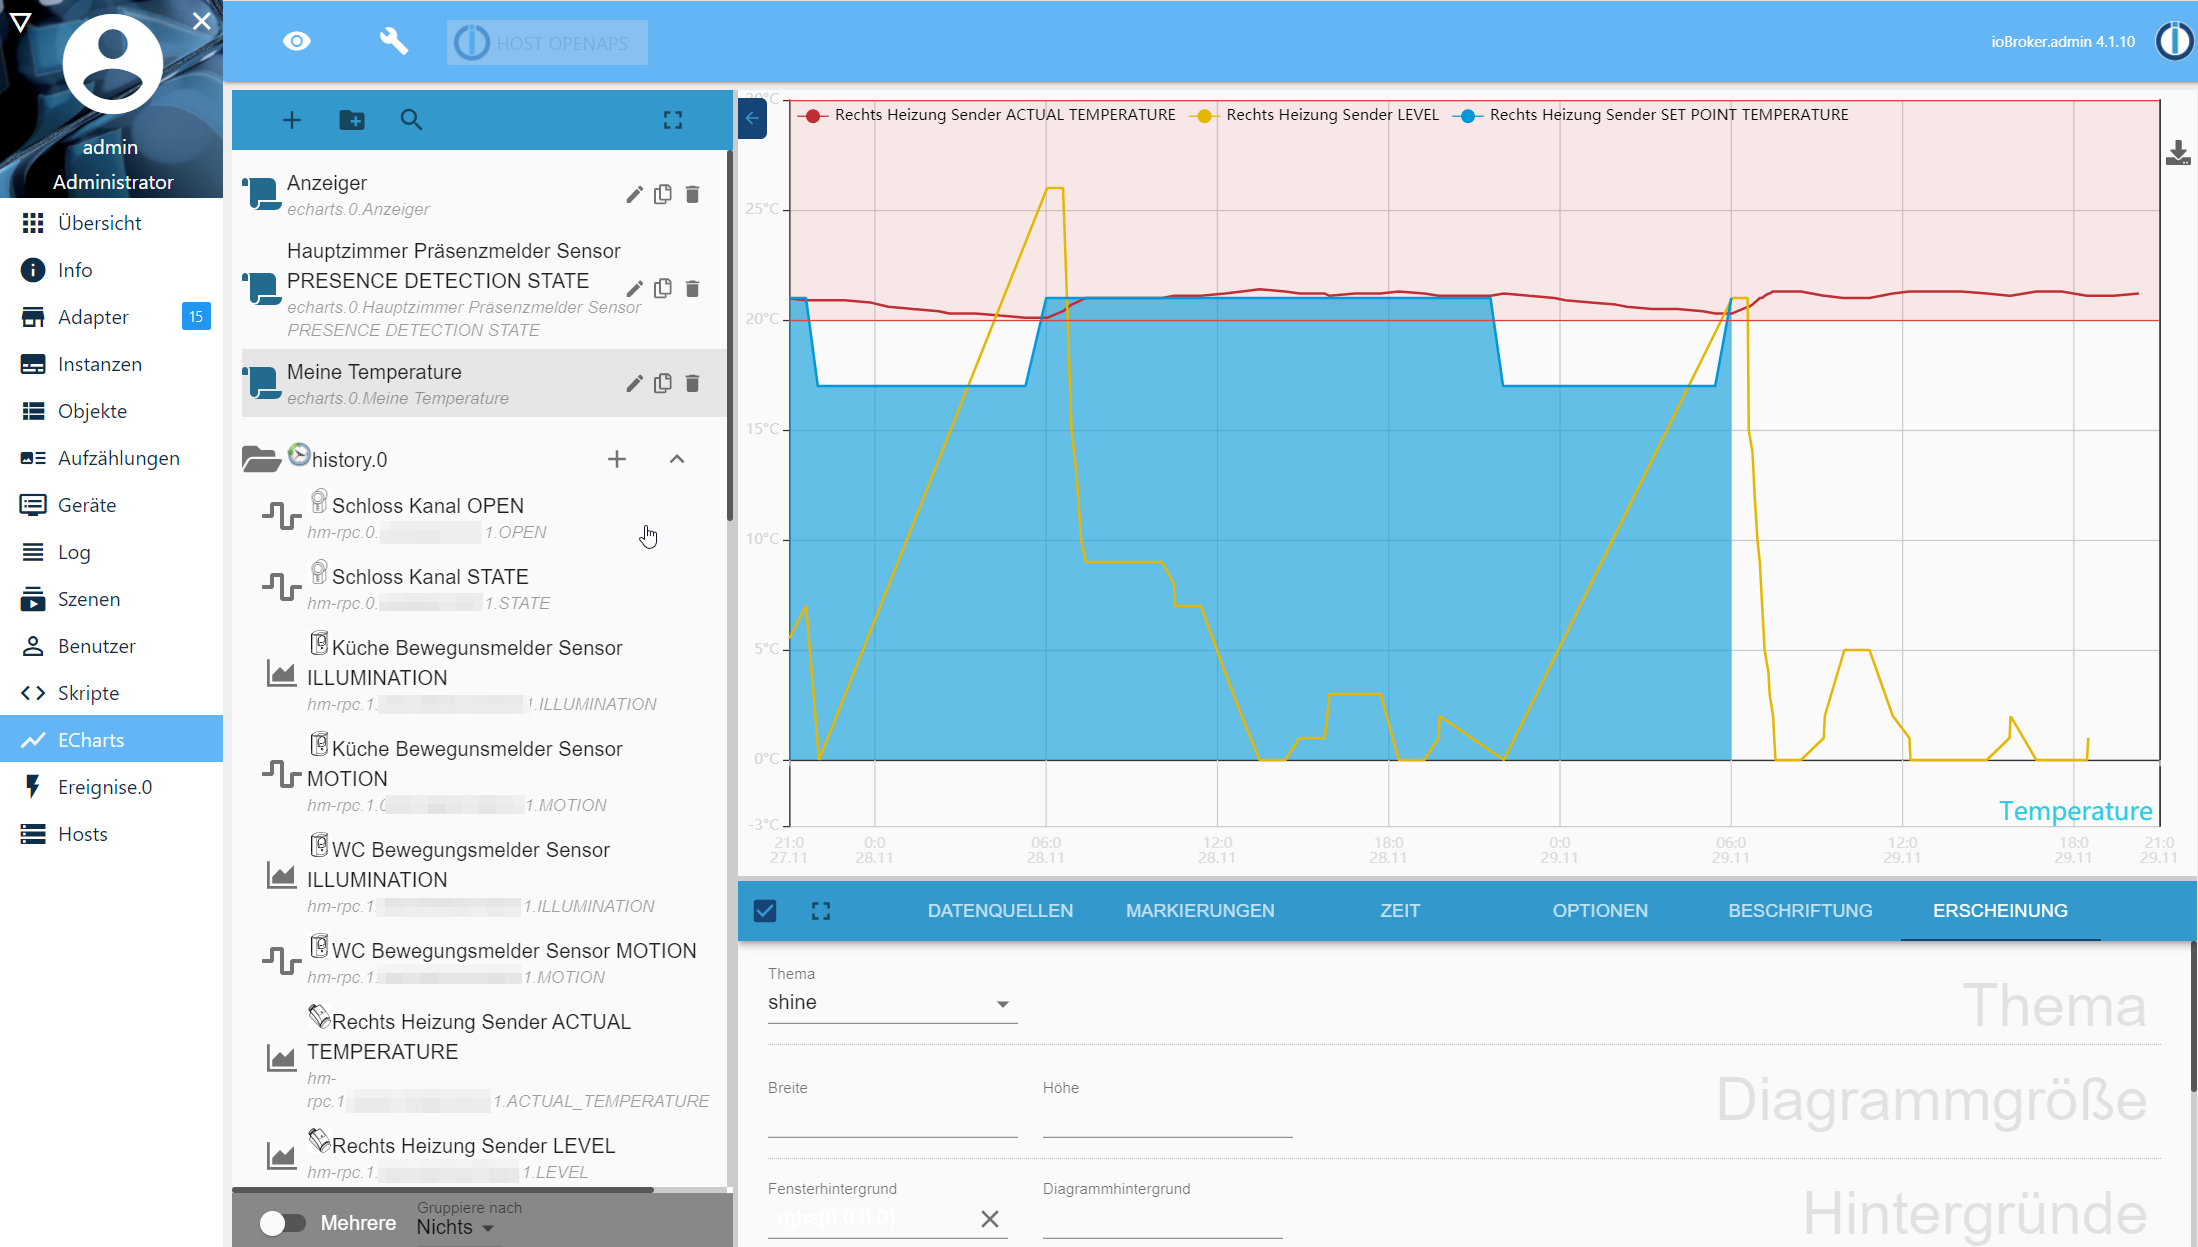
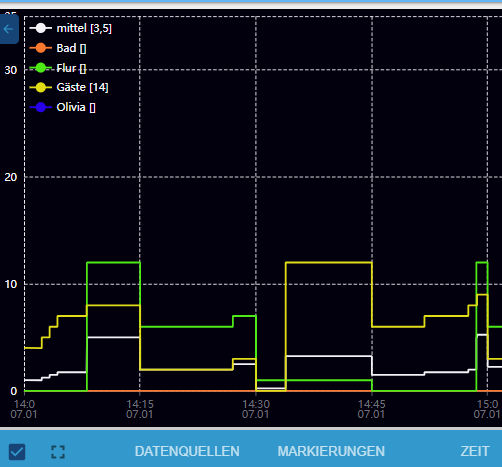
hm...also der Adapter sieht sehr easy aus - allerdings finde ich entweder die entsprechende Einstellung nicht, oder ich überlese sie immer.
Warum zum Teufel hab ich da rechts auch Zahlen stehen? Die stimmen in gerader Linie nicht mal mit denen links überein??
UDM Pro, Intel NUC - ioBroker in Proxmox-VM, PiHole+Grafana&Influx+TasmoAdmin in LXCs, Raspberry Pi3 (als CCU), Zigbee-Stick Sonoff, Synology DS918+
-
hm...also der Adapter sieht sehr easy aus - allerdings finde ich entweder die entsprechende Einstellung nicht, oder ich überlese sie immer.
Warum zum Teufel hab ich da rechts auch Zahlen stehen? Die stimmen in gerader Linie nicht mal mit denen links überein??
@Kueppert sagte in Test eCharts Adapter:
Warum zum Teufel hab ich da rechts auch Zahlen stehen?
weil du die wahrscheinlich (wie bei flot) in der Datenreihe definiert hast
@Kueppert sagte in Test eCharts Adapter:
Die stimmen in gerader Linie nicht mal mit denen links überein??
Müssen sie auch nicht, wenn die Datenreihen der beiden Achsen unterschiedliche Werte haben.
-
@Kueppert sagte in Test eCharts Adapter:
Warum zum Teufel hab ich da rechts auch Zahlen stehen?
weil du die wahrscheinlich (wie bei flot) in der Datenreihe definiert hast
@Kueppert sagte in Test eCharts Adapter:
Die stimmen in gerader Linie nicht mal mit denen links überein??
Müssen sie auch nicht, wenn die Datenreihen der beiden Achsen unterschiedliche Werte haben.
@Homoran ach Mensch...da ist ein ganz schwer erkennbarer kleiner Pfeil nach unten unter dem "+" O.o den hab ich gerade durch Zufall gesehen hahaha. Dann mach ich mal weiter wie gehabt Danke dir :)
UDM Pro, Intel NUC - ioBroker in Proxmox-VM, PiHole+Grafana&Influx+TasmoAdmin in LXCs, Raspberry Pi3 (als CCU), Zigbee-Stick Sonoff, Synology DS918+
-
@Homoran ach Mensch...da ist ein ganz schwer erkennbarer kleiner Pfeil nach unten unter dem "+" O.o den hab ich gerade durch Zufall gesehen hahaha. Dann mach ich mal weiter wie gehabt Danke dir :)
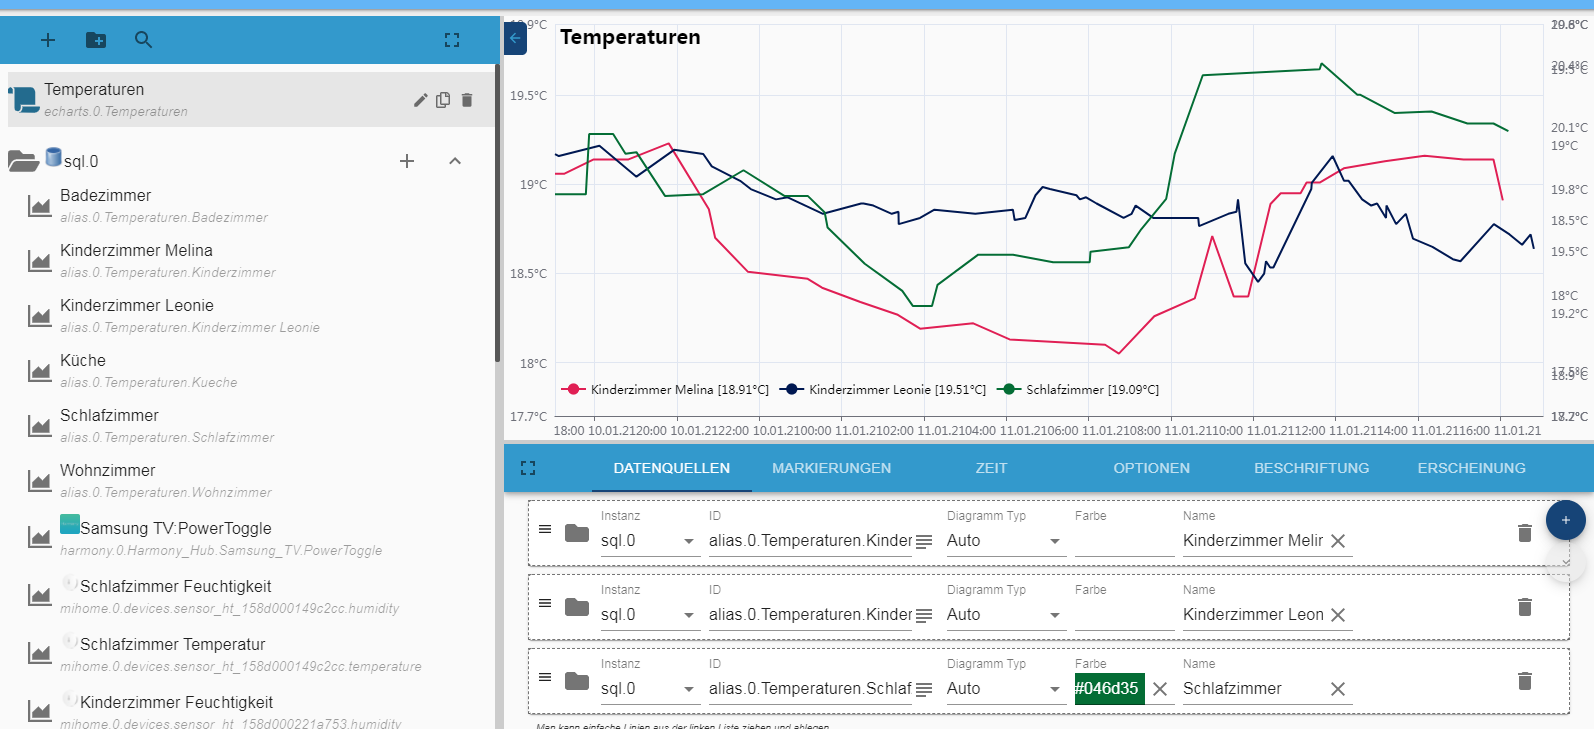
ich habe nicht die Möglichkeit gefunden wie man die Legende und die Beschriftungen der Achsen anpassen kann.
Host: NUC8i3 mit Proxmox:
- ioBroker CT Debian 13, npm 10.9.4, nodejs 22.21.0
- Slave: Pi4
-
ich habe nicht die Möglichkeit gefunden wie man die Legende und die Beschriftungen der Achsen anpassen kann.
@lobomau said in Test eCharts Adapter:
wie man die Legende und die Beschriftungen der Achsen anpassen kann.
was meinst du mit anpassen?
Legende habe ich horizontal und senkrecht, Textfarbe und Hintergrund, sowie die aktuellen Werte anzeigen
x-Achse kann das Datumsformat und bei der y-Achse min und max eingegeben werdenkein Support per PN! - Fragen im Forum stellen - es gibt fast nichts, was nicht auch für andere interessant ist.
Benutzt das Voting rechts unten im Beitrag wenn er euch geholfen hat.
der Installationsfixer: curl -fsL https://iobroker.net/fix.sh | bash -
-
@lobomau said in Test eCharts Adapter:
wie man die Legende und die Beschriftungen der Achsen anpassen kann.
was meinst du mit anpassen?
Legende habe ich horizontal und senkrecht, Textfarbe und Hintergrund, sowie die aktuellen Werte anzeigen
x-Achse kann das Datumsformat und bei der y-Achse min und max eingegeben werden -
@lobomau said in Test eCharts Adapter:
@homoran kann man die Schriftgröße des Textes in der Legende anpassen?
Hab ich noch nicht gefunden.
Aber gerade die Schriftfarbe für die Achsen ;-)kein Support per PN! - Fragen im Forum stellen - es gibt fast nichts, was nicht auch für andere interessant ist.
Benutzt das Voting rechts unten im Beitrag wenn er euch geholfen hat.
der Installationsfixer: curl -fsL https://iobroker.net/fix.sh | bash -
-
@lobomau said in Test eCharts Adapter:
@homoran kann man die Schriftgröße des Textes in der Legende anpassen?
Hab ich noch nicht gefunden.
Aber gerade die Schriftfarbe für die Achsen ;-) -
Ich habe auch noch ein paar Kleinigkeiten:
1.)
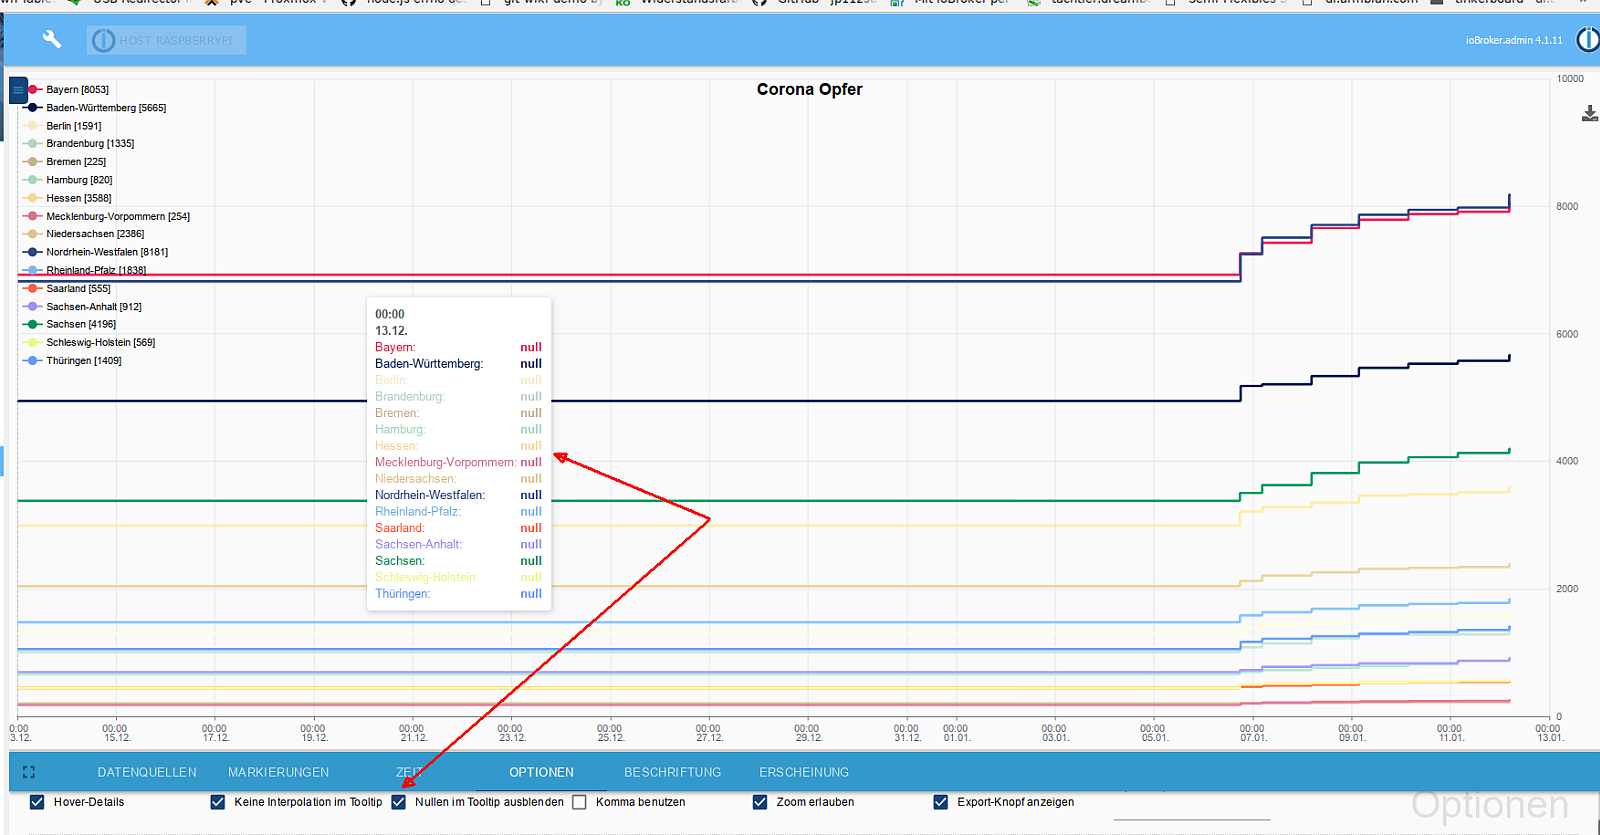
Wenn NULL(en) im tooltip nicht anzeigen aktiviert ist, werden trotzdem NULL angezeigt, wenn alle Linien NULL sind2.)
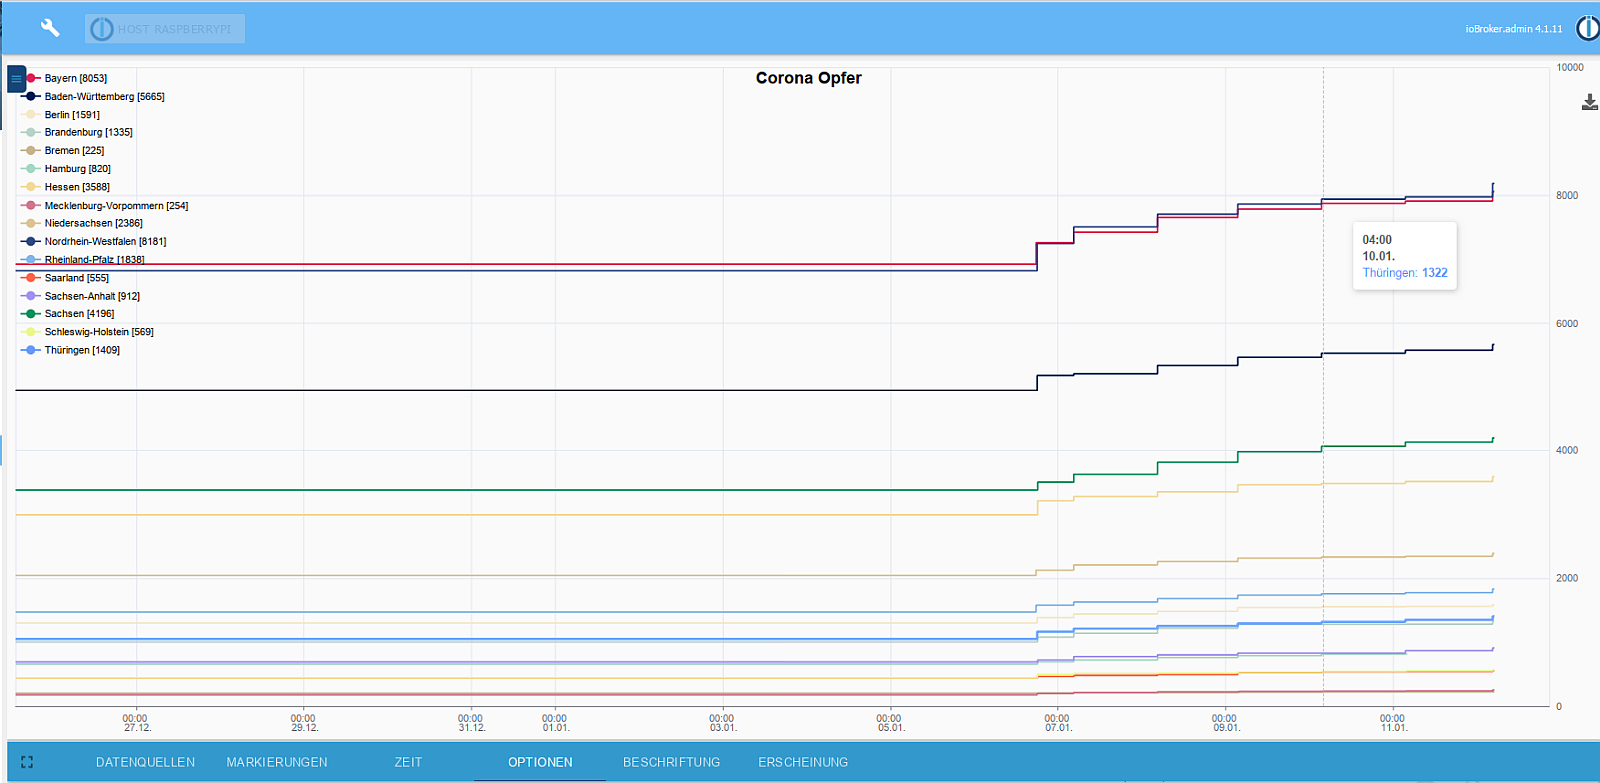
der coronavirus-Adapter beschreibt die States mit einigen Millisekunden Abstand.Dadurch (?) erscheinen nicht mehr alle Datenpunkte in dem Tooltip. Noch "schlimmer", ich schaffe es gar nicht diese Werte anzeigen zu lassen, es erscheint immer der Wert der untersten Datenlinie, ganz manchmal auch der, der zweituntersten Linie, aber niemals die anderen.
Unten bezieht sich auf die Reihenfolge der Datenreihen - nicht der Wertekein Support per PN! - Fragen im Forum stellen - es gibt fast nichts, was nicht auch für andere interessant ist.
Benutzt das Voting rechts unten im Beitrag wenn er euch geholfen hat.
der Installationsfixer: curl -fsL https://iobroker.net/fix.sh | bash -
-
Ich habe auch noch ein paar Kleinigkeiten:
1.)
Wenn NULL(en) im tooltip nicht anzeigen aktiviert ist, werden trotzdem NULL angezeigt, wenn alle Linien NULL sind2.)
der coronavirus-Adapter beschreibt die States mit einigen Millisekunden Abstand.Dadurch (?) erscheinen nicht mehr alle Datenpunkte in dem Tooltip. Noch "schlimmer", ich schaffe es gar nicht diese Werte anzeigen zu lassen, es erscheint immer der Wert der untersten Datenlinie, ganz manchmal auch der, der zweituntersten Linie, aber niemals die anderen.
Unten bezieht sich auf die Reihenfolge der Datenreihen - nicht der Werte -
-
@saschag sagte in Test eCharts Adapter:
Wie beim MDW:
was ist das?
Ich kenne NDW und MDFEDIT:
Aber jetzt glaube ich was du meinst: Die Fläche unter der Kurve
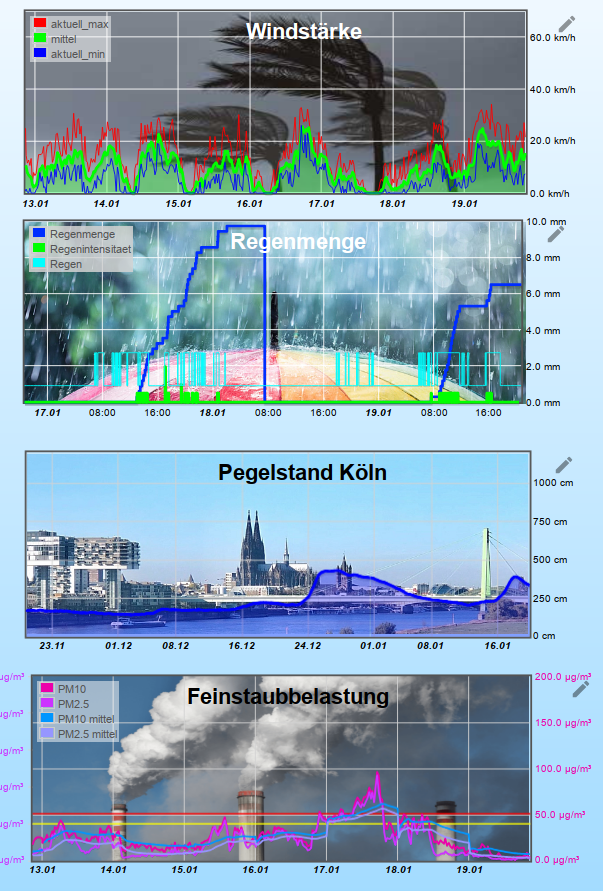
so wie hier bei Wind (grün) und Pegel (blau)
Hab ich bei eCharts noch nicht gefunden

Support us
914
Online32.4k
Users81.5k
Topics1.3m
Posts