VIS Log file ? max Datenpunktanzahl? Vis startet öfters neu
-
Hallo zusammen
Nachdem meine VIS leider immer wieder "weiß" wird und dann von 10 runterzählt und neu ladet, bin ich auf der Fehlersuche. Wenn dies nur 1-2 am Tag wäre könnte ich damit leben, aber ich denke es ist fast jede Stunde. Nun läuft die vis am Tablet,wo man nur schwer eine Browser Console öffnen kann.
Gibt es eine Log Datei wo ich nachsehen könnte, weshalb die Vis neu ladet?
gibt es eine maximale Anzahl an Datenpunkten? ich lade mittlerweile sicherlich 100-150 Datenpunkte.
Ab wann wird es denn zuviel? belasten Datenpunkte die VIS?
Vielen dank
Lg Jumbo125 -
@jumbo125 sagte in VIS Log file ? max Datenpunktanzahl? Vis startet öfters neu:
Gibt es eine Log Datei wo ich nachsehen könnte, weshalb die Vis neu ladet?
nein gibts nicht
@jumbo125 sagte in VIS Log file ? max Datenpunktanzahl? Vis startet öfters neu:
gibt es eine maximale Anzahl an Datenpunkten? ich lade mittlerweile sicherlich 100-150 Datenpunkte.
das ist nix..und zu viel .. na ja .. es wird langsam
was für Hardware hast du da ??meistens liegt es am RAM und an instabieler WLAN Verbindung
-
@arteck
8GB RAM, die lese ich up-to-date aus..... das sind meistens nur 40% in Verwendung.
was meinst du mit "das ist nix"?
heißt das: das ist nix = das sind nicht viele Datenpunkte
oder heißt das: das ist nix = diese hohe Anzahl an Datenpunkten ist schlecht?
Wlan -> router befindet sich 10cm daneben -
@jumbo125 was für Tabled hat 8GB RAM ???
und ja 150 DP ist nix..
-
@arteck hatte zuvor ein lenovo mit 4gb
Nun ist es ein NoName SGIN Tablet 10 Zoll, 8GB RAM 128GB ROM, Andiod 12 Tablet Octa-Core A133 1.6Ghz Processor
Das ist leistungsmässig wirklich gut bis jetzt -
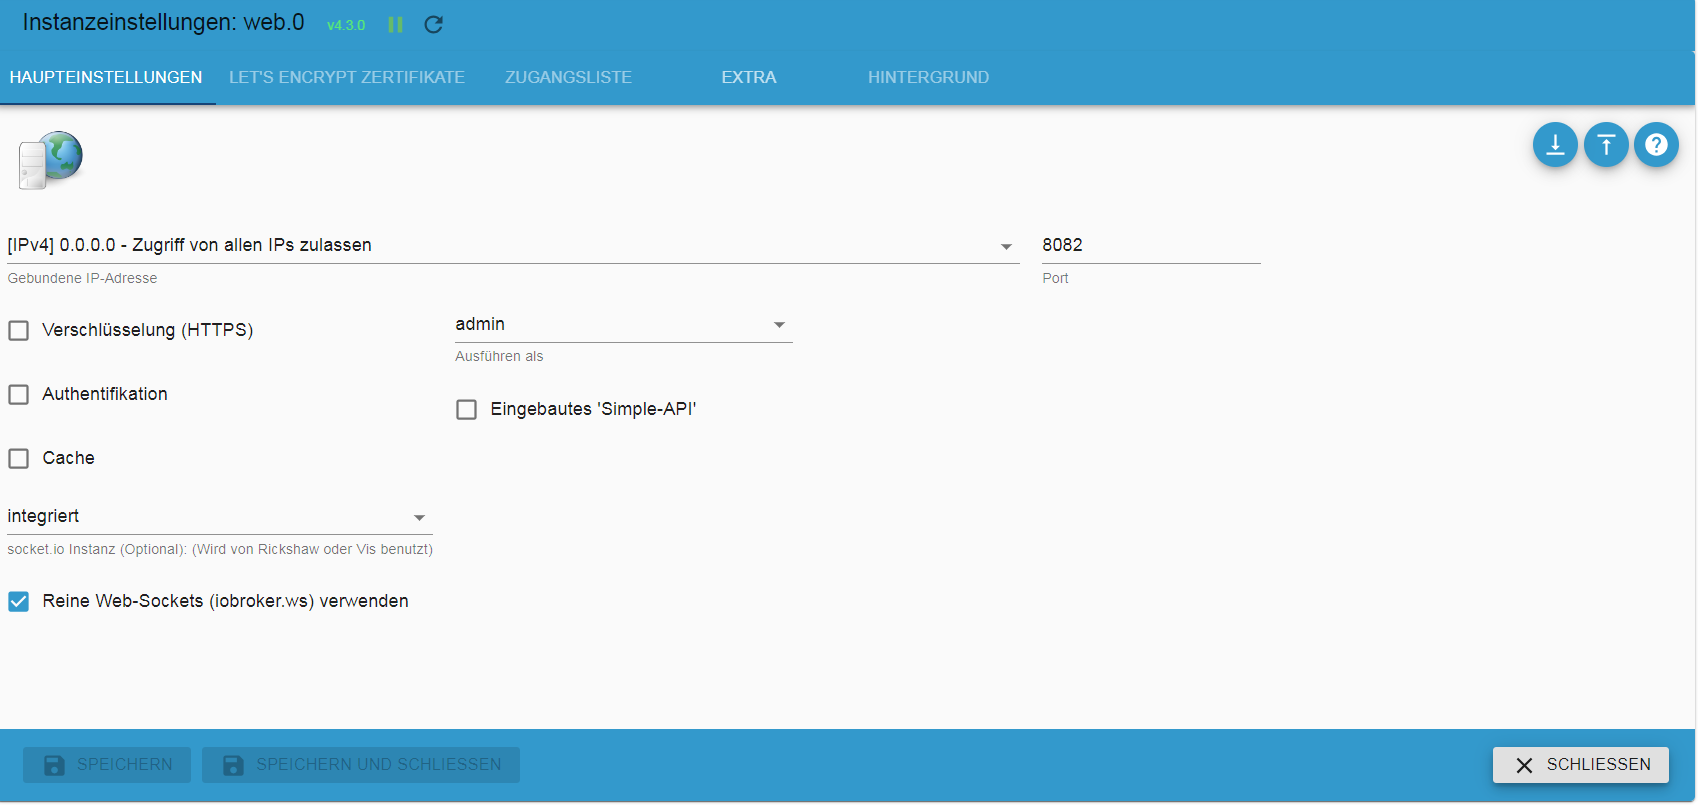
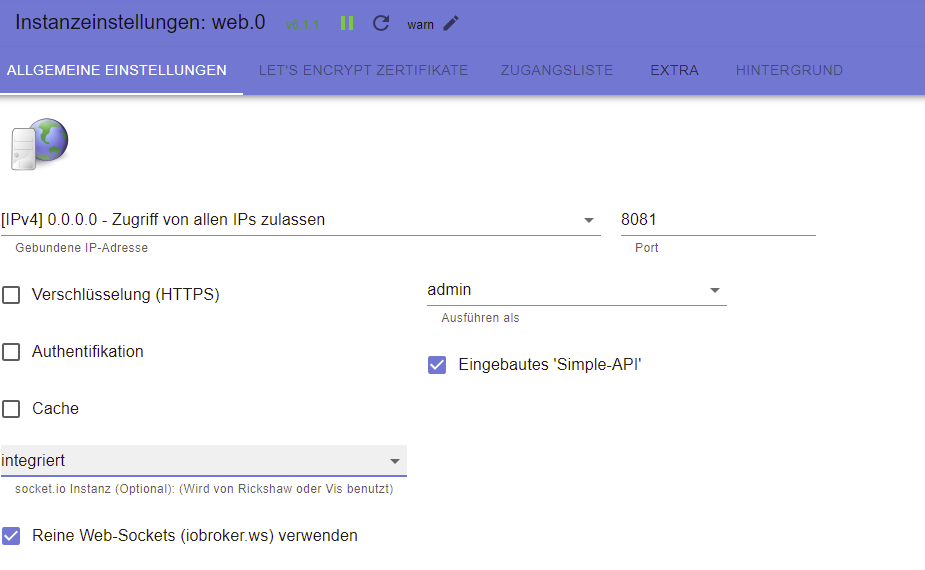
@jumbo125 zeigmal die web adapter einstellungn
-
@jumbo125 sagte in VIS Log file ? max Datenpunktanzahl? Vis startet öfters neu:
Gibt es eine Log Datei wo ich nachsehen könnte, weshalb die Vis neu ladet?
Zeige mal die Full Ausgabe von
iob diagdamit wir auch mal wissen was du so hast ... so ist das nur erstmal ein Frage./ Antwortspiel .
Ausgabe in Code-Tags </> setzen !
-
-
@glasfaser said in VIS Log file ? max Datenpunktanzahl? Vis startet öfters neu:
iob diag
danke!
======================= SUMMARY ======================= v.2023-04-16 Operatingsystem: Ubuntu 22.04.2 LTS Kernel: 6.2.0-rc3-meson64 Installation: Native Timezone: Europe/Vienna (CEST, +0200) User-ID: 1000 X-Server: false Boot Target: multi-user.target Pending OS-Updates: 184 Pending iob updates: 12 Nodejs-Installation: /usr/bin/nodejs v18.16.1 /usr/bin/node v18.16.1 /usr/bin/npm 9.5.1 /usr/bin/npx 9.5.1 Recommended versions are nodejs 18.x.y and npm 9.x.y Your nodejs installation is correct MEMORY: total used free shared buff/cache available Mem: 1.9G 1.4G 80M 3.0M 421M 419M Swap: 965M 963M 1.0M Total: 2.9G 2.4G 82M Active iob-Instances: 10 Active repo(s): stable ioBroker Core: js-controller 4.0.24 admin 6.3.5 ioBroker Status: iobroker is running on this host. Objects type: jsonl States type: jsonl Status admin and web instance: + system.adapter.admin.0 : admin : odroidc2 - enabled, port: 8081, bind: 0.0.0.0, run as: admin + system.adapter.web.0 : web : odroidc2 - enabled, port: 8082, bind: 0.0.0.0, run as: admin Objects: 3960 States: 3687 Size of iob-Database: 19M /opt/iobroker/iobroker-data/objects.jsonl 1.1M /opt/iobroker/iobroker-data/states.jsonl =================== END OF SUMMARY ==================== -
@jumbo125 sagte in VIS Log file ? max Datenpunktanzahl? Vis startet öfters neu:
MEMORY:
Uhi was ist da los
total used free shared buff/cache available Mem: 1.9G 1.4G 80M 3.0M 421M 419Mfree 80M
dir geht der Speicher aus .
Bitte die Full Ausgabe noch posten !
-
@glasfaser ja, das ist leider ein altes problem

aber deswegen ladet doch die view am tablet nicht ständig neu, oder??? -
@jumbo125 sagte in VIS Log file ? max Datenpunktanzahl? Vis startet öfters neu:
das ist leider ein altes problem
sollte aber bei nur
@jumbo125 sagte in VIS Log file ? max Datenpunktanzahl? Vis startet öfters neu:
Active iob-Instances: 10
und einem
@jumbo125 sagte in VIS Log file ? max Datenpunktanzahl? Vis startet öfters neu:
odroidc2
nicht passieren.
oder läuft da noch eine Menge anderer Kram?
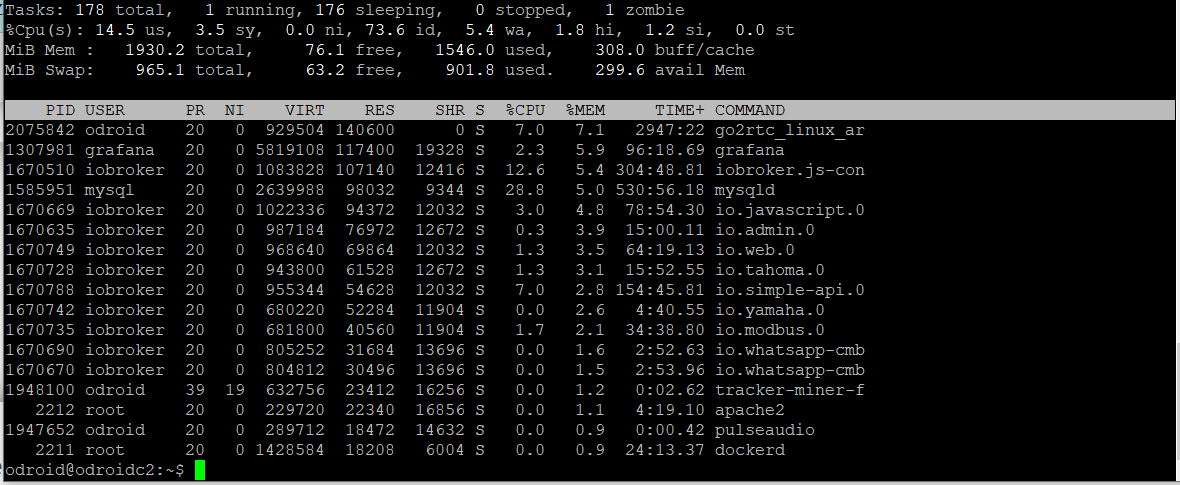
topnach MEM sortieren zeigt dir die Speicherfresser@jumbo125 sagte in VIS Log file ? max Datenpunktanzahl? Vis startet öfters neu:
deswegen ladet doch die view am tablet nicht ständig neu,
das liegt eher an dem Frontend = Tablet.
höchstens noch an den Einstellungen in der web-Instanz
-
@homoran said in VIS Log file ? max Datenpunktanzahl? Vis startet öfters neu:
das liegt eher an dem Frontend = Tablet.
höchstens noch an den Einstellungen in der web-Instanzdas denke ich auch. was kann man in der webdistanz falsch einstellen? ich habe einen screenshot gepostet
bezügl. odroid
ja da laufen noch 2 andere sachen darauf
Ram-Verbraucher sind die mysql DB, go2rtc (rtc to html), iobroker.1585951 mysql 20 0 2640380 129264 14592 S 33.4 6.5 385:17.14 mysqld 2075842 odroid 20 0 929392 140876 0 S 29.8 7.1 2829:17 go2rtc_+ 1670510 iobroker 20 0 1075428 94928 12672 S 18.4 4.8 223:15.50 iobroke+ 1670788 iobroker 20 0 952036 58492 12544 S 9.2 3.0 114:17.55 io.simp+ 1670669 iobroker 20 0 1020868 93784 12544 S 5.6 4.7 57:02.66 io.java+ 1670635 iobroker 20 0 991280 64960 12416 S 2.0 3.3 11:03.65 io.admi+ 1670749 iobroker 20 0 963036 65632 12288 S 2.0 3.3 57:38.69 io.web.0 1670735 iobroker 20 0 680472 39368 12288 S 1.6 2.0 24:35.09 io.modb+ 1307981 grafana 20 0 5819108 116720 18432 S 1.3 5.9 87:43.26 grafana 1670728 iobroker 20 0 943376 62060 14208 S 1.3 3.1 11:08.45 io.taho+ 980 root 20 0 0 0 0 S 0.7 0.0 228:35.35 jbd2/mm+ 1670670 iobroker 20 0 739276 35140 14464 S 0.7 1.8 2:11.03 io.what+ 1670690 iobroker 20 0 739716 30372 14720 S 0.7 1.5 2:10.20 io.what+ 1670742 iobroker 20 0 679560 44164 12416 S 0.7 2.2 3:31.48 io.yama+ 1858172 www-data 20 0 231032 27276 19712 S 0.7 1.4 0:02.99 apache2 1862711 odroid 20 0 10300 3456 2816 R 0.7 0.2 0:00.38 top 1840831 root 0 -20 0 0 0 I 0.3 0.0 0:25.05 k -
@jumbo125 sagte in VIS Log file ? max Datenpunktanzahl? Vis startet öfters neu:
ich habe einen screenshot gepostet
bezügl. odroidda fehlt der gesamte Header.
ist das nach %MEM sortiert?
eher nach CPU, oder? -
@jumbo125 sagte in VIS Log file ? max Datenpunktanzahl? Vis startet öfters neu:
@glasfaser ja, das ist leider ein altes problem
Bitte wie angefragt :
@glasfaser sagte in VIS Log file ? max Datenpunktanzahl? Vis startet öfters neu:
Bitte die Full Ausgabe noch posten ! -
@homoran
verzeihung.
hier nochmals:
nach mem sortiert.
leider konnte ich es nicht rauskopieren
und die gesamte iobroker ausgabe
======== Start marking the full check here =========
Skript v.2023-04-16 *** BASE SYSTEM *** Architecture : aarch64 Docker : false Virtualization : none Distributor ID: Ubuntu Description: Ubuntu 22.04.2 LTS Release: 22.04 Codename: jammy PRETTY_NAME="Armbian 23.02.2 Jammy" NAME="Ubuntu" VERSION_ID="22.04" VERSION="22.04.2 LTS (Jammy Jellyfish)" VERSION_CODENAME=jammy ID=ubuntu ID_LIKE=debian HOME_URL="https://www.ubuntu.com/" SUPPORT_URL="https://help.ubuntu.com/" BUG_REPORT_URL="https://bugs.launchpad.net/ubuntu/" PRIVACY_POLICY_URL="https://www.ubuntu.com/legal/terms-and-policies/privacy-policy" UBUNTU_CODENAME=jammy Systemuptime and Load: 20:35:21 up 31 days, 20:47, 2 users, load average: 1.96, 2.15, 2.18 CPU threads: 4 *** Time and Time Zones *** Local time: Wed 2023-09-13 20:35:21 CEST Universal time: Wed 2023-09-13 18:35:21 UTC RTC time: Sun 1970-02-01 20:45:59 Time zone: Europe/Vienna (CEST, +0200) System clock synchronized: yes NTP service: active RTC in local TZ: no *** User and Groups *** odroid /home/odroid odroid tty disk dialout sudo audio video plugdev games users systemd-journal input netdev bluetooth iobroker *** X-Server-Setup *** X-Server: false Desktop: Terminal: tty Boot Target: multi-user.target *** MEMORY *** total used free shared buff/cache available Mem: 1.9G 1.6G 36M 11M 338M 285M Swap: 965M 898M 66M Total: 2.9G 2.5G 103M 1930 M total memory 1555 M used memory 887 M active memory 322 M inactive memory 36 M free memory 69 M buffer memory 269 M swap cache 965 M total swap 898 M used swap 66 M free swap *** FILESYSTEM *** Filesystem Type Size Used Avail Use% Mounted on tmpfs tmpfs 194M 8.6M 185M 5% /run /dev/mmcblk0p1 ext4 57G 18G 39G 33% / tmpfs tmpfs 966M 0 966M 0% /dev/shm tmpfs tmpfs 5.0M 4.0K 5.0M 1% /run/lock tmpfs tmpfs 966M 0 966M 0% /tmp armbian-ramlog tmpfs 50M 31M 20M 62% /var/log tmpfs tmpfs 194M 76K 193M 1% /run/user/1000 overlaid overlay 194M 76K 193M 1% /run/user/1000/odroid-chromium Messages concerning ext4 filesystem in dmesg: Show mounted filesystems (real ones only): TARGET SOURCE FSTYPE OPTIONS / /dev/mmcblk0p1 ext4 rw,noatime,errors=remount-ro,commit=600 |-/snap/bare/5 /dev/loop0 squashfs ro,nodev,relatime,errors=continue |-/snap/core20/1977 /dev/loop2 squashfs ro,nodev,relatime,errors=continue |-/snap/core22/861 /dev/loop3 squashfs ro,nodev,relatime,errors=continue |-/snap/gnome-3-38-2004/141 /dev/loop6 squashfs ro,nodev,relatime,errors=continue |-/snap/gnome-3-38-2004/145 /dev/loop7 squashfs ro,nodev,relatime,errors=continue |-/snap/gnome-42-2204/122 /dev/loop8 squashfs ro,nodev,relatime,errors=continue |-/snap/gnome-42-2204/127 /dev/loop9 squashfs ro,nodev,relatime,errors=continue |-/snap/gtk-common-themes/1535 /dev/loop10 squashfs ro,nodev,relatime,errors=continue |-/snap/firefox/3067 /dev/loop14 squashfs ro,nodev,relatime,errors=continue |-/var/snap/firefox/common/host-hunspell /dev/mmcblk0p1[/usr/share/hunspell] ext4 ro,noexec,noatime,errors=remount-ro,commit=600 |-/var/log.hdd /dev/mmcblk0p1[/var/log] ext4 rw,noatime,errors=remount-ro,commit=600 |-/snap/firefox/3134 /dev/loop12 squashfs ro,nodev,relatime,errors=continue |-/snap/core20/2019 /dev/loop13 squashfs ro,nodev,relatime,errors=continue |-/snap/core22/867 /dev/loop11 squashfs ro,nodev,relatime,errors=continue |-/snap/snapd/19998 /dev/loop1 squashfs ro,nodev,relatime,errors=continue `-/snap/snapd/20102 /dev/loop4 squashfs ro,nodev,relatime,errors=continue Files in neuralgic directories: /var: 12G /var/ 9.7G /var/lib 6.2G /var/lib/mysql 3.1G /var/lib/snapd 2.5G /var/lib/snapd/snaps Archived and active journals take up 7.2M in the file system. /opt/iobroker/backups: 316M /opt/iobroker/backups/ /opt/iobroker/iobroker-data: 178M /opt/iobroker/iobroker-data/ 134M /opt/iobroker/iobroker-data/files 51M /opt/iobroker/iobroker-data/files/javascript.admin 33M /opt/iobroker/iobroker-data/backup-objects 32M /opt/iobroker/iobroker-data/files/javascript.admin/static/js The five largest files in iobroker-data are: 15M /opt/iobroker/iobroker-data/files/meteoalarm.admin/geocodes.json 6.9M /opt/iobroker/iobroker-data/files/javascript.admin/static/js/610.de0231c9.chunk.js.map 6.6M /opt/iobroker/iobroker-data/files/modbus.admin/static/js/main.8083c40d.js.map 6.5M /opt/iobroker/iobroker-data/objects.jsonl 6.3M /opt/iobroker/iobroker-data/files/admin.admin/custom/static/js/vendors-node_modules_iobroker_adapter-react-v5_assets_devices_parseNames_js-node_modules_iobr-99c23e.847b8ad9.chunk.jsmap *** NodeJS-Installation *** /usr/bin/nodejs v18.16.1 /usr/bin/node v18.16.1 /usr/bin/npm 9.5.1 /usr/bin/npx 9.5.1 nodejs: Installed: 18.16.1-deb-1nodesource1 Candidate: 18.17.1-deb-1nodesource1 Version table: 18.17.1-deb-1nodesource1 500 500 https://deb.nodesource.com/node_18.x jammy/main arm64 Packages *** 18.16.1-deb-1nodesource1 100 100 /var/lib/dpkg/status 12.22.9~dfsg-1ubuntu3 500 500 http://ports.ubuntu.com jammy/universe arm64 Packages Temp directories causing npm8 problem: 0 No problems detected *** ioBroker-Installation *** ioBroker Status iobroker is running on this host. Objects type: jsonl States type: jsonl MULTIHOSTSERVICE/enabled: false Core adapters versions js-controller: 4.0.24 admin: 6.3.5 javascript: 6.1.4 Adapters from github: 1 Adapter State + system.adapter.admin.0 : admin : odroidc2 - enabled, port: 8081, bind: 0.0.0.0, run as: admin system.adapter.backitup.0 : backitup : odroidc2 - disabled system.adapter.cloud.0 : cloud : odroidc2 - disabled system.adapter.daswetter.0 : daswetter : odroidc2 - enabled system.adapter.discovery.0 : discovery : odroidc2 - disabled system.adapter.history.0 : history : odroidc2 - disabled system.adapter.jarvis.0 : jarvis : odroidc2 - disabled + system.adapter.javascript.0 : javascript : odroidc2 - enabled system.adapter.meteoalarm.0 : meteoalarm : odroidc2 - enabled + system.adapter.modbus.0 : modbus : odroidc2 - enabled system.adapter.net-tools.0 : net-tools : odroidc2 - disabled system.adapter.ping.0 : ping : odroidc2 - disabled + system.adapter.simple-api.0 : simple-api : odroidc2 - enabled, port: 8087, bind: 0.0.0.0, run as: admin system.adapter.socketio.0 : socketio : odroidc2 - disabled, port: 8084, bind: 0.0.0.0, run as: admin system.adapter.sql.0 : sql : odroidc2 - disabled + system.adapter.tahoma.0 : tahoma : odroidc2 - enabled system.adapter.vis-hqwidgets.0 : vis-hqwidgets : odroidc2 - disabled system.adapter.vis-jqui-mfd.0 : vis-jqui-mfd : odroidc2 - disabled system.adapter.vis.0 : vis : odroidc2 - enabled + system.adapter.web.0 : web : odroidc2 - enabled, port: 8082, bind: 0.0.0.0, run as: admin + system.adapter.whatsapp-cmb.0 : whatsapp-cmb : odroidc2 - enabled + system.adapter.whatsapp-cmb.1 : whatsapp-cmb : odroidc2 - enabled + system.adapter.yamaha.0 : yamaha : odroidc2 - enabled + instance is alive Enabled adapters with bindings + system.adapter.admin.0 : admin : odroidc2 - enabled, port: 8081, bind: 0.0.0.0, run as: admin + system.adapter.simple-api.0 : simple-api : odroidc2 - enabled, port: 8087, bind: 0.0.0.0, run as: admin + system.adapter.web.0 : web : odroidc2 - enabled, port: 8082, bind: 0.0.0.0, run as: admin ioBroker-Repositories stable : http://download.iobroker.net/sources-dist.json beta : http://download.iobroker.net/sources-dist-latest.json Active repo(s): stable Installed ioBroker-Instances Used repository: stable Adapter "admin" : 6.8.0 , installed 6.3.5 [Updatable] Adapter "backitup" : 2.6.23 , installed 2.6.16 [Updatable] Adapter "cloud" : 4.4.1 , installed 4.3.0 [Updatable] Adapter "daswetter" : 3.1.10 , installed 3.1.8 [Updatable] Adapter "discovery" : 3.1.0 , installed 3.1.0 Adapter "history" : 2.2.6 , installed 2.2.4 [Updatable] Adapter "jarvis" : 3.1.2 , installed 3.1.2 Adapter "javascript" : 7.0.3 , installed 6.1.4 [Updatable] Controller "js-controller": 4.0.24 , installed 4.0.24 Adapter "meteoalarm" : 2.3.6 , installed 2.3.5 [Updatable] Adapter "modbus" : 5.0.11 , installed 5.0.11 Adapter "net-tools" : 0.2.0 , installed 0.2.0 Adapter "ping" : 1.6.2 , installed 1.5.3 [Updatable] Adapter "simple-api" : 2.7.2 , installed 2.7.2 Adapter "socketio" : 6.5.3 , installed 4.2.0 [Updatable] Adapter "sql" : 2.2.0 , installed 2.2.0 Adapter "tahoma" : 0.10.2 , installed 0.10.2 Adapter "vis" : 1.4.16 , installed 1.4.16 Adapter "vis-hqwidgets": 1.4.0 , installed 1.3.0 [Updatable] Adapter "vis-jqui-mfd" : 1.0.12 , installed 1.0.12 Adapter "web" : 6.1.1 , installed 4.3.0 [Updatable] Adapter "whatsapp-cmb" : 0.2.3 , installed 0.2.3 Adapter "ws" : 2.5.4 , installed 1.3.0 [Updatable] Adapter "yamaha" : 0.5.3 , installed 0.5.3 Objects and States Please stand by - This may take a while Objects: 3993 States: 3717 *** OS-Repositories and Updates *** W: An error occurred during the signature verification. The repository is not updated and the previous index files will be used. GPG error: https://apt.grafana.com stable InRelease: The folowing signatures couldn't be verified because the public key is not available: NO_PUBKEY 963FA27710458545 W: Failed to fetch https://apt.grafana.com/dists/stable/InRelease The following signatures couldn't be verified because the public key is not available: NO_PUBKEY 963FA27710458545 W: Some index files failed to download. They have been ignored, or old ones used instead. Hit:1 http://ppa.launchpadcontent.net/saiarcot895/chromium-beta/ubuntu jammy InRelease Hit:2 http://ports.ubuntu.com jammy InRelease Hit:3 http://ports.ubuntu.com jammy-security InRelease Hit:4 http://ports.ubuntu.com jammy-updates InRelease Hit:5 http://ppa.launchpadcontent.net/mozillateam/ppa/ubuntu jammy InRelease Hit:6 http://ports.ubuntu.com jammy-backports InRelease Hit:8 http://deb.volian.org/volian scar InRelease Get:9 https://apt.grafana.com stable InRelease [5984 B] Hit:10 https://deb.nodesource.com/node_18.x jammy InRelease Hit:7 http://fi.mirror.armbian.de/apt jammy InRelease Err:9 https://apt.grafana.com stable InRelease The following signatures couldn't be verified because the public key is not available: NO_PUBKEY 963FA27710458545 Reading package lists... W: An error occurred during the signature verification. The repository is not updated and the previous index files will be used. GPG error: https://apt.grafana.com stable InRelease: The folowing signatures couldn't be verified because the public key is not available: NO_PUBKEY 963FA27710458545 W: Failed to fetch https://apt.grafana.com/dists/stable/InRelease The following signatures couldn't be verified because the public key is not available: NO_PUBKEY 963FA27710458545 W: Some index files failed to download. They have been ignored, or old ones used instead. Pending Updates: 184 *** Listening Ports *** Active Internet connections (only servers) Proto Recv-Q Send-Q Local Address Foreign Address State User Inode PID/Program name tcp 0 0 127.0.0.1:9000 0.0.0.0:* LISTEN 1002 162930510 1670510/iobroker.js tcp 0 0 127.0.0.1:9001 0.0.0.0:* LISTEN 1002 162932639 1670510/iobroker.js tcp 0 0 127.0.0.1:39651 0.0.0.0:* LISTEN 0 9526 2093/containerd tcp 0 0 0.0.0.0:51821 0.0.0.0:* LISTEN 0 9846 2717/docker-proxy tcp 0 0 127.0.0.1:631 0.0.0.0:* LISTEN 0 11469 2038/cupsd tcp 0 0 0.0.0.0:22 0.0.0.0:* LISTEN 0 11457 2154/sshd: /usr/sbi tcp 0 0 127.0.0.53:53 0.0.0.0:* LISTEN 101 8722 1470/systemd-resolv tcp 0 0 0.0.0.0:111 0.0.0.0:* LISTEN 0 5529 1/init tcp6 0 0 :::8084 :::* LISTEN 1002 16010 - tcp6 0 0 :::8087 :::* LISTEN 1002 162933677 1670788/io.simple-a tcp6 0 0 :::8081 :::* LISTEN 1002 162933237 1670635/io.admin.0 tcp6 0 0 :::8082 :::* LISTEN 1002 162936357 1670749/io.web.0 tcp6 0 0 :::3000 :::* LISTEN 119 152779701 1307981/grafana tcp6 0 0 :::1984 :::* LISTEN 1000 59116840 2075842/go2rtc_linu tcp6 0 0 :::51821 :::* LISTEN 0 11928 2724/docker-proxy tcp6 0 0 ::1:631 :::* LISTEN 0 11468 2038/cupsd tcp6 0 0 :::33060 :::* LISTEN 117 160549503 1585951/mysqld tcp6 0 0 :::8555 :::* LISTEN 1000 59116848 2075842/go2rtc_linu tcp6 0 0 :::8554 :::* LISTEN 1000 59116841 2075842/go2rtc_linu tcp6 0 0 :::22 :::* LISTEN 0 11459 2154/sshd: /usr/sbi tcp6 0 0 :::80 :::* LISTEN 0 11570 2212/apache2 tcp6 0 0 :::111 :::* LISTEN 0 2275 1/init tcp6 0 0 :::3306 :::* LISTEN 117 160550110 1585951/mysqld udp 0 0 0.0.0.0:54026 0.0.0.0:* 1000 168572014 2075842/go2rtc_linu udp 0 0 0.0.0.0:45844 0.0.0.0:* 1000 85256834 2075842/go2rtc_linu udp 0 0 0.0.0.0:58161 0.0.0.0:* 1000 161661607 2075842/go2rtc_linu udp 0 0 0.0.0.0:43888 0.0.0.0:* 1000 154147161 2075842/go2rtc_linu udp 0 0 0.0.0.0:59294 0.0.0.0:* 1000 158895600 2075842/go2rtc_linu udp 0 0 0.0.0.0:44997 0.0.0.0:* 1000 110263556 2075842/go2rtc_linu udp 0 0 127.0.0.53:53 0.0.0.0:* 101 8721 1470/systemd-resolv udp 0 0 0.0.0.0:58450 0.0.0.0:* 1000 157367595 2075842/go2rtc_linu udp 0 0 0.0.0.0:51292 0.0.0.0:* 1000 149313186 2075842/go2rtc_linu udp 0 0 0.0.0.0:48239 0.0.0.0:* 1000 83887391 2075842/go2rtc_linu udp 0 0 0.0.0.0:111 0.0.0.0:* 0 8120 1/init udp 0 0 0.0.0.0:56441 0.0.0.0:* 1000 169893325 2075842/go2rtc_linu udp 0 0 0.0.0.0:46244 0.0.0.0:* 1000 147643507 2075842/go2rtc_linu udp 0 0 0.0.0.0:44200 0.0.0.0:* 1000 149870522 2075842/go2rtc_linu udp 0 0 0.0.0.0:60636 0.0.0.0:* 1000 140697537 2075842/go2rtc_linu udp 0 0 0.0.0.0:56593 0.0.0.0:* 1000 145018149 2075842/go2rtc_linu udp 0 0 0.0.0.0:40237 0.0.0.0:* 1000 149310094 2075842/go2rtc_linu udp 0 0 0.0.0.0:51509 0.0.0.0:* 1000 150915138 2075842/go2rtc_linu udp 0 0 127.0.0.1:323 0.0.0.0:* 0 8890 2103/chronyd udp 0 0 0.0.0.0:44489 0.0.0.0:* 1000 74237245 2075842/go2rtc_linu udp 0 0 0.0.0.0:45545 0.0.0.0:* 1000 93238658 2075842/go2rtc_linu udp 0 0 0.0.0.0:37437 0.0.0.0:* 1000 135912165 2075842/go2rtc_linu udp 0 0 0.0.0.0:51820 0.0.0.0:* 0 11949 2741/docker-proxy udp 0 0 0.0.0.0:34458 0.0.0.0:* 1000 89043373 2075842/go2rtc_linu udp6 0 0 :::111 :::* 0 6586 1/init udp6 0 0 :::8443 :::* 1000 59116849 2075842/go2rtc_linu udp6 0 0 ::1:323 :::* 0 8891 2103/chronyd udp6 0 0 :::8555 :::* 1000 59116842 2075842/go2rtc_linu udp6 0 0 fe80::d5c9:d24:8b4::546 :::* 0 11836 1541/NetworkManager udp6 0 0 :::51820 :::* 0 9865 2749/docker-proxy============ Mark until here for C&P =============
-
@jumbo125 sagte in VIS Log file ? max Datenpunktanzahl? Vis startet öfters neu:
Pending Updates: 184
Halt die Kiste aktuell. Inkl. grafana-Repository und nodejs (auch hier das Repo).
-
@jumbo125 sagte in VIS Log file ? max Datenpunktanzahl? Vis startet öfters neu:
go2rtc_linu
Hast du ein streaming Docker dort laufen !?
-
@jumbo125 sagte in VIS Log file ? max Datenpunktanzahl? Vis startet öfters neu:
hier nochmals:
fehlt immer noch was ganz oben.
z.b.@jumbo125 sagte in VIS Log file ? max Datenpunktanzahl? Vis startet öfters neu:
load average: 1.96, 2.15, 2.18
das ust auch schon heftig, wenn auch nicht tödlich.
Was mir mehr Sorgen macht ist dein RAM.
gut 75% Sind echt in Gebrauch, wenn ich fue gezeigten Zeilen überschlage komme ich jedoch nur auf ca. 50%.die größten Brocken sind MYSQL, Grafana und go2rtc, was immer das ist.
das macht zusammen knapp 20%RAM aus.iobroker passt eigentlich.
-
@glasfaser ja genau
streame meine cameras von der eingangstüre