NEWS


Visualisierung eines JSON Links
-
Hallo zusammen,
ich hoffe ihr könnt mir weiterhelfen.
Ich habe einen Link zu einem JSON Datensatz.
https://api.solcast.com.au/rooftop_sites/APIKEY???/estimated_actuals?format=json
MOD-EDIT: private Daten entfernt!Diese Daten würde ich gerne in den IOBroker laden und anschließend visaulisieren.
Leider habe ich überhaupt keine Ahnung, wie ich das schaffe :)Probiert hätte ich es mit einer Anleitung aus dem Forum:
--> Unter Scripte, neues Script, Java-Scriptvar request = require('request'); var link = 'https://api.solcast.com.au/rooftop_sites/APIKEY???/estimated_actuals?format=json'; function Solcast() { request(link, function(error,response, body) { if(error) log('Fehler request: ' + error, 'error'); else { var result = JSON.parse(body); setState('Estimate.Gen'), result.pv_estimate); // setState('Estimate.ten'), result.pv_estimate10); setState('Estimate.ninty'), result.pv_estimate90); setState('Period.End'), result.period_end); } }); } schedule('*/5 * * * *', Solcast); // alle 5 MinutenMOD-EDIT: private Daten entfernt!
Bekomme aber auch eine Fehlermeldung:
javascript.0 (1013) script.js.Solcast compile failed: at script.js.Solcast:9Was möchte ich erreichen?
Das folgende Chart von Solcast in meiner VIS.
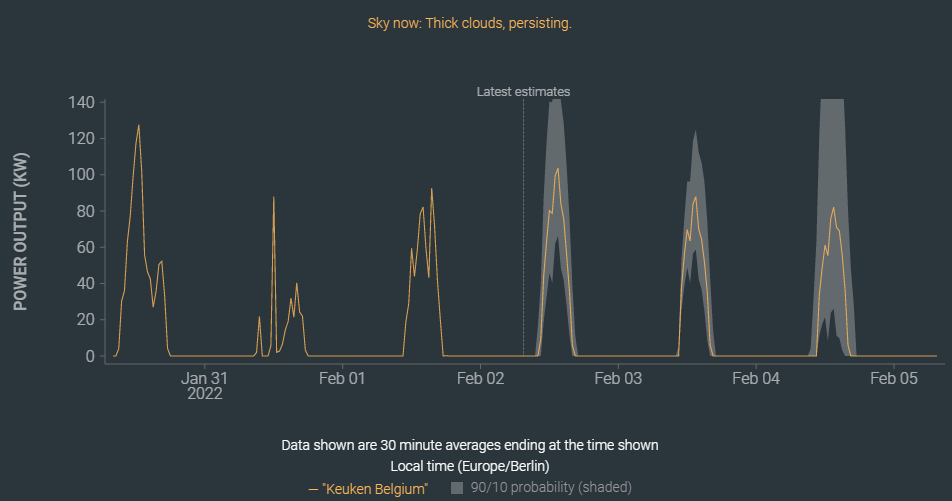
Dort kann man dann erkennen, welche prognostizierte Leistung die PV Anlage die nächsten 3 Tage bringt.
Vielleicht habt ihr einen Tipp für mich.
Vielen Dank -
Hallo zusammen,
ich hoffe ihr könnt mir weiterhelfen.
Ich habe einen Link zu einem JSON Datensatz.
https://api.solcast.com.au/rooftop_sites/APIKEY???/estimated_actuals?format=json
MOD-EDIT: private Daten entfernt!Diese Daten würde ich gerne in den IOBroker laden und anschließend visaulisieren.
Leider habe ich überhaupt keine Ahnung, wie ich das schaffe :)Probiert hätte ich es mit einer Anleitung aus dem Forum:
--> Unter Scripte, neues Script, Java-Scriptvar request = require('request'); var link = 'https://api.solcast.com.au/rooftop_sites/APIKEY???/estimated_actuals?format=json'; function Solcast() { request(link, function(error,response, body) { if(error) log('Fehler request: ' + error, 'error'); else { var result = JSON.parse(body); setState('Estimate.Gen'), result.pv_estimate); // setState('Estimate.ten'), result.pv_estimate10); setState('Estimate.ninty'), result.pv_estimate90); setState('Period.End'), result.period_end); } }); } schedule('*/5 * * * *', Solcast); // alle 5 MinutenMOD-EDIT: private Daten entfernt!
Bekomme aber auch eine Fehlermeldung:
javascript.0 (1013) script.js.Solcast compile failed: at script.js.Solcast:9Was möchte ich erreichen?
Das folgende Chart von Solcast in meiner VIS.
Dort kann man dann erkennen, welche prognostizierte Leistung die PV Anlage die nächsten 3 Tage bringt.
Vielleicht habt ihr einen Tipp für mich.
Vielen Dank@bernd-0 Ich hab da mal etwas in deinem LINK entfernt.
Wenn das dein persönlicher API-Key war, dann ist er jetzt verbrannt.
Der Link tut es nicht -
Hallo zusammen,
ich hoffe ihr könnt mir weiterhelfen.
Ich habe einen Link zu einem JSON Datensatz.
https://api.solcast.com.au/rooftop_sites/APIKEY???/estimated_actuals?format=json
MOD-EDIT: private Daten entfernt!Diese Daten würde ich gerne in den IOBroker laden und anschließend visaulisieren.
Leider habe ich überhaupt keine Ahnung, wie ich das schaffe :)Probiert hätte ich es mit einer Anleitung aus dem Forum:
--> Unter Scripte, neues Script, Java-Scriptvar request = require('request'); var link = 'https://api.solcast.com.au/rooftop_sites/APIKEY???/estimated_actuals?format=json'; function Solcast() { request(link, function(error,response, body) { if(error) log('Fehler request: ' + error, 'error'); else { var result = JSON.parse(body); setState('Estimate.Gen'), result.pv_estimate); // setState('Estimate.ten'), result.pv_estimate10); setState('Estimate.ninty'), result.pv_estimate90); setState('Period.End'), result.period_end); } }); } schedule('*/5 * * * *', Solcast); // alle 5 MinutenMOD-EDIT: private Daten entfernt!
Bekomme aber auch eine Fehlermeldung:
javascript.0 (1013) script.js.Solcast compile failed: at script.js.Solcast:9Was möchte ich erreichen?
Das folgende Chart von Solcast in meiner VIS.
Dort kann man dann erkennen, welche prognostizierte Leistung die PV Anlage die nächsten 3 Tage bringt.
Vielleicht habt ihr einen Tipp für mich.
Vielen Dank@bernd-0
Du musst die json Daten posten.
Sensible Daten kannst du anonymisierten, aber möglichst so das die json Struktur nicht zerstört wird.
Der link funktioniert nicht
Gut das du den api key entfernt hast.
Die Fehlermeldung bedeutet das du einen Fehler in deinem Skript hast. Achte auf die Hinweise im Editor
Der Fehler liegt in Zeile 6
Wenn du Else verwendest dann benötigst du die Klammern um den ersten Bereich ebenfalls.
Ansonsten ist das if mit dem nächsten semicolon beendetMeine Adapter und Widgets
TVProgram, SqueezeboxRPC, OpenLiga, RSSFeed, MyTime,, pi-hole2, vis-json-template, skiinfo, vis-mapwidgets, vis-2-widgets-rssfeed
Links im Profil -
@bernd-0
Du musst die json Daten posten.
Sensible Daten kannst du anonymisierten, aber möglichst so das die json Struktur nicht zerstört wird.
Der link funktioniert nicht
Gut das du den api key entfernt hast.
Die Fehlermeldung bedeutet das du einen Fehler in deinem Skript hast. Achte auf die Hinweise im Editor
Der Fehler liegt in Zeile 6
Wenn du Else verwendest dann benötigst du die Klammern um den ersten Bereich ebenfalls.
Ansonsten ist das if mit dem nächsten semicolon beendet@oliverio sagte in Visualisierung eines JSON Links:
Gut das du den api key entfernt hast.
das war ich!
-
Hallo zusammen,
Danke für euer Feedback.
Der gepostete Link ging zu einer Muster-PV Anlage - also einer Testanlage. Daher hatte ich kein Problem damit, diese Daten zur Verfügung zu stellen.Hier nochmals der Auszug dieser Muster-PV Anlage:
Viele Grüße{"estimated_actuals":[{"pv_estimate":0,"period_end":"2022-02-07T05:30:00.0000000Z","period":"PT30M"},{"pv_estimate":0,"period_end":"2022-02-07T05:00:00.0000000Z","period":"PT30M"},{"pv_estimate":0,"period_end":"2022-02-07T04:30:00.0000000Z","period":"PT30M"},{"pv_estimate":0,"period_end":"2022-02-07T04:00:00.0000000Z","period":"PT30M"},{"pv_estimate":0,"period_end":"2022-02-07T03:30:00.0000000Z","period":"PT30M"},{"pv_estimate":0,"period_end":"2022-02-07T03:00:00.0000000Z","period":"PT30M"},{"pv_estimate":0,"period_end":"2022-02-07T02:30:00.0000000Z","period":"PT30M"},{"pv_estimate":0,"period_end":"2022-02-07T02:00:00.0000000Z","period":"PT30M"},{"pv_estimate":0,"period_end":"2022-02-07T01:30:00.0000000Z","period":"PT30M"},{"pv_estimate":0,"period_end":"2022-02-07T01:00:00.0000000Z","period":"PT30M"},{"pv_estimate":0,"period_end":"2022-02-07T00:30:00.0000000Z","period":"PT30M"},{"pv_estimate":0,"period_end":"2022-02-07T00:00:00.0000000Z","period":"PT30M"},{"pv_estimate":0,"period_end":"2022-02-06T23:30:00.0000000Z","period":"PT30M"},{"pv_estimate":0,"period_end":"2022-02-06T23:00:00.0000000Z","period":"PT30M"},{"pv_estimate":0,"period_end":"2022-02-06T22:30:00.0000000Z","period":"PT30M"},{"pv_estimate":0,"period_end":"2022-02-06T22:00:00.0000000Z","period":"PT30M"},{"pv_estimate":0,"period_end":"2022-02-06T21:30:00.0000000Z","period":"PT30M"},{"pv_estimate":0,"period_end":"2022-02-06T21:00:00.0000000Z","period":"PT30M"},{"pv_estimate":0,"period_end":"2022-02-06T20:30:00.0000000Z","period":"PT30M"},{"pv_estimate":0,"period_end":"2022-02-06T20:00:00.0000000Z","period":"PT30M"},{"pv_estimate":0,"period_end":"2022-02-06T19:30:00.0000000Z","period":"PT30M"},{"pv_estimate":0,"period_end":"2022-02-06T19:00:00.0000000Z","period":"PT30M"},{"pv_estimate":0,"period_end":"2022-02-06T18:30:00.0000000Z","period":"PT30M"},{"pv_estimate":0,"period_end":"2022-02-06T18:00:00.0000000Z","period":"PT30M"},{"pv_estimate":0,"period_end":"2022-02-06T17:30:00.0000000Z","period":"PT30M"},{"pv_estimate":1.4008,"period_end":"2022-02-06T17:00:00.0000000Z","period":"PT30M"},{"pv_estimate":0.4729,"period_end":"2022-02-06T16:30:00.0000000Z","period":"PT30M"},{"pv_estimate":6.514,"period_end":"2022-02-06T16:00:00.0000000Z","period":"PT30M"},{"pv_estimate":10.9254,"period_end":"2022-02-06T15:30:00.0000000Z","period":"PT30M"},{"pv_estimate":0,"period_end":"2022-02-06T15:00:00.0000000Z","period":"PT30M"},{"pv_estimate":90.027,"period_end":"2022-02-06T14:30:00.0000000Z","period":"PT30M"},{"pv_estimate":154.3809,"period_end":"2022-02-06T14:00:00.0000000Z","period":"PT30M"},{"pv_estimate":127.1417,"period_end":"2022-02-06T13:30:00.0000000Z","period":"PT30M"},{"pv_estimate":83.1959,"period_end":"2022-02-06T13:00:00.0000000Z","period":"PT30M"},{"pv_estimate":44.8731,"period_end":"2022-02-06T12:30:00.0000000Z","period":"PT30M"},{"pv_estimate":27.7721,"period_end":"2022-02-06T12:00:00.0000000Z","period":"PT30M"},{"pv_estimate":17.2074,"period_end":"2022-02-06T11:30:00.0000000Z","period":"PT30M"},{"pv_estimate":43.5787,"period_end":"2022-02-06T11:00:00.0000000Z","period":"PT30M"},{"pv_estimate":26.9755,"period_end":"2022-02-06T10:30:00.0000000Z","period":"PT30M"},{"pv_estimate":17.9567,"period_end":"2022-02-06T10:00:00.0000000Z","period":"PT30M"},{"pv_estimate":0,"period_end":"2022-02-06T09:30:00.0000000Z","period":"PT30M"},{"pv_estimate":0,"period_end":"2022-02-06T09:00:00.0000000Z","period":"PT30M"},{"pv_estimate":0,"period_end":"2022-02-06T08:30:00.0000000Z","period":"PT30M"},{"pv_estimate":0,"period_end":"2022-02-06T08:00:00.0000000Z","period":"PT30M"},{"pv_estimate":0,"period_end":"2022-02-06T07:30:00.0000000Z","period":"PT30M"},{"pv_estimate":0,"period_end":"2022-02-06T07:00:00.0000000Z","period":"PT30M"},{"pv_estimate":0,"period_end":"2022-02-06T06:30:00.0000000Z","period":"PT30M"},{"pv_estimate":0,"period_end":"2022-02-06T06:00:00.0000000Z","period":"PT30M"},{"pv_estimate":0,"period_end":"2022-02-06T05:30:00.0000000Z","period":"PT30M"},{"pv_estimate":0,"period_end":"2022-02-06T05:00:00.0000000Z","period":"PT30M"},{"pv_estimate":0,"period_end":"2022-02-06T04:00:00.0000000Z","period":"PT30M"},{"pv_estimate":0,"period_end":"2022-02-06T03:30:00.0000000Z","period":"PT30M"},{"pv_estimate":0,"period_end":"2022-02-06T03:00:00.0000000Z","period":"PT30M"},{"pv_estimate":0,"period_end":"2022-02-06T02:30:00.0000000Z","period":"PT30M"},{"pv_estimate":0,"period_end":"2022-02-06T02:00:00.0000000Z","period":"PT30M"},{"pv_estimate":0,"period_end":"2022-02-06T01:30:00.0000000Z","period":"PT30M"},{"pv_estimate":0,"period_end":"2022-02-06T01:00:00.0000000Z","period":"PT30M"},{"pv_estimate":0,"period_end":"2022-02-06T00:30:00.0000000Z","period":"PT30M"},{"pv_estimate":0,"period_end":"2022-02-06T00:00:00.0000000Z","period":"PT30M"},{"pv_estimate":0,"period_end":"2022-02-05T23:30:00.0000000Z","period":"PT30M"},{"pv_estimate":0,"period_end":"2022-02-05T23:00:00.0000000Z","period":"PT30M"},{"pv_estimate":0,"period_end":"2022-02-05T22:30:00.0000000Z","period":"PT30M"},{"pv_estimate":0,"period_end":"2022-02-05T22:00:00.0000000Z","period":"PT30M"},{"pv_estimate":0,"period_end":"2022-02-05T21:30:00.0000000Z","period":"PT30M"},{"pv_estimate":0,"period_end":"2022-02-05T21:00:00.0000000Z","period":"PT30M"},{"pv_estimate":0,"period_end":"2022-02-05T20:30:00.0000000Z","period":"PT30M"},{"pv_estimate":0,"period_end":"2022-02-05T20:00:00.0000000Z","period":"PT30M"},{"pv_estimate":0,"period_end":"2022-02-05T19:30:00.0000000Z","period":"PT30M"},{"pv_estimate":0,"period_end":"2022-02-05T19:00:00.0000000Z","period":"PT30M"},{"pv_estimate":0,"period_end":"2022-02-05T18:30:00.0000000Z","period":"PT30M"},{"pv_estimate":0,"period_end":"2022-02-05T18:00:00.0000000Z","period":"PT30M"},{"pv_estimate":0,"period_end":"2022-02-05T17:30:00.0000000Z","period":"PT30M"},{"pv_estimate":0.4276,"period_end":"2022-02-05T17:00:00.0000000Z","period":"PT30M"},{"pv_estimate":0,"period_end":"2022-02-05T16:30:00.0000000Z","period":"PT30M"},{"pv_estimate":10.3171,"period_end":"2022-02-05T16:00:00.0000000Z","period":"PT30M"},{"pv_estimate":30.4262,"period_end":"2022-02-05T15:30:00.0000000Z","period":"PT30M"},{"pv_estimate":79.5529,"period_end":"2022-02-05T15:00:00.0000000Z","period":"PT30M"},{"pv_estimate":119.8128,"period_end":"2022-02-05T14:30:00.0000000Z","period":"PT30M"},{"pv_estimate":139.1246,"period_end":"2022-02-05T14:00:00.0000000Z","period":"PT30M"},{"pv_estimate":103.6505,"period_end":"2022-02-05T13:30:00.0000000Z","period":"PT30M"},{"pv_estimate":179.1546,"period_end":"2022-02-05T13:00:00.0000000Z","period":"PT30M"},{"pv_estimate":218.1764,"period_end":"2022-02-05T12:30:00.0000000Z","period":"PT30M"},{"pv_estimate":216.7437,"period_end":"2022-02-05T12:00:00.0000000Z","period":"PT30M"},{"pv_estimate":198.7162,"period_end":"2022-02-05T11:00:00.0000000Z","period":"PT30M"},{"pv_estimate":178.3124,"period_end":"2022-02-05T10:30:00.0000000Z","period":"PT30M"},{"pv_estimate":153.6235,"period_end":"2022-02-05T10:00:00.0000000Z","period":"PT30M"},{"pv_estimate":95.6675,"period_end":"2022-02-05T09:30:00.0000000Z","period":"PT30M"},{"pv_estimate":57.0985,"period_end":"2022-02-05T09:00:00.0000000Z","period":"PT30M"},{"pv_estimate":34.3495,"period_end":"2022-02-05T08:30:00.0000000Z","period":"PT30M"},{"pv_estimate":0,"period_end":"2022-02-05T08:00:00.0000000Z","period":"PT30M"},{"pv_estimate":0,"period_end":"2022-02-05T07:30:00.0000000Z","period":"PT30M"},{"pv_estimate":0,"period_end":"2022-02-05T07:00:00.0000000Z","period":"PT30M"},{"pv_estimate":0,"period_end":"2022-02-05T06:30:00.0000000Z","period":"PT30M"},{"pv_estimate":0,"period_end":"2022-02-05T06:00:00.0000000Z","period":"PT30M"},{"pv_estimate":0,"period_end":"2022-02-05T05:30:00.0000000Z","period":"PT30M"},{"pv_estimate":0,"period_end":"2022-02-05T05:00:00.0000000Z","period":"PT30M"},{"pv_estimate":0,"period_end":"2022-02-05T04:30:00.0000000Z","period":"PT30M"},{"pv_estimate":0,"period_end":"2022-02-05T04:00:00.0000000Z","period":"PT30M"},{"pv_estimate":0,"period_end":"2022-02-05T03:30:00.0000000Z","period":"PT30M"},{"pv_estimate":0,"period_end":"2022-02-05T03:00:00.0000000Z","period":"PT30M"},{"pv_estimate":0,"period_end":"2022-02-05T02:30:00.0000000Z","period":"PT30M"},{"pv_estimate":0,"period_end":"2022-02-05T02:00:00.0000000Z","period":"PT30M"},{"pv_estimate":0,"period_end":"2022-02-05T01:30:00.0000000Z","period":"PT30M"},{"pv_estimate":0,"period_end":"2022-02-05T01:00:00.0000000Z","period":"PT30M"},{"pv_estimate":0,"period_end":"2022-02-05T00:30:00.0000000Z","period":"PT30M"},{"pv_estimate":0,"period_end":"2022-02-05T00:00:00.0000000Z","period":"PT30M"},{"pv_estimate":0,"period_end":"2022-02-04T23:30:00.0000000Z","period":"PT30M"},{"pv_estimate":0,"period_end":"2022-02-04T23:00:00.0000000Z","period":"PT30M"},{"pv_estimate":0,"period_end":"2022-02-04T22:30:00.0000000Z","period":"PT30M"},{"pv_estimate":0,"period_end":"2022-02-04T22:00:00.0000000Z","period":"PT30M"},{"pv_estimate":0,"period_end":"2022-02-04T21:30:00.0000000Z","period":"PT30M"},{"pv_estimate":0,"period_end":"2022-02-04T21:00:00.0000000Z","period":"PT30M"},{"pv_estimate":0,"period_end":"2022-02-04T20:30:00.0000000Z","period":"PT30M"},{"pv_estimate":0,"period_end":"2022-02-04T20:00:00.0000000Z","period":"PT30M"},{"pv_estimate":0,"period_end":"2022-02-04T19:30:00.0000000Z","period":"PT30M"},{"pv_estimate":0,"period_end":"2022-02-04T19:00:00.0000000Z","period":"PT30M"},{"pv_estimate":0,"period_end":"2022-02-04T18:30:00.0000000Z","period":"PT30M"},{"pv_estimate":0,"period_end":"2022-02-04T18:00:00.0000000Z","period":"PT30M"},{"pv_estimate":0,"period_end":"2022-02-04T17:30:00.0000000Z","period":"PT30M"},{"pv_estimate":1.4177,"period_end":"2022-02-04T17:00:00.0000000Z","period":"PT30M"},{"pv_estimate":0.7991,"period_end":"2022-02-04T16:30:00.0000000Z","period":"PT30M"},{"pv_estimate":29.2681,"period_end":"2022-02-04T16:00:00.0000000Z","period":"PT30M"},{"pv_estimate":2.0421,"period_end":"2022-02-04T15:30:00.0000000Z","period":"PT30M"},{"pv_estimate":0,"period_end":"2022-02-04T15:00:00.0000000Z","period":"PT30M"},{"pv_estimate":19.0755,"period_end":"2022-02-04T14:30:00.0000000Z","period":"PT30M"},{"pv_estimate":30.0952,"period_end":"2022-02-04T14:00:00.0000000Z","period":"PT30M"},{"pv_estimate":38.9105,"period_end":"2022-02-04T13:30:00.0000000Z","period":"PT30M"},{"pv_estimate":32.8796,"period_end":"2022-02-04T13:00:00.0000000Z","period":"PT30M"},{"pv_estimate":49.8592,"period_end":"2022-02-04T12:30:00.0000000Z","period":"PT30M"},{"pv_estimate":63.5826,"period_end":"2022-02-04T12:00:00.0000000Z","period":"PT30M"},{"pv_estimate":86.639,"period_end":"2022-02-04T11:30:00.0000000Z","period":"PT30M"},{"pv_estimate":97.4399,"period_end":"2022-02-04T11:00:00.0000000Z","period":"PT30M"},{"pv_estimate":54.0412,"period_end":"2022-02-04T10:30:00.0000000Z","period":"PT30M"},{"pv_estimate":44.9124,"period_end":"2022-02-04T10:00:00.0000000Z","period":"PT30M"},{"pv_estimate":0,"period_end":"2022-02-04T09:30:00.0000000Z","period":"PT30M"},{"pv_estimate":0,"period_end":"2022-02-04T09:00:00.0000000Z","period":"PT30M"},{"pv_estimate":0,"period_end":"2022-02-04T08:30:00.0000000Z","period":"PT30M"},{"pv_estimate":0,"period_end":"2022-02-04T08:00:00.0000000Z","period":"PT30M"},{"pv_estimate":0,"period_end":"2022-02-04T07:30:00.0000000Z","period":"PT30M"},{"pv_estimate":0,"period_end":"2022-02-04T07:00:00.0000000Z","period":"PT30M"},{"pv_estimate":0,"period_end":"2022-02-04T06:30:00.0000000Z","period":"PT30M"},{"pv_estimate":0,"period_end":"2022-02-04T06:00:00.0000000Z","period":"PT30M"},{"pv_estimate":0,"period_end":"2022-02-04T05:30:00.0000000Z","period":"PT30M"},{"pv_estimate":0,"period_end":"2022-02-04T05:00:00.0000000Z","period":"PT30M"},{"pv_estimate":0,"period_end":"2022-02-04T04:30:00.0000000Z","period":"PT30M"},{"pv_estimate":0,"period_end":"2022-02-04T04:00:00.0000000Z","period":"PT30M"},{"pv_estimate":0,"period_end":"2022-02-04T03:30:00.0000000Z","period":"PT30M"},{"pv_estimate":0,"period_end":"2022-02-04T03:00:00.0000000Z","period":"PT30M"},{"pv_estimate":0,"period_end":"2022-02-04T02:30:00.0000000Z","period":"PT30M"},{"pv_estimate":0,"period_end":"2022-02-04T02:00:00.0000000Z","period":"PT30M"},{"pv_estimate":0,"period_end":"2022-02-04T01:30:00.0000000Z","period":"PT30M"},{"pv_estimate":0,"period_end":"2022-02-04T01:00:00.0000000Z","period":"PT30M"},{"pv_estimate":0,"period_end":"2022-02-04T00:30:00.0000000Z","period":"PT30M"},{"pv_estimate":0,"period_end":"2022-02-04T00:00:00.0000000Z","period":"PT30M"},{"pv_estimate":0,"period_end":"2022-02-03T23:30:00.0000000Z","period":"PT30M"},{"pv_estimate":0,"period_end":"2022-02-03T23:00:00.0000000Z","period":"PT30M"},{"pv_estimate":0,"period_end":"2022-02-03T22:30:00.0000000Z","period":"PT30M"},{"pv_estimate":0,"period_end":"2022-02-03T22:00:00.0000000Z","period":"PT30M"},{"pv_estimate":0,"period_end":"2022-02-03T21:30:00.0000000Z","period":"PT30M"},{"pv_estimate":0,"period_end":"2022-02-03T21:00:00.0000000Z","period":"PT30M"},{"pv_estimate":0,"period_end":"2022-02-03T20:30:00.0000000Z","period":"PT30M"},{"pv_estimate":0,"period_end":"2022-02-03T20:00:00.0000000Z","period":"PT30M"},{"pv_estimate":0,"period_end":"2022-02-03T19:30:00.0000000Z","period":"PT30M"},{"pv_estimate":0,"period_end":"2022-02-03T19:00:00.0000000Z","period":"PT30M"},{"pv_estimate":0,"period_end":"2022-02-03T18:30:00.0000000Z","period":"PT30M"},{"pv_estimate":0,"period_end":"2022-02-03T18:00:00.0000000Z","period":"PT30M"},{"pv_estimate":0,"period_end":"2022-02-03T17:30:00.0000000Z","period":"PT30M"},{"pv_estimate":0.6683,"period_end":"2022-02-03T17:00:00.0000000Z","period":"PT30M"},{"pv_estimate":0,"period_end":"2022-02-03T16:30:00.0000000Z","period":"PT30M"},{"pv_estimate":9.275,"period_end":"2022-02-03T16:00:00.0000000Z","period":"PT30M"},{"pv_estimate":5.1394,"period_end":"2022-02-03T15:30:00.0000000Z","period":"PT30M"},{"pv_estimate":3.3641,"period_end":"2022-02-03T15:00:00.0000000Z","period":"PT30M"},{"pv_estimate":33.99,"period_end":"2022-02-03T14:30:00.0000000Z","period":"PT30M"},{"pv_estimate":25.8192,"period_end":"2022-02-03T14:00:00.0000000Z","period":"PT30M"},{"pv_estimate":38.9044,"period_end":"2022-02-03T13:30:00.0000000Z","period":"PT30M"},{"pv_estimate":46.2429,"period_end":"2022-02-03T13:00:00.0000000Z","period":"PT30M"},{"pv_estimate":72.6184,"period_end":"2022-02-03T12:30:00.0000000Z","period":"PT30M"},{"pv_estimate":72.8343,"period_end":"2022-02-03T12:00:00.0000000Z","period":"PT30M"},{"pv_estimate":34.8576,"period_end":"2022-02-03T11:30:00.0000000Z","period":"PT30M"},{"pv_estimate":71.505,"period_end":"2022-02-03T11:00:00.0000000Z","period":"PT30M"},{"pv_estimate":51.0853,"period_end":"2022-02-03T10:30:00.0000000Z","period":"PT30M"},{"pv_estimate":30.4377,"period_end":"2022-02-03T10:00:00.0000000Z","period":"PT30M"},{"pv_estimate":0,"period_end":"2022-02-03T09:30:00.0000000Z","period":"PT30M"},{"pv_estimate":0,"period_end":"2022-02-03T09:00:00.0000000Z","period":"PT30M"},{"pv_estimate":0,"period_end":"2022-02-03T08:30:00.0000000Z","period":"PT30M"},{"pv_estimate":0,"period_end":"2022-02-03T08:00:00.0000000Z","period":"PT30M"},{"pv_estimate":0,"period_end":"2022-02-03T07:30:00.0000000Z","period":"PT30M"},{"pv_estimate":0,"period_end":"2022-02-03T07:00:00.0000000Z","period":"PT30M"},{"pv_estimate":0,"period_end":"2022-02-03T06:30:00.0000000Z","period":"PT30M"},{"pv_estimate":0,"period_end":"2022-02-03T06:00:00.0000000Z","period":"PT30M"},{"pv_estimate":0,"period_end":"2022-02-03T05:30:00.0000000Z","period":"PT30M"},{"pv_estimate":0,"period_end":"2022-02-03T05:00:00.0000000Z","period":"PT30M"},{"pv_estimate":0,"period_end":"2022-02-03T04:30:00.0000000Z","period":"PT30M"},{"pv_estimate":0,"period_end":"2022-02-03T04:00:00.0000000Z","period":"PT30M"},{"pv_estimate":0,"period_end":"2022-02-03T03:30:00.0000000Z","period":"PT30M"},{"pv_estimate":0,"period_end":"2022-02-03T03:00:00.0000000Z","period":"PT30M"},{"pv_estimate":0,"period_end":"2022-02-03T02:30:00.0000000Z","period":"PT30M"},{"pv_estimate":0,"period_end":"2022-02-03T02:00:00.0000000Z","period":"PT30M"},{"pv_estimate":0,"period_end":"2022-02-03T01:30:00.0000000Z","period":"PT30M"},{"pv_estimate":0,"period_end":"2022-02-03T01:00:00.0000000Z","period":"PT30M"},{"pv_estimate":0,"period_end":"2022-02-03T00:30:00.0000000Z","period":"PT30M"},{"pv_estimate":0,"period_end":"2022-02-03T00:00:00.0000000Z","period":"PT30M"},{"pv_estimate":0,"period_end":"2022-02-02T23:30:00.0000000Z","period":"PT30M"},{"pv_estimate":0,"period_end":"2022-02-02T23:00:00.0000000Z","period":"PT30M"},{"pv_estimate":0,"period_end":"2022-02-02T22:30:00.0000000Z","period":"PT30M"},{"pv_estimate":0,"period_end":"2022-02-02T22:00:00.0000000Z","period":"PT30M"},{"pv_estimate":0,"period_end":"2022-02-02T21:30:00.0000000Z","period":"PT30M"},{"pv_estimate":0,"period_end":"2022-02-02T21:00:00.0000000Z","period":"PT30M"},{"pv_estimate":0,"period_end":"2022-02-02T20:30:00.0000000Z","period":"PT30M"},{"pv_estimate":0,"period_end":"2022-02-02T20:00:00.0000000Z","period":"PT30M"},{"pv_estimate":0,"period_end":"2022-02-02T19:30:00.0000000Z","period":"PT30M"},{"pv_estimate":0,"period_end":"2022-02-02T19:00:00.0000000Z","period":"PT30M"},{"pv_estimate":0,"period_end":"2022-02-02T18:30:00.0000000Z","period":"PT30M"},{"pv_estimate":0,"period_end":"2022-02-02T18:00:00.0000000Z","period":"PT30M"},{"pv_estimate":0,"period_end":"2022-02-02T17:30:00.0000000Z","period":"PT30M"},{"pv_estimate":0,"period_end":"2022-02-02T17:00:00.0000000Z","period":"PT30M"},{"pv_estimate":0,"period_end":"2022-02-02T16:30:00.0000000Z","period":"PT30M"},{"pv_estimate":0.9604,"period_end":"2022-02-02T16:00:00.0000000Z","period":"PT30M"},{"pv_estimate":0.2394,"period_end":"2022-02-02T15:30:00.0000000Z","period":"PT30M"},{"pv_estimate":0.5669,"period_end":"2022-02-02T15:00:00.0000000Z","period":"PT30M"},{"pv_estimate":7.4592,"period_end":"2022-02-02T14:30:00.0000000Z","period":"PT30M"},{"pv_estimate":24.8771,"period_end":"2022-02-02T14:00:00.0000000Z","period":"PT30M"},{"pv_estimate":62.5652,"period_end":"2022-02-02T13:30:00.0000000Z","period":"PT30M"},{"pv_estimate":56.3227,"period_end":"2022-02-02T13:00:00.0000000Z","period":"PT30M"},{"pv_estimate":76.8663,"period_end":"2022-02-02T12:30:00.0000000Z","period":"PT30M"},{"pv_estimate":160.8489,"period_end":"2022-02-02T12:00:00.0000000Z","period":"PT30M"},{"pv_estimate":182.9195,"period_end":"2022-02-02T11:30:00.0000000Z","period":"PT30M"},{"pv_estimate":183.6663,"period_end":"2022-02-02T11:00:00.0000000Z","period":"PT30M"},{"pv_estimate":165.0764,"period_end":"2022-02-02T10:30:00.0000000Z","period":"PT30M"},{"pv_estimate":142.4989,"period_end":"2022-02-02T10:00:00.0000000Z","period":"PT30M"},{"pv_estimate":59.9532,"period_end":"2022-02-02T09:30:00.0000000Z","period":"PT30M"},{"pv_estimate":14.364,"period_end":"2022-02-02T09:00:00.0000000Z","period":"PT30M"},{"pv_estimate":0,"period_end":"2022-02-02T08:30:00.0000000Z","period":"PT30M"},{"pv_estimate":0,"period_end":"2022-02-02T08:00:00.0000000Z","period":"PT30M"},{"pv_estimate":0,"period_end":"2022-02-02T07:30:00.0000000Z","period":"PT30M"},{"pv_estimate":0,"period_end":"2022-02-02T07:00:00.0000000Z","period":"PT30M"},{"pv_estimate":0,"period_end":"2022-02-02T06:30:00.0000000Z","period":"PT30M"},{"pv_estimate":0,"period_end":"2022-02-02T06:00:00.0000000Z","period":"PT30M"},{"pv_estimate":0,"period_end":"2022-02-02T05:30:00.0000000Z","period":"PT30M"},{"pv_estimate":0,"period_end":"2022-02-02T05:00:00.0000000Z","period":"PT30M"},{"pv_estimate":0,"period_end":"2022-02-02T04:30:00.0000000Z","period":"PT30M"},{"pv_estimate":0,"period_end":"2022-02-02T04:00:00.0000000Z","period":"PT30M"},{"pv_estimate":0,"period_end":"2022-02-02T03:30:00.0000000Z","period":"PT30M"},{"pv_estimate":0,"period_end":"2022-02-02T03:00:00.0000000Z","period":"PT30M"},{"pv_estimate":0,"period_end":"2022-02-02T02:30:00.0000000Z","period":"PT30M"},{"pv_estimate":0,"period_end":"2022-02-02T02:00:00.0000000Z","period":"PT30M"},{"pv_estimate":0,"period_end":"2022-02-02T01:30:00.0000000Z","period":"PT30M"},{"pv_estimate":0,"period_end":"2022-02-02T01:00:00.0000000Z","period":"PT30M"},{"pv_estimate":0,"period_end":"2022-02-02T00:30:00.0000000Z","period":"PT30M"},{"pv_estimate":0,"period_end":"2022-02-02T00:00:00.0000000Z","period":"PT30M"},{"pv_estimate":0,"period_end":"2022-02-01T23:30:00.0000000Z","period":"PT30M"},{"pv_estimate":0,"period_end":"2022-02-01T23:00:00.0000000Z","period":"PT30M"},{"pv_estimate":0,"period_end":"2022-02-01T22:30:00.0000000Z","period":"PT30M"},{"pv_estimate":0,"period_end":"2022-02-01T22:00:00.0000000Z","period":"PT30M"},{"pv_estimate":0,"period_end":"2022-02-01T21:30:00.0000000Z","period":"PT30M"},{"pv_estimate":0,"period_end":"2022-02-01T21:00:00.0000000Z","period":"PT30M"},{"pv_estimate":0,"period_end":"2022-02-01T20:30:00.0000000Z","period":"PT30M"},{"pv_estimate":0,"period_end":"2022-02-01T20:00:00.0000000Z","period":"PT30M"},{"pv_estimate":0,"period_end":"2022-02-01T19:30:00.0000000Z","period":"PT30M"},{"pv_estimate":0,"period_end":"2022-02-01T19:00:00.0000000Z","period":"PT30M"},{"pv_estimate":0,"period_end":"2022-02-01T18:30:00.0000000Z","period":"PT30M"},{"pv_estimate":0,"period_end":"2022-02-01T18:00:00.0000000Z","period":"PT30M"},{"pv_estimate":0,"period_end":"2022-02-01T17:30:00.0000000Z","period":"PT30M"},{"pv_estimate":0.173,"period_end":"2022-02-01T17:00:00.0000000Z","period":"PT30M"},{"pv_estimate":0,"period_end":"2022-02-01T16:30:00.0000000Z","period":"PT30M"},{"pv_estimate":20.173,"period_end":"2022-02-01T16:00:00.0000000Z","period":"PT30M"},{"pv_estimate":41.8982,"period_end":"2022-02-01T15:30:00.0000000Z","period":"PT30M"},{"pv_estimate":71.7316,"period_end":"2022-02-01T15:00:00.0000000Z","period":"PT30M"},{"pv_estimate":92.5913,"period_end":"2022-02-01T14:30:00.0000000Z","period":"PT30M"},{"pv_estimate":43.1672,"period_end":"2022-02-01T14:00:00.0000000Z","period":"PT30M"},{"pv_estimate":59.5147,"period_end":"2022-02-01T13:30:00.0000000Z","period":"PT30M"},{"pv_estimate":82.1838,"period_end":"2022-02-01T13:00:00.0000000Z","period":"PT30M"},{"pv_estimate":78.4299,"period_end":"2022-02-01T12:30:00.0000000Z","period":"PT30M"},{"pv_estimate":58.6752,"period_end":"2022-02-01T12:00:00.0000000Z","period":"PT30M"},{"pv_estimate":43.9562,"period_end":"2022-02-01T11:30:00.0000000Z","period":"PT30M"},{"pv_estimate":59.3669,"period_end":"2022-02-01T11:00:00.0000000Z","period":"PT30M"},{"pv_estimate":28.8367,"period_end":"2022-02-01T10:30:00.0000000Z","period":"PT30M"},{"pv_estimate":18.7511,"period_end":"2022-02-01T10:00:00.0000000Z","period":"PT30M"},{"pv_estimate":0,"period_end":"2022-02-01T09:30:00.0000000Z","period":"PT30M"},{"pv_estimate":0,"period_end":"2022-02-01T09:00:00.0000000Z","period":"PT30M"},{"pv_estimate":0,"period_end":"2022-02-01T08:30:00.0000000Z","period":"PT30M"},{"pv_estimate":0,"period_end":"2022-02-01T08:00:00.0000000Z","period":"PT30M"},{"pv_estimate":0,"period_end":"2022-02-01T07:30:00.0000000Z","period":"PT30M"},{"pv_estimate":0,"period_end":"2022-02-01T07:00:00.0000000Z","period":"PT30M"},{"pv_estimate":0,"period_end":"2022-02-01T06:30:00.0000000Z","period":"PT30M"},{"pv_estimate":0,"period_end":"2022-02-01T06:00:00.0000000Z","period":"PT30M"},{"pv_estimate":0,"period_end":"2022-02-01T05:30:00.0000000Z","period":"PT30M"},{"pv_estimate":0,"period_end":"2022-02-01T05:00:00.0000000Z","period":"PT30M"},{"pv_estimate":0,"period_end":"2022-02-01T04:30:00.0000000Z","period":"PT30M"},{"pv_estimate":0,"period_end":"2022-02-01T04:00:00.0000000Z","period":"PT30M"},{"pv_estimate":0,"period_end":"2022-02-01T03:30:00.0000000Z","period":"PT30M"},{"pv_estimate":0,"period_end":"2022-02-01T03:00:00.0000000Z","period":"PT30M"},{"pv_estimate":0,"period_end":"2022-02-01T02:30:00.0000000Z","period":"PT30M"},{"pv_estimate":0,"period_end":"2022-02-01T02:00:00.0000000Z","period":"PT30M"},{"pv_estimate":0,"period_end":"2022-02-01T01:30:00.0000000Z","period":"PT30M"},{"pv_estimate":0,"period_end":"2022-02-01T01:00:00.0000000Z","period":"PT30M"},{"pv_estimate":0,"period_end":"2022-02-01T00:30:00.0000000Z","period":"PT30M"},{"pv_estimate":0,"period_end":"2022-02-01T00:00:00.0000000Z","period":"PT30M"},{"pv_estimate":0,"period_end":"2022-01-31T23:30:00.0000000Z","period":"PT30M"},{"pv_estimate":0,"period_end":"2022-01-31T23:00:00.0000000Z","period":"PT30M"},{"pv_estimate":0,"period_end":"2022-01-31T22:30:00.0000000Z","period":"PT30M"},{"pv_estimate":0,"period_end":"2022-01-31T22:00:00.0000000Z","period":"PT30M"},{"pv_estimate":0,"period_end":"2022-01-31T21:30:00.0000000Z","period":"PT30M"},{"pv_estimate":0,"period_end":"2022-01-31T21:00:00.0000000Z","period":"PT30M"},{"pv_estimate":0,"period_end":"2022-01-31T20:30:00.0000000Z","period":"PT30M"},{"pv_estimate":0,"period_end":"2022-01-31T20:00:00.0000000Z","period":"PT30M"},{"pv_estimate":0,"period_end":"2022-01-31T19:30:00.0000000Z","period":"PT30M"},{"pv_estimate":0,"period_end":"2022-01-31T19:00:00.0000000Z","period":"PT30M"},{"pv_estimate":0,"period_end":"2022-01-31T18:30:00.0000000Z","period":"PT30M"},{"pv_estimate":0,"period_end":"2022-01-31T18:00:00.0000000Z","period":"PT30M"},{"pv_estimate":0,"period_end":"2022-01-31T17:30:00.0000000Z","period":"PT30M"},{"pv_estimate":0,"period_end":"2022-01-31T17:00:00.0000000Z","period":"PT30M"},{"pv_estimate":3.1284,"period_end":"2022-01-31T16:30:00.0000000Z","period":"PT30M"},{"pv_estimate":21.9603,"period_end":"2022-01-31T16:00:00.0000000Z","period":"PT30M"},{"pv_estimate":24.2309,"period_end":"2022-01-31T15:30:00.0000000Z","period":"PT30M"},{"pv_estimate":40.43,"period_end":"2022-01-31T15:00:00.0000000Z","period":"PT30M"},{"pv_estimate":21.4607,"period_end":"2022-01-31T14:30:00.0000000Z","period":"PT30M"},{"pv_estimate":31.9142,"period_end":"2022-01-31T14:00:00.0000000Z","period":"PT30M"},{"pv_estimate":18.977,"period_end":"2022-01-31T13:30:00.0000000Z","period":"PT30M"},{"pv_estimate":14.2269,"period_end":"2022-01-31T13:00:00.0000000Z","period":"PT30M"},{"pv_estimate":6.4584,"period_end":"2022-01-31T12:30:00.0000000Z","period":"PT30M"},{"pv_estimate":2.6764,"period_end":"2022-01-31T12:00:00.0000000Z","period":"PT30M"},{"pv_estimate":2.0448,"period_end":"2022-01-31T11:30:00.0000000Z","period":"PT30M"},{"pv_estimate":87.9439,"period_end":"2022-01-31T11:00:00.0000000Z","period":"PT30M"},{"pv_estimate":5.6658,"period_end":"2022-01-31T10:30:00.0000000Z","period":"PT30M"},{"pv_estimate":0,"period_end":"2022-01-31T10:00:00.0000000Z","period":"PT30M"},{"pv_estimate":0,"period_end":"2022-01-31T09:30:00.0000000Z","period":"PT30M"},{"pv_estimate":0,"period_end":"2022-01-31T09:00:00.0000000Z","period":"PT30M"},{"pv_estimate":21.7211,"period_end":"2022-01-31T08:30:00.0000000Z","period":"PT30M"},{"pv_estimate":1.9363,"period_end":"2022-01-31T08:00:00.0000000Z","period":"PT30M"},{"pv_estimate":0,"period_end":"2022-01-31T07:30:00.0000000Z","period":"PT30M"},{"pv_estimate":0,"period_end":"2022-01-31T07:00:00.0000000Z","period":"PT30M"},{"pv_estimate":0,"period_end":"2022-01-31T06:30:00.0000000Z","period":"PT30M"},{"pv_estimate":0,"period_end":"2022-01-31T06:00:00.0000000Z","period":"PT30M"}]} -
@bernd-0
Du musst die json Daten posten.
Sensible Daten kannst du anonymisierten, aber möglichst so das die json Struktur nicht zerstört wird.
Der link funktioniert nicht
Gut das du den api key entfernt hast.
Die Fehlermeldung bedeutet das du einen Fehler in deinem Skript hast. Achte auf die Hinweise im Editor
Der Fehler liegt in Zeile 6
Wenn du Else verwendest dann benötigst du die Klammern um den ersten Bereich ebenfalls.
Ansonsten ist das if mit dem nächsten semicolon beendet@oliverio sagte in Visualisierung eines JSON Links:
Der Fehler liegt in Zeile 6
Nein.
Der Fehler ist in Zeile 9-12, da ist in jeder Zeile die ")" vor dem Komma zu viel.
Auch wenn es nicht falsch ist request zu verwenden solltest du auf axios wechseln, weil request nicht mehr gepflegt wird.
-
-
@bernd-0 ist das jetzt eine Vorhersage oder Daten aus der Vergangenheit?
Für deinen Fall bietet sich wohl Material Design Widgets: JSON Chart Widget an um die Daten zu Visualisieren.
let request = require('request');
let link = 'https://api.solcast.com.au/rooftop_sites/APIKEY???/estimated_actuals?format=json';

function Solcast() {
    request(link, function(error,response, body) {
        if(error) log('Fehler request: ' + error, 'error');
        else {
            var result = JSON.parse(body);
            setState('0_userdata.0.solcast.estimate', result.pv_estimate);
        }
    });
}

schedule('*/5 * * * *', Solcast);  // alle 5 Minuten
So holt er sich alle 5 Minuten das JSON und legt es in dem Datenpunkt ab. Den Datenpunkt "0_userdata.0.solcast.estimate" musst du noch im Objektbaum anlegen.
Persönlicher Support
Spenden -> paypal.me/J3YC33 -
@bernd-0 ist das jetzt eine Vorhersage oder Daten aus der Vergangenheit?
Für deinen Fall bietet sich wohl Material Design Widgets: JSON Chart Widget an um die Daten zu Visualisieren.
let request = require('request');
let link = 'https://api.solcast.com.au/rooftop_sites/APIKEY???/estimated_actuals?format=json';

function Solcast() {
    request(link, function(error,response, body) {
        if(error) log('Fehler request: ' + error, 'error');
        else {
            var result = JSON.parse(body);
            setState('0_userdata.0.solcast.estimate', result.pv_estimate);
        }
    });
}

schedule('*/5 * * * *', Solcast);  // alle 5 Minuten
So holt er sich alle 5 Minuten das JSON und legt es in dem Datenpunkt ab. Den Datenpunkt "0_userdata.0.solcast.estimate" musst du noch im Objektbaum anlegen.
@jey-cee said in Visualisierung eines JSON Links:
0_userdata.0.solcast.estimate
Danke für deine Unterstützung Jey-Cee.
Ich habe das Skript kopiert, die URL ausgetauscht und es gestartet.
Den Datenpunkt habe ich im Objektbaum angelegt.
Leider wird kein Wert in den Datenpunkt geschrieben. Muss ich noch etwas tun?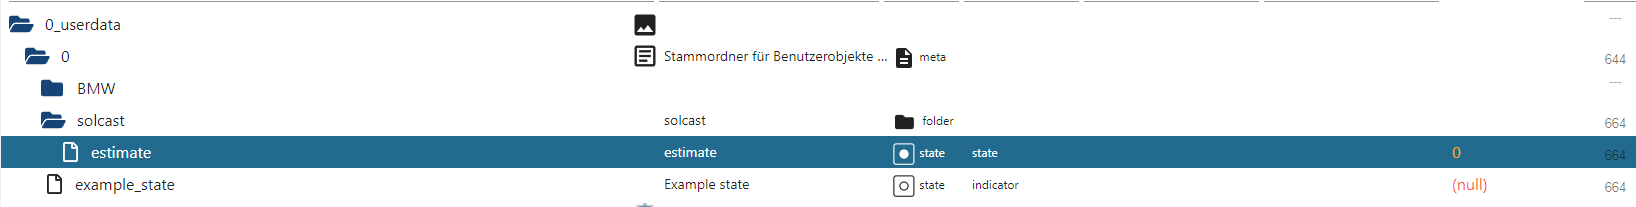
-
@bernd-0 ist das jetzt eine Vorhersage oder Daten aus der Vergangenheit?
Für deinen Fall bietet sich wohl Material Design Widgets: JSON Chart Widget an um die Daten zu Visualisieren.
let request = require('request');
let link = 'https://api.solcast.com.au/rooftop_sites/APIKEY???/estimated_actuals?format=json';

function Solcast() {
    request(link, function(error,response, body) {
        if(error) log('Fehler request: ' + error, 'error');
        else {
            var result = JSON.parse(body);
            setState('0_userdata.0.solcast.estimate', result.pv_estimate);
        }
    });
}

schedule('*/5 * * * *', Solcast);  // alle 5 Minuten
So holt er sich alle 5 Minuten das JSON und legt es in dem Datenpunkt ab. Den Datenpunkt "0_userdata.0.solcast.estimate" musst du noch im Objektbaum anlegen.
-
@jey-cee said in Visualisierung eines JSON Links:
0_userdata.0.solcast.estimate
Danke für deine Unterstützung Jey-Cee.
Ich habe das Skript kopiert, die URL ausgetauscht und es gestartet.
Den Datenpunkt habe ich im Objektbaum angelegt.
Leider wird kein Wert in den Datenpunkt geschrieben. Muss ich noch etwas tun?@bernd-0 da war noch ein Fehler in Zeile 9
let request = require('request'); let link = 'https://api.solcast.com.au/rooftop_sites/APIKEY???/estimated_actuals?format=json'; function Solcast() { request(link, function(error,response, body) { if(error) log('Fehler request: ' + error, 'error'); else { var result = JSON.parse(body); setState('0_userdata.0.solcast.estimate', result.estimated_actuals); } }); } schedule('*/5 * * * *', Solcast); // alle 5 Minuten -
Hallo Jey-Cee,
so ganz komme ich nicht mit.
Der Json Datensatz zeigt die Daten der PV für die nächsten 3 Tage. Für ein Diagramm bräuchte ich doch x und y Wert. Also als x-Achse den Zeitstempel und als Y den Forecastwert.
Mit dem Script wird doch nur ein Wert abgefragt, oder? Damit kann ich aber kein Diagramm erzeugen?
Viele Grüße -
@bernd-0 sagte in Visualisierung eines JSON Links:
Könnte mir nochmal jemand einen Tipp geben, wie ich weitermachen kann?
nein!
du kannst keine Timestamps für die x-Achse "manipulieren"kein Support per PN! - Fragen im Forum stellen - es gibt fast nichts, was nicht auch für andere interessant ist.
Benutzt das Voting rechts unten im Beitrag wenn er euch geholfen hat.
der Installationsfixer: curl -fsL https://iobroker.net/fix.sh | bash -
-
@bernd-0 sagte in Visualisierung eines JSON Links:
Könnte mir nochmal jemand einen Tipp geben, wie ich weitermachen kann?
nein!
du kannst keine Timestamps für die x-Achse "manipulieren" -
@homoran Aber ich will ja garnichts manipulieren? In dem JSON Datensatz sind ja Zeitwerte vorhanden? z.B. "period_end":"2022-02-06T21:30:00.0000000Z"
@bernd-0 sagte in Visualisierung eines JSON Links:
Aber ich will ja garnichts manipulieren?
doch, willst du!
für die x-Achse wird immer der Wert des Timestams der Änderung des Werts im Datenpunkt genommen
Das lässt sich nicht ändern -
Ok, dann müsste ich nochmal abschließend fragen.
Aus dem JSON-Datensatz kann ich mir also nicht wie oben beschrieben die gewünschte Kurve in der VIS anzeigen lassen? Gibt es noch eine andere Möglichkeit, wie ich an die Grafik ran komme? (Ich habe leider nur den Json Datensatz) -
Ok, dann müsste ich nochmal abschließend fragen.
Aus dem JSON-Datensatz kann ich mir also nicht wie oben beschrieben die gewünschte Kurve in der VIS anzeigen lassen? Gibt es noch eine andere Möglichkeit, wie ich an die Grafik ran komme? (Ich habe leider nur den Json Datensatz)@bernd-0 sagte in Visualisierung eines JSON Links:
Aus dem JSON-Datensatz kann ich mir also nicht wie oben beschrieben die gewünschte Kurve in der VIS anzeigen lassen?
zumindest nicht zusammen mit Bestandsdaten aus der History.
Jey_Cee hatte dir ein Material-Widget verlinkt, dass das kann:
JSON Chart Widgetkein Support per PN! - Fragen im Forum stellen - es gibt fast nichts, was nicht auch für andere interessant ist.
Benutzt das Voting rechts unten im Beitrag wenn er euch geholfen hat.
der Installationsfixer: curl -fsL https://iobroker.net/fix.sh | bash -
-
@bernd-0 sagte in Visualisierung eines JSON Links:
Aus dem JSON-Datensatz kann ich mir also nicht wie oben beschrieben die gewünschte Kurve in der VIS anzeigen lassen?
zumindest nicht zusammen mit Bestandsdaten aus der History.
Jey_Cee hatte dir ein Material-Widget verlinkt, dass das kann:
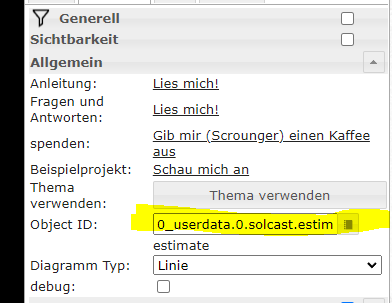
JSON Chart Widget@homoran Hmm, ja in dem Topic habe ich mich auch versucht dran zu hängen, aber hat noch niemand meinen Hilferuf aufgenommen. Ich habe mir in der VIS ein JSON Chart rein gezogen, kann aber nicht sehen, wo ich die URL bzw. den JSON String hinterlegen könnte. Ich kann nur einen Datenpunkt aus der Bibliothek auswählen, was mich dazu gebracht hatte zu denken, dass man den JSON String erst irgendwie in IOBroker einlesen muss.
-
@homoran Hmm, ja in dem Topic habe ich mich auch versucht dran zu hängen, aber hat noch niemand meinen Hilferuf aufgenommen. Ich habe mir in der VIS ein JSON Chart rein gezogen, kann aber nicht sehen, wo ich die URL bzw. den JSON String hinterlegen könnte. Ich kann nur einen Datenpunkt aus der Bibliothek auswählen, was mich dazu gebracht hatte zu denken, dass man den JSON String erst irgendwie in IOBroker einlesen muss.
@bernd-0 sagte in Visualisierung eines JSON Links:
Ich kann nur einen Datenpunkt aus der Bibliothek auswählen, was mich dazu gebracht hatte zu denken, dass man den JSON String erst irgendwie in IOBroker einlesen muss.
Das ist zumindest üblich.
Ob man da ggf auch einen Link einfügen könnte müsste in der Anleitung stehen.
Dafür gibt es ja anscheinend einige Klick-MichIch würde je nach Genauigkeit und Priotrität ein bis zweimal am Tag das JSON in einen Datenpunkt einlesen und diesen dann visualisieren
Support us
376
Online32.6k
Users82.1k
Topics1.3m
Posts