NEWS
HowTo: Zusatz-Programme fuer jarvis v3
-
@recaremo Wonach soll noch sortiert werden?
Erstmal v1.0.2 erstellt. -
@mcu said in HowTo: Zusatz-Programme fuer jarvis v3:
@recaremo Das musst du als Feature in github für den tankerkoenig-Adapter mal empfehlen.
Ich nutze den DPtankerkoenig.0.stations.jsonTablefür die Verarbeitung. Dort ist keine Street mit drin und auch keine ID. Also kann ich von meiner Seite aus nichts machen, es wäre auch nur Raten.evtl. hier ergänzen
https://github.com/iobroker-community-adapters/ioBroker.tankerkoenig/issues/116EDIT: habe doch noch eine Möglichkeit gefunden
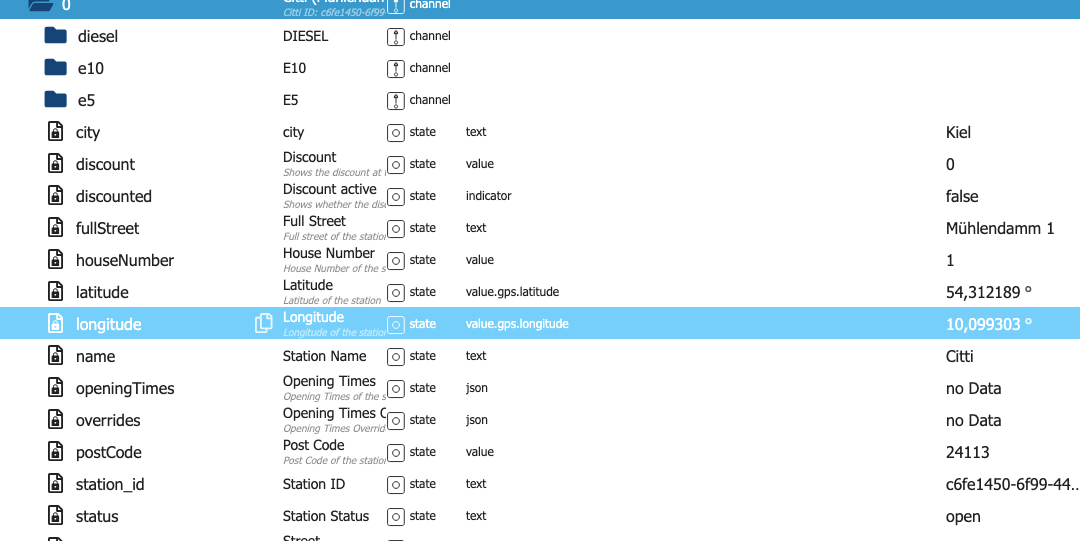
Bei meine Adapter von Tankerkönig wird die Straße und einiges mehr angezeigt.
-
-
Tolle Erweiterungen des Scriptes -inzwischen Tankerkönig 1.03.
https://mcuiobroker.gitbook.io/jarvis-infos/jarvis-v3/system-effektprog./tankerkoenig#v1.0.3
Vielen Dank.
-
@mabbi Übernommen von https://forum.iobroker.net/topic/39172/test-echarts-adapter/648
Zeig mal die Presets in echarts.0 und die Objekteigenschaften zum echarts.0.D_Energie_copy. In CodeTags </>.
Also echartDP muss schon mal '0_userdata.0.echarts'; sein, sonst kann es ja nicht funktionieren.
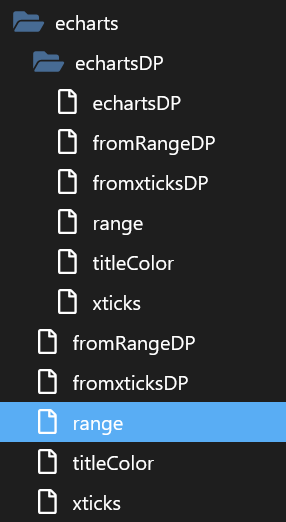
Da hast du ein wenig mit dem echartDP gespielt -> muss du komplett löschen
Und den echartDP so lassen wie er war ->'0_userdata.0.echarts'; -
@Mabbi

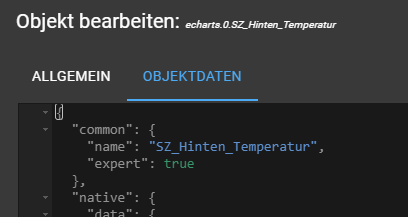
Expertenmodus einschalten

und dann die Objekt daten in Codetags
-
@mcu: Ich bin mir nicht ganz sicher, was gemeint ist .... ?


{ "common": { "read": true, "write": true, "name": "eCharts-DP", "type": "string", "role": "state", "def": "" }, "native": {}, "type": "state", "from": "system.adapter.javascript.0", "user": "system.user.admin", "ts": 1755774987903, "_id": "0_userdata.0.echarts.echartsDP", "acl": { "object": 1636, "state": 1636, "owner": "system.user.admin", "ownerGroup": "system.group.administrator" } } -
@mabbi Sorry von energie, du woltest ja das erstmal nutzen

-
{ "common": { "name": "D_Energie copy" }, "native": { "url": "", "data": { "lines": [ { "name": "Leistung gesamt", "id": "0_userdata.0.Datenpunkte.PV.Leistung_gesamt", "instance": "system.adapter.sql.0", "thickness": "1", "chartType": "auto", "aggregate": "max", "isBoolean": null, "symbolSize": 3, "validTime": "", "unit": " kW", "color": "#1a98a6", "fill": 0.2, "shadowsize": "", "min": "-14", "max": "20", "ignoreNull": "0", "noFuture": false, "percentile": 50, "integralUnit": 60, "integralInterpolation": "none", "yticks": "-1", "xaxe": "", "xticks": "6", "yOffset": "0", "points": false, "hide": false, "yaxe": "left", "convert": "val / 1000", "afterComma": "3" }, { "name": "EV-Ladestrom", "id": "0_userdata.0.Datenpunkte.EV_Wallbox.EV-Ladestrom", "instance": "system.adapter.history.0", "thickness": "1", "chartType": "auto", "aggregate": "max", "isBoolean": null, "symbolSize": 3, "validTime": "", "fill": 0.2, "min": "-8", "max": "22", "convert": "val / 1000 * -1", "color": "#702ce6", "xticks": "4", "commonYAxis": "0", "ignoreNull": "0" }, { "name": "Eigenverbrauch", "id": "0_userdata.0.Datenpunkte.Strom.Eigenverbrauch", "instance": "system.adapter.sql.0", "thickness": "1", "chartType": "auto", "aggregate": "onchange", "isBoolean": null, "symbolSize": 3, "validTime": 35, "fill": 0.2, "min": "-8", "max": "22", "convert": "val / 1000 * -1", "color": "#00687d", "xticks": "4", "commonYAxis": "0", "ignoreNull": "0" }, { "name": "Netzbezug", "id": "0_userdata.0.Datenpunkte.Strom.Netzbezug", "instance": "system.adapter.sql.0", "thickness": "1", "chartType": "auto", "aggregate": "onchange", "isBoolean": null, "symbolSize": 3, "validTime": 35, "fill": 0.3, "min": "-8", "max": "22", "convert": "val / 1000 * -1", "color": "#b82124", "xticks": "4", "commonYAxis": "0", "ignoreNull": "0", "afterComma": "" }, { "name": "Einspeisung", "id": "0_userdata.0.Datenpunkte.Strom.Einspeisung", "instance": "system.adapter.sql.0", "thickness": "1", "chartType": "auto", "aggregate": "onchange", "isBoolean": null, "symbolSize": 3, "validTime": 35, "fill": 0.2, "min": "-8", "max": "22", "convert": "val / 1000", "color": "#10952f", "xticks": "4", "commonYAxis": "0", "ignoreNull": "0" }, { "name": "Klima Buero OG Betrieb", "id": "0_userdata.0.Datenpunkte.Temperatur-Steuerung.Klima_Buero_OG_Betrieb", "instance": "system.adapter.sql.0", "thickness": "1", "chartType": "line", "aggregate": "minmax", "isBoolean": null, "symbolSize": 3, "validTime": "", "fill": 1, "min": "0", "max": "10", "convert": "val * 0.25", "color": "#008b47", "xticks": "4", "commonYAxis": "", "ignoreNull": "false", "yOffset": "0", "percentile": 50, "integralUnit": 60, "integralInterpolation": "none" }, { "name": "Klima Buero Betrieb", "id": "0_userdata.0.Datenpunkte.Temperatur-Steuerung.Klima_Buero_Betrieb", "instance": "system.adapter.sql.0", "thickness": "1", "chartType": "line", "aggregate": "minmax", "isBoolean": null, "symbolSize": 3, "validTime": "", "fill": 1, "min": "0", "max": "10", "convert": "(val * 0.125)", "color": "#007583", "xticks": "4", "commonYAxis": "", "ignoreNull": "false", "yOffset": "0" } ], "marks": [ { "color": "#5c1011", "lineId": "0", "upperValueOrId": "-2", "lowerValueOrId": "", "fill": 0, "lineStyle": "dotted", "text": "2 KW ", "textSize": "10", "textColor": "#9b2e2f" }, { "color": "#5c1011", "lineId": "0", "upperValueOrId": "-4", "lowerValueOrId": "", "fill": 0, "lineStyle": "dotted", "text": "4 KW ", "textSize": "10", "textColor": "#9b2e2f" }, { "color": "#5c1011", "lineId": "0", "upperValueOrId": "-6", "lowerValueOrId": "", "fill": 0, "lineStyle": "dotted", "text": "6 KW ", "textSize": "10", "textColor": "#9b2e2f" }, { "color": "#1d6923", "lineId": "0", "upperValueOrId": "2", "lowerValueOrId": "", "fill": 0, "lineStyle": "dotted", "text": "2 KW ", "textSize": "10", "textColor": "#1d6923" }, { "color": "#1d6923", "lineId": "0", "upperValueOrId": "4", "lowerValueOrId": "", "fill": 0, "lineStyle": "dotted", "text": "4 KW ", "textSize": "10", "textColor": "#1d6923" }, { "color": "#1d6923", "lineId": "0", "upperValueOrId": "6", "lowerValueOrId": "", "fill": 0, "lineStyle": "dotted", "text": "6 KW ", "textSize": "10", "textColor": "#1d6923" }, { "color": "#1d6923", "lineId": "0", "upperValueOrId": "8", "lowerValueOrId": "", "fill": 0, "lineStyle": "dotted", "text": "8 KW ", "textSize": "10", "textColor": "#1d6923" }, { "color": "#1d6923", "lineId": "0", "upperValueOrId": "10", "lowerValueOrId": "", "fill": 0, "lineStyle": "dotted", "text": "10 KW ", "textSize": "10", "textColor": "#1d6923" }, { "color": "#1d6923", "lineId": "0", "upperValueOrId": "12", "lowerValueOrId": "", "fill": 0, "lineStyle": "dotted", "text": "12 KW ", "textSize": "10", "textColor": "#1d6923" }, { "color": "#1d6923", "lineId": "0", "upperValueOrId": "14", "lowerValueOrId": "", "fill": 0, "lineStyle": "dotted", "text": "14 KW ", "textSize": "10", "textColor": "#1d6923" }, { "color": "#1d6923", "lineId": "0", "upperValueOrId": "16", "lowerValueOrId": "", "fill": 0, "lineStyle": "dotted", "text": "16 KW ", "textSize": "10", "textColor": "#1d6923" }, { "color": "#1d6923", "lineId": "0", "upperValueOrId": "18", "lowerValueOrId": "", "fill": 0, "lineStyle": "dotted", "text": "18 KW ", "textSize": "10", "textColor": "#1d6923" }, { "color": "#5c1011", "lineId": "0", "upperValueOrId": "-8", "lowerValueOrId": "", "fill": 0, "lineStyle": "dotted", "text": "8 KW ", "textSize": "10", "textColor": "#9b2e2f" }, { "color": "#5c1011", "lineId": "0", "upperValueOrId": "-10", "lowerValueOrId": "", "fill": 0, "lineStyle": "dotted", "text": "10 KW ", "textSize": "10", "textColor": "#9b2e2f" }, { "color": "#5c1011", "lineId": "0", "upperValueOrId": "-12", "lowerValueOrId": "", "fill": 0, "lineStyle": "dotted", "text": "12 KW ", "textSize": "10", "textColor": "#9b2e2f" }, { "color": "#5c1011", "lineId": "0", "upperValueOrId": "-14", "lowerValueOrId": "", "fill": 0, "lineStyle": "dotted", "text": "14 KW ", "textSize": "10", "textColor": "#9b2e2f" }, { "color": "#1d6923", "lineId": "0", "upperValueOrId": "20", "lowerValueOrId": "", "fill": 0, "lineStyle": "dotted", "text": "20 KW ", "textSize": "10", "textColor": "#1d6923" } ], "timeType": "relative", "relativeEnd": "now", "range": "1440", "aggregateType": "step", "aggregateSpan": "1", "legend": "", "hoverDetail": true, "zoom": true, "animation": 0, "live": "300", "ticks": "", "width": "", "height": "", "noBorder": "", "window_bg": "#000000", "bg_custom": "", "x_labels_color": "", "y_labels_color": "", "border_color": "#343434", "grid_color": "", "grid_hideX": true, "grid_hideY": true, "border_width": "5", "barColor": "", "barLabels": "topover", "barWidth": "", "barFontSize": "", "barFontColor": "", "title": "", "titlePos": "", "titleColor": "", "titleSize": "", "legColumns": "", "legBgOpacity": "", "legBg": "", "timeFormat": "", "export": false, "legendDirection": "", "useComma": false, "noBackground": true, "legActual": false, "legFontSize": "", "legendHeight": "", "resetZoom": "600", "autoGridPadding": false, "theme": "default", "hoverNoInterpolate": false, "hoverNoNulls": false, "timeFormatCustom": false, "border_style": "ridge", "border_padding": "5" } }, "type": "chart", "_id": "echarts.0.D_Energie_copy", "acl": { "object": 1636, "owner": "system.user.admin", "ownerGroup": "system.group.administrator" }, "from": "system.adapter.admin.0", "user": "system.user.admin", "ts": 1755630349601 } -
@mabbi ok
- Jetzt erstmal unter
0_userdatadas Verzeichnis0_userdata.0.echartslöschen. - dann Verzeichnis für
echartDPim Programm wieder auf Standard zurücksetzen und Programm speichern -> DPs werden wieder angelegt
let echartDP = '0_userdata.0.echarts';- Im Verzeichnis
0_userdata.0.echartsgibt es nun den DPechartsDP, da kommt nun Deinecharts.0.D_Energie_copyals Wert eingetragen.

- Jetzt erstmal unter
-
@mcu Cool, jetzt gehts.
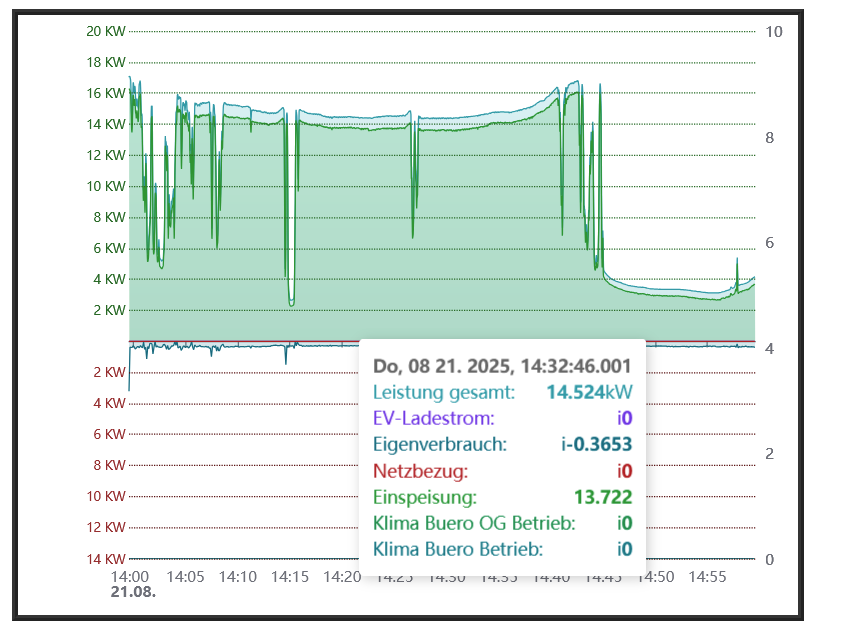
Mein Fehler war die Änderung des javascripts, dadurch wurden die 0_userdata.0.echarts mehrfach angelegt.
Hatte mich schon gewundert, warum die 2x vorhanden waren.Vielen Dank für Deine Hilfe.
-
Salü
Ich habe versucht mit folgenden Skript zu arbeiten:
Widgets aus- / einblenden
Scripts "widgetsDisplay.js" kopieren und in Scripts (jarvis) einfügen.was eigentlich auch funktioniert hat.
Meine Idee ist mittels Selektion (klick auf Objekt im Eflussadapter) links unten dann das entsprechende Widget einzublenden (und die anderen auszublenden).
Dies kriege ich auch hin, allerdings würde ich die alle gerne am "gleichen" Ort haben und nicht ein Lücke haben dort wo das ausgeblendete ist: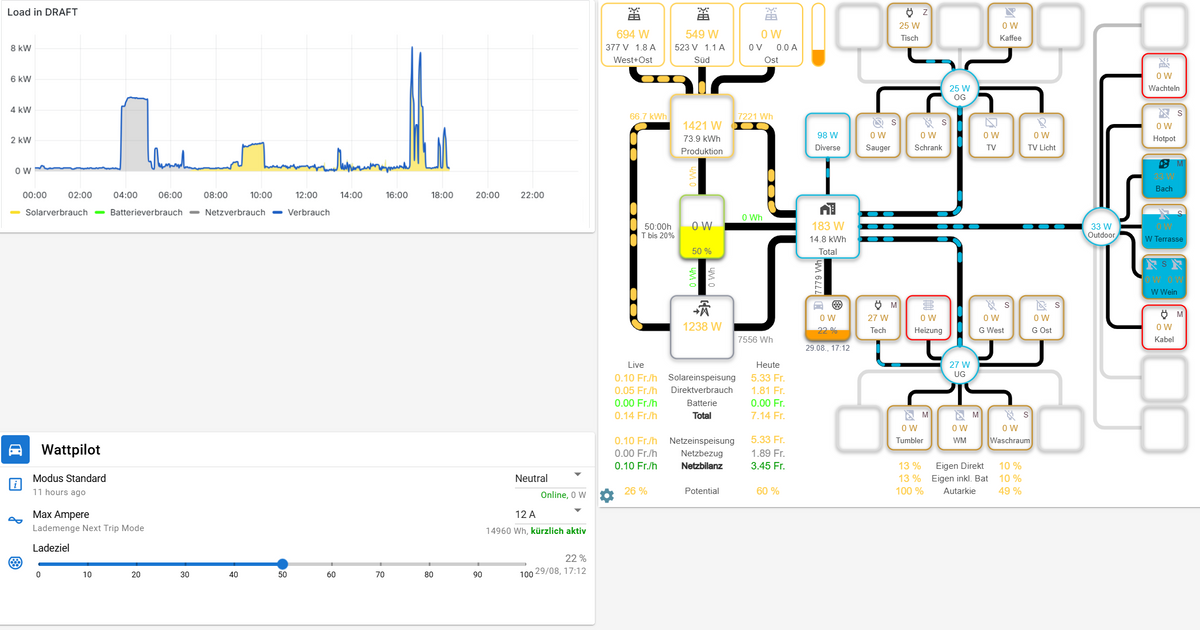
Ist das irgendwie möglich?
Alternativ-Elegant wäre natürlich auch, wenn man bei "Assign Widget to Box" die ID "relativ" setzen könnte z.B zu einem eigenen DP, dann bleibt die Position natürlich
 .
.Grüsse
Jarvis V3.1.8
-
@mickemup
Bin noch dabei
https://mcuiobroker.gitbook.io/jarvis-infos/jarvis-v3/besonderheiten-v3/scripts-3.2.x-pro/widgets/widgetshidingDie "Alternative" schau ich mir auch mal an.
-
@mcu
Super Danke.Für meinen Fall wäre die Alternative wohl fast einfacher (für mich) dann muss ich nur einen Werte ändern.
Ansonsten muss ich immer eins: einschalten und das alte ausschalten.Analog mache ich dies bei mir schon mit StateHTML, wo der jeweilige "Grafana-Iframe" in einem DP steht, welcher dann angepasst wird.
-
@mickemup In Deinem Fall müsste man die Ordernumber von diesem Widget ändern, richtig?.

-
Genau: das Widget oberhalb ist ausgeblendet und das von dir gezeigte sollte eigentlich dann dort sein.
Ich hätte wohl am Ende so um die 10 Widgets, aber will nur immer 1 zeigen am selben Ort.
-
@mickemup Sind diese 10 alle eCharts als iFrame?
-
@mcu
Also oben links habe ich es so StateHTML gelöst.
Diese verweisen auf einen Datenpunkt und dort drin passe ich bei einem Klick z.B auf die Produktionsleistung den DP vom StateHTML an:<iframe src="http://192.168.1.203:3000/d-solo/b3395744-04be-4f4d-83ca-358dd5afe53b/energie-live?orgId=1&refresh=30s&theme=light&panelId=27&__feature.dashboardSceneSolo=false" width="100%" height="325" frameborder="0"></iframe>Wenn ich analog die ID in "Assign Widget to Box" Widget ID anpassen könnte, wäre es für mich ideal:
Unten links sind alles "State Lists" die ich gerne anzeigen würde: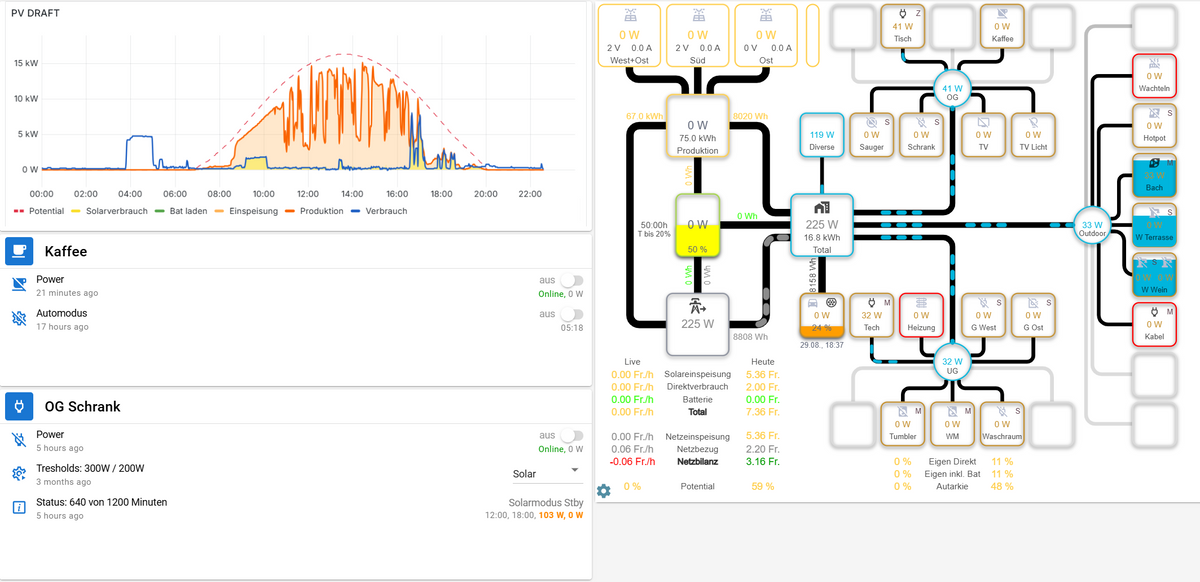
Also Anstatt die beiden (oder eben am Ende ca. 10) soll dort nur ein Widget (State List) dargestellt werden.
-
@mickemup Grafana?
-
@mcu Oben links kann ich meine Grafana-Plots durchswitchen ja.
Unten Links würde ich das gleiche gerne mit "StateLists" machen.
Ober eben halt nur die ausgewählte/rechts angeklickte anzeigen.
