

HowTo: Zusatz-Programme fuer jarvis v3
-
@mcu: Ich bin mir nicht ganz sicher, was gemeint ist .... ?

{ "common": { "read": true, "write": true, "name": "eCharts-DP", "type": "string", "role": "state", "def": "" }, "native": {}, "type": "state", "from": "system.adapter.javascript.0", "user": "system.user.admin", "ts": 1755774987903, "_id": "0_userdata.0.echarts.echartsDP", "acl": { "object": 1636, "state": 1636, "owner": "system.user.admin", "ownerGroup": "system.group.administrator" } } -
@mcu: Ich bin mir nicht ganz sicher, was gemeint ist .... ?
{ "common": { "read": true, "write": true, "name": "eCharts-DP", "type": "string", "role": "state", "def": "" }, "native": {}, "type": "state", "from": "system.adapter.javascript.0", "user": "system.user.admin", "ts": 1755774987903, "_id": "0_userdata.0.echarts.echartsDP", "acl": { "object": 1636, "state": 1636, "owner": "system.user.admin", "ownerGroup": "system.group.administrator" } } -
{ "common": { "name": "D_Energie copy" }, "native": { "url": "", "data": { "lines": [ { "name": "Leistung gesamt", "id": "0_userdata.0.Datenpunkte.PV.Leistung_gesamt", "instance": "system.adapter.sql.0", "thickness": "1", "chartType": "auto", "aggregate": "max", "isBoolean": null, "symbolSize": 3, "validTime": "", "unit": " kW", "color": "#1a98a6", "fill": 0.2, "shadowsize": "", "min": "-14", "max": "20", "ignoreNull": "0", "noFuture": false, "percentile": 50, "integralUnit": 60, "integralInterpolation": "none", "yticks": "-1", "xaxe": "", "xticks": "6", "yOffset": "0", "points": false, "hide": false, "yaxe": "left", "convert": "val / 1000", "afterComma": "3" }, { "name": "EV-Ladestrom", "id": "0_userdata.0.Datenpunkte.EV_Wallbox.EV-Ladestrom", "instance": "system.adapter.history.0", "thickness": "1", "chartType": "auto", "aggregate": "max", "isBoolean": null, "symbolSize": 3, "validTime": "", "fill": 0.2, "min": "-8", "max": "22", "convert": "val / 1000 * -1", "color": "#702ce6", "xticks": "4", "commonYAxis": "0", "ignoreNull": "0" }, { "name": "Eigenverbrauch", "id": "0_userdata.0.Datenpunkte.Strom.Eigenverbrauch", "instance": "system.adapter.sql.0", "thickness": "1", "chartType": "auto", "aggregate": "onchange", "isBoolean": null, "symbolSize": 3, "validTime": 35, "fill": 0.2, "min": "-8", "max": "22", "convert": "val / 1000 * -1", "color": "#00687d", "xticks": "4", "commonYAxis": "0", "ignoreNull": "0" }, { "name": "Netzbezug", "id": "0_userdata.0.Datenpunkte.Strom.Netzbezug", "instance": "system.adapter.sql.0", "thickness": "1", "chartType": "auto", "aggregate": "onchange", "isBoolean": null, "symbolSize": 3, "validTime": 35, "fill": 0.3, "min": "-8", "max": "22", "convert": "val / 1000 * -1", "color": "#b82124", "xticks": "4", "commonYAxis": "0", "ignoreNull": "0", "afterComma": "" }, { "name": "Einspeisung", "id": "0_userdata.0.Datenpunkte.Strom.Einspeisung", "instance": "system.adapter.sql.0", "thickness": "1", "chartType": "auto", "aggregate": "onchange", "isBoolean": null, "symbolSize": 3, "validTime": 35, "fill": 0.2, "min": "-8", "max": "22", "convert": "val / 1000", "color": "#10952f", "xticks": "4", "commonYAxis": "0", "ignoreNull": "0" }, { "name": "Klima Buero OG Betrieb", "id": "0_userdata.0.Datenpunkte.Temperatur-Steuerung.Klima_Buero_OG_Betrieb", "instance": "system.adapter.sql.0", "thickness": "1", "chartType": "line", "aggregate": "minmax", "isBoolean": null, "symbolSize": 3, "validTime": "", "fill": 1, "min": "0", "max": "10", "convert": "val * 0.25", "color": "#008b47", "xticks": "4", "commonYAxis": "", "ignoreNull": "false", "yOffset": "0", "percentile": 50, "integralUnit": 60, "integralInterpolation": "none" }, { "name": "Klima Buero Betrieb", "id": "0_userdata.0.Datenpunkte.Temperatur-Steuerung.Klima_Buero_Betrieb", "instance": "system.adapter.sql.0", "thickness": "1", "chartType": "line", "aggregate": "minmax", "isBoolean": null, "symbolSize": 3, "validTime": "", "fill": 1, "min": "0", "max": "10", "convert": "(val * 0.125)", "color": "#007583", "xticks": "4", "commonYAxis": "", "ignoreNull": "false", "yOffset": "0" } ], "marks": [ { "color": "#5c1011", "lineId": "0", "upperValueOrId": "-2", "lowerValueOrId": "", "fill": 0, "lineStyle": "dotted", "text": "2 KW ", "textSize": "10", "textColor": "#9b2e2f" }, { "color": "#5c1011", "lineId": "0", "upperValueOrId": "-4", "lowerValueOrId": "", "fill": 0, "lineStyle": "dotted", "text": "4 KW ", "textSize": "10", "textColor": "#9b2e2f" }, { "color": "#5c1011", "lineId": "0", "upperValueOrId": "-6", "lowerValueOrId": "", "fill": 0, "lineStyle": "dotted", "text": "6 KW ", "textSize": "10", "textColor": "#9b2e2f" }, { "color": "#1d6923", "lineId": "0", "upperValueOrId": "2", "lowerValueOrId": "", "fill": 0, "lineStyle": "dotted", "text": "2 KW ", "textSize": "10", "textColor": "#1d6923" }, { "color": "#1d6923", "lineId": "0", "upperValueOrId": "4", "lowerValueOrId": "", "fill": 0, "lineStyle": "dotted", "text": "4 KW ", "textSize": "10", "textColor": "#1d6923" }, { "color": "#1d6923", "lineId": "0", "upperValueOrId": "6", "lowerValueOrId": "", "fill": 0, "lineStyle": "dotted", "text": "6 KW ", "textSize": "10", "textColor": "#1d6923" }, { "color": "#1d6923", "lineId": "0", "upperValueOrId": "8", "lowerValueOrId": "", "fill": 0, "lineStyle": "dotted", "text": "8 KW ", "textSize": "10", "textColor": "#1d6923" }, { "color": "#1d6923", "lineId": "0", "upperValueOrId": "10", "lowerValueOrId": "", "fill": 0, "lineStyle": "dotted", "text": "10 KW ", "textSize": "10", "textColor": "#1d6923" }, { "color": "#1d6923", "lineId": "0", "upperValueOrId": "12", "lowerValueOrId": "", "fill": 0, "lineStyle": "dotted", "text": "12 KW ", "textSize": "10", "textColor": "#1d6923" }, { "color": "#1d6923", "lineId": "0", "upperValueOrId": "14", "lowerValueOrId": "", "fill": 0, "lineStyle": "dotted", "text": "14 KW ", "textSize": "10", "textColor": "#1d6923" }, { "color": "#1d6923", "lineId": "0", "upperValueOrId": "16", "lowerValueOrId": "", "fill": 0, "lineStyle": "dotted", "text": "16 KW ", "textSize": "10", "textColor": "#1d6923" }, { "color": "#1d6923", "lineId": "0", "upperValueOrId": "18", "lowerValueOrId": "", "fill": 0, "lineStyle": "dotted", "text": "18 KW ", "textSize": "10", "textColor": "#1d6923" }, { "color": "#5c1011", "lineId": "0", "upperValueOrId": "-8", "lowerValueOrId": "", "fill": 0, "lineStyle": "dotted", "text": "8 KW ", "textSize": "10", "textColor": "#9b2e2f" }, { "color": "#5c1011", "lineId": "0", "upperValueOrId": "-10", "lowerValueOrId": "", "fill": 0, "lineStyle": "dotted", "text": "10 KW ", "textSize": "10", "textColor": "#9b2e2f" }, { "color": "#5c1011", "lineId": "0", "upperValueOrId": "-12", "lowerValueOrId": "", "fill": 0, "lineStyle": "dotted", "text": "12 KW ", "textSize": "10", "textColor": "#9b2e2f" }, { "color": "#5c1011", "lineId": "0", "upperValueOrId": "-14", "lowerValueOrId": "", "fill": 0, "lineStyle": "dotted", "text": "14 KW ", "textSize": "10", "textColor": "#9b2e2f" }, { "color": "#1d6923", "lineId": "0", "upperValueOrId": "20", "lowerValueOrId": "", "fill": 0, "lineStyle": "dotted", "text": "20 KW ", "textSize": "10", "textColor": "#1d6923" } ], "timeType": "relative", "relativeEnd": "now", "range": "1440", "aggregateType": "step", "aggregateSpan": "1", "legend": "", "hoverDetail": true, "zoom": true, "animation": 0, "live": "300", "ticks": "", "width": "", "height": "", "noBorder": "", "window_bg": "#000000", "bg_custom": "", "x_labels_color": "", "y_labels_color": "", "border_color": "#343434", "grid_color": "", "grid_hideX": true, "grid_hideY": true, "border_width": "5", "barColor": "", "barLabels": "topover", "barWidth": "", "barFontSize": "", "barFontColor": "", "title": "", "titlePos": "", "titleColor": "", "titleSize": "", "legColumns": "", "legBgOpacity": "", "legBg": "", "timeFormat": "", "export": false, "legendDirection": "", "useComma": false, "noBackground": true, "legActual": false, "legFontSize": "", "legendHeight": "", "resetZoom": "600", "autoGridPadding": false, "theme": "default", "hoverNoInterpolate": false, "hoverNoNulls": false, "timeFormatCustom": false, "border_style": "ridge", "border_padding": "5" } }, "type": "chart", "_id": "echarts.0.D_Energie_copy", "acl": { "object": 1636, "owner": "system.user.admin", "ownerGroup": "system.group.administrator" }, "from": "system.adapter.admin.0", "user": "system.user.admin", "ts": 1755630349601 } -
{ "common": { "name": "D_Energie copy" }, "native": { "url": "", "data": { "lines": [ { "name": "Leistung gesamt", "id": "0_userdata.0.Datenpunkte.PV.Leistung_gesamt", "instance": "system.adapter.sql.0", "thickness": "1", "chartType": "auto", "aggregate": "max", "isBoolean": null, "symbolSize": 3, "validTime": "", "unit": " kW", "color": "#1a98a6", "fill": 0.2, "shadowsize": "", "min": "-14", "max": "20", "ignoreNull": "0", "noFuture": false, "percentile": 50, "integralUnit": 60, "integralInterpolation": "none", "yticks": "-1", "xaxe": "", "xticks": "6", "yOffset": "0", "points": false, "hide": false, "yaxe": "left", "convert": "val / 1000", "afterComma": "3" }, { "name": "EV-Ladestrom", "id": "0_userdata.0.Datenpunkte.EV_Wallbox.EV-Ladestrom", "instance": "system.adapter.history.0", "thickness": "1", "chartType": "auto", "aggregate": "max", "isBoolean": null, "symbolSize": 3, "validTime": "", "fill": 0.2, "min": "-8", "max": "22", "convert": "val / 1000 * -1", "color": "#702ce6", "xticks": "4", "commonYAxis": "0", "ignoreNull": "0" }, { "name": "Eigenverbrauch", "id": "0_userdata.0.Datenpunkte.Strom.Eigenverbrauch", "instance": "system.adapter.sql.0", "thickness": "1", "chartType": "auto", "aggregate": "onchange", "isBoolean": null, "symbolSize": 3, "validTime": 35, "fill": 0.2, "min": "-8", "max": "22", "convert": "val / 1000 * -1", "color": "#00687d", "xticks": "4", "commonYAxis": "0", "ignoreNull": "0" }, { "name": "Netzbezug", "id": "0_userdata.0.Datenpunkte.Strom.Netzbezug", "instance": "system.adapter.sql.0", "thickness": "1", "chartType": "auto", "aggregate": "onchange", "isBoolean": null, "symbolSize": 3, "validTime": 35, "fill": 0.3, "min": "-8", "max": "22", "convert": "val / 1000 * -1", "color": "#b82124", "xticks": "4", "commonYAxis": "0", "ignoreNull": "0", "afterComma": "" }, { "name": "Einspeisung", "id": "0_userdata.0.Datenpunkte.Strom.Einspeisung", "instance": "system.adapter.sql.0", "thickness": "1", "chartType": "auto", "aggregate": "onchange", "isBoolean": null, "symbolSize": 3, "validTime": 35, "fill": 0.2, "min": "-8", "max": "22", "convert": "val / 1000", "color": "#10952f", "xticks": "4", "commonYAxis": "0", "ignoreNull": "0" }, { "name": "Klima Buero OG Betrieb", "id": "0_userdata.0.Datenpunkte.Temperatur-Steuerung.Klima_Buero_OG_Betrieb", "instance": "system.adapter.sql.0", "thickness": "1", "chartType": "line", "aggregate": "minmax", "isBoolean": null, "symbolSize": 3, "validTime": "", "fill": 1, "min": "0", "max": "10", "convert": "val * 0.25", "color": "#008b47", "xticks": "4", "commonYAxis": "", "ignoreNull": "false", "yOffset": "0", "percentile": 50, "integralUnit": 60, "integralInterpolation": "none" }, { "name": "Klima Buero Betrieb", "id": "0_userdata.0.Datenpunkte.Temperatur-Steuerung.Klima_Buero_Betrieb", "instance": "system.adapter.sql.0", "thickness": "1", "chartType": "line", "aggregate": "minmax", "isBoolean": null, "symbolSize": 3, "validTime": "", "fill": 1, "min": "0", "max": "10", "convert": "(val * 0.125)", "color": "#007583", "xticks": "4", "commonYAxis": "", "ignoreNull": "false", "yOffset": "0" } ], "marks": [ { "color": "#5c1011", "lineId": "0", "upperValueOrId": "-2", "lowerValueOrId": "", "fill": 0, "lineStyle": "dotted", "text": "2 KW ", "textSize": "10", "textColor": "#9b2e2f" }, { "color": "#5c1011", "lineId": "0", "upperValueOrId": "-4", "lowerValueOrId": "", "fill": 0, "lineStyle": "dotted", "text": "4 KW ", "textSize": "10", "textColor": "#9b2e2f" }, { "color": "#5c1011", "lineId": "0", "upperValueOrId": "-6", "lowerValueOrId": "", "fill": 0, "lineStyle": "dotted", "text": "6 KW ", "textSize": "10", "textColor": "#9b2e2f" }, { "color": "#1d6923", "lineId": "0", "upperValueOrId": "2", "lowerValueOrId": "", "fill": 0, "lineStyle": "dotted", "text": "2 KW ", "textSize": "10", "textColor": "#1d6923" }, { "color": "#1d6923", "lineId": "0", "upperValueOrId": "4", "lowerValueOrId": "", "fill": 0, "lineStyle": "dotted", "text": "4 KW ", "textSize": "10", "textColor": "#1d6923" }, { "color": "#1d6923", "lineId": "0", "upperValueOrId": "6", "lowerValueOrId": "", "fill": 0, "lineStyle": "dotted", "text": "6 KW ", "textSize": "10", "textColor": "#1d6923" }, { "color": "#1d6923", "lineId": "0", "upperValueOrId": "8", "lowerValueOrId": "", "fill": 0, "lineStyle": "dotted", "text": "8 KW ", "textSize": "10", "textColor": "#1d6923" }, { "color": "#1d6923", "lineId": "0", "upperValueOrId": "10", "lowerValueOrId": "", "fill": 0, "lineStyle": "dotted", "text": "10 KW ", "textSize": "10", "textColor": "#1d6923" }, { "color": "#1d6923", "lineId": "0", "upperValueOrId": "12", "lowerValueOrId": "", "fill": 0, "lineStyle": "dotted", "text": "12 KW ", "textSize": "10", "textColor": "#1d6923" }, { "color": "#1d6923", "lineId": "0", "upperValueOrId": "14", "lowerValueOrId": "", "fill": 0, "lineStyle": "dotted", "text": "14 KW ", "textSize": "10", "textColor": "#1d6923" }, { "color": "#1d6923", "lineId": "0", "upperValueOrId": "16", "lowerValueOrId": "", "fill": 0, "lineStyle": "dotted", "text": "16 KW ", "textSize": "10", "textColor": "#1d6923" }, { "color": "#1d6923", "lineId": "0", "upperValueOrId": "18", "lowerValueOrId": "", "fill": 0, "lineStyle": "dotted", "text": "18 KW ", "textSize": "10", "textColor": "#1d6923" }, { "color": "#5c1011", "lineId": "0", "upperValueOrId": "-8", "lowerValueOrId": "", "fill": 0, "lineStyle": "dotted", "text": "8 KW ", "textSize": "10", "textColor": "#9b2e2f" }, { "color": "#5c1011", "lineId": "0", "upperValueOrId": "-10", "lowerValueOrId": "", "fill": 0, "lineStyle": "dotted", "text": "10 KW ", "textSize": "10", "textColor": "#9b2e2f" }, { "color": "#5c1011", "lineId": "0", "upperValueOrId": "-12", "lowerValueOrId": "", "fill": 0, "lineStyle": "dotted", "text": "12 KW ", "textSize": "10", "textColor": "#9b2e2f" }, { "color": "#5c1011", "lineId": "0", "upperValueOrId": "-14", "lowerValueOrId": "", "fill": 0, "lineStyle": "dotted", "text": "14 KW ", "textSize": "10", "textColor": "#9b2e2f" }, { "color": "#1d6923", "lineId": "0", "upperValueOrId": "20", "lowerValueOrId": "", "fill": 0, "lineStyle": "dotted", "text": "20 KW ", "textSize": "10", "textColor": "#1d6923" } ], "timeType": "relative", "relativeEnd": "now", "range": "1440", "aggregateType": "step", "aggregateSpan": "1", "legend": "", "hoverDetail": true, "zoom": true, "animation": 0, "live": "300", "ticks": "", "width": "", "height": "", "noBorder": "", "window_bg": "#000000", "bg_custom": "", "x_labels_color": "", "y_labels_color": "", "border_color": "#343434", "grid_color": "", "grid_hideX": true, "grid_hideY": true, "border_width": "5", "barColor": "", "barLabels": "topover", "barWidth": "", "barFontSize": "", "barFontColor": "", "title": "", "titlePos": "", "titleColor": "", "titleSize": "", "legColumns": "", "legBgOpacity": "", "legBg": "", "timeFormat": "", "export": false, "legendDirection": "", "useComma": false, "noBackground": true, "legActual": false, "legFontSize": "", "legendHeight": "", "resetZoom": "600", "autoGridPadding": false, "theme": "default", "hoverNoInterpolate": false, "hoverNoNulls": false, "timeFormatCustom": false, "border_style": "ridge", "border_padding": "5" } }, "type": "chart", "_id": "echarts.0.D_Energie_copy", "acl": { "object": 1636, "owner": "system.user.admin", "ownerGroup": "system.group.administrator" }, "from": "system.adapter.admin.0", "user": "system.user.admin", "ts": 1755630349601 }@mabbi ok
- Jetzt erstmal unter
0_userdatadas Verzeichnis0_userdata.0.echartslöschen. - dann Verzeichnis für
echartDPim Programm wieder auf Standard zurücksetzen und Programm speichern -> DPs werden wieder angelegt
let echartDP = '0_userdata.0.echarts';- Im Verzeichnis
0_userdata.0.echartsgibt es nun den DPechartsDP, da kommt nun Deinecharts.0.D_Energie_copyals Wert eingetragen.

NUC i7 64GB mit Proxmox ---- Jarvis Infos Aktualisierungen der Doku auf Instagram verfolgen -> mcuiobroker Instagram
Wenn Euch mein Vorschlag geholfen hat, bitte rechts "^" klicken. - Jetzt erstmal unter
-
@mabbi ok
- Jetzt erstmal unter
0_userdatadas Verzeichnis0_userdata.0.echartslöschen. - dann Verzeichnis für
echartDPim Programm wieder auf Standard zurücksetzen und Programm speichern -> DPs werden wieder angelegt
let echartDP = '0_userdata.0.echarts';- Im Verzeichnis
0_userdata.0.echartsgibt es nun den DPechartsDP, da kommt nun Deinecharts.0.D_Energie_copyals Wert eingetragen.
- Jetzt erstmal unter
-
@mabbi ok
- Jetzt erstmal unter
0_userdatadas Verzeichnis0_userdata.0.echartslöschen. - dann Verzeichnis für
echartDPim Programm wieder auf Standard zurücksetzen und Programm speichern -> DPs werden wieder angelegt
let echartDP = '0_userdata.0.echarts';- Im Verzeichnis
0_userdata.0.echartsgibt es nun den DPechartsDP, da kommt nun Deinecharts.0.D_Energie_copyals Wert eingetragen.
Salü
Ich habe versucht mit folgenden Skript zu arbeiten:
Widgets aus- / einblenden
Scripts "widgetsDisplay.js" kopieren und in Scripts (jarvis) einfügen.was eigentlich auch funktioniert hat.
Meine Idee ist mittels Selektion (klick auf Objekt im Eflussadapter) links unten dann das entsprechende Widget einzublenden (und die anderen auszublenden).
Dies kriege ich auch hin, allerdings würde ich die alle gerne am "gleichen" Ort haben und nicht ein Lücke haben dort wo das ausgeblendete ist: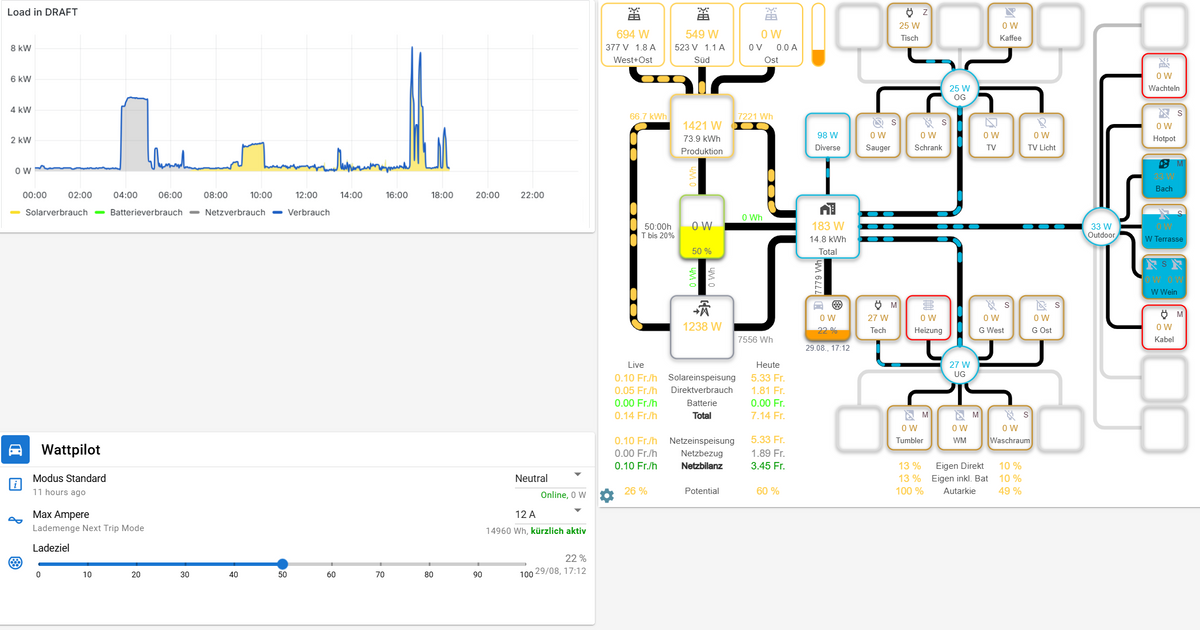
Ist das irgendwie möglich?
Alternativ-Elegant wäre natürlich auch, wenn man bei "Assign Widget to Box" die ID "relativ" setzen könnte z.B zu einem eigenen DP, dann bleibt die Position natürlich :-) .
Grüsse
Jarvis V3.1.8
- Jetzt erstmal unter
-
Salü
Ich habe versucht mit folgenden Skript zu arbeiten:
Widgets aus- / einblenden
Scripts "widgetsDisplay.js" kopieren und in Scripts (jarvis) einfügen.was eigentlich auch funktioniert hat.
Meine Idee ist mittels Selektion (klick auf Objekt im Eflussadapter) links unten dann das entsprechende Widget einzublenden (und die anderen auszublenden).
Dies kriege ich auch hin, allerdings würde ich die alle gerne am "gleichen" Ort haben und nicht ein Lücke haben dort wo das ausgeblendete ist:Ist das irgendwie möglich?
Alternativ-Elegant wäre natürlich auch, wenn man bei "Assign Widget to Box" die ID "relativ" setzen könnte z.B zu einem eigenen DP, dann bleibt die Position natürlich :-) .
Grüsse
Jarvis V3.1.8
@mickemup
Bin noch dabei
https://mcuiobroker.gitbook.io/jarvis-infos/jarvis-v3/besonderheiten-v3/scripts-3.2.x-pro/widgets/widgetshidingDie "Alternative" schau ich mir auch mal an.
NUC i7 64GB mit Proxmox ---- Jarvis Infos Aktualisierungen der Doku auf Instagram verfolgen -> mcuiobroker Instagram
Wenn Euch mein Vorschlag geholfen hat, bitte rechts "^" klicken. -
@mickemup
Bin noch dabei
https://mcuiobroker.gitbook.io/jarvis-infos/jarvis-v3/besonderheiten-v3/scripts-3.2.x-pro/widgets/widgetshidingDie "Alternative" schau ich mir auch mal an.
@mcu
Super Danke.Für meinen Fall wäre die Alternative wohl fast einfacher (für mich) dann muss ich nur einen Werte ändern.
Ansonsten muss ich immer eins: einschalten und das alte ausschalten.Analog mache ich dies bei mir schon mit StateHTML, wo der jeweilige "Grafana-Iframe" in einem DP steht, welcher dann angepasst wird.
-
@mcu
Super Danke.Für meinen Fall wäre die Alternative wohl fast einfacher (für mich) dann muss ich nur einen Werte ändern.
Ansonsten muss ich immer eins: einschalten und das alte ausschalten.Analog mache ich dies bei mir schon mit StateHTML, wo der jeweilige "Grafana-Iframe" in einem DP steht, welcher dann angepasst wird.
@mickemup In Deinem Fall müsste man die Ordernumber von diesem Widget ändern, richtig?.
NUC i7 64GB mit Proxmox ---- Jarvis Infos Aktualisierungen der Doku auf Instagram verfolgen -> mcuiobroker Instagram
Wenn Euch mein Vorschlag geholfen hat, bitte rechts "^" klicken. -
Genau: das Widget oberhalb ist ausgeblendet und das von dir gezeigte sollte eigentlich dann dort sein.
Ich hätte wohl am Ende so um die 10 Widgets, aber will nur immer 1 zeigen am selben Ort.
@mickemup Sind diese 10 alle eCharts als iFrame?
NUC i7 64GB mit Proxmox ---- Jarvis Infos Aktualisierungen der Doku auf Instagram verfolgen -> mcuiobroker Instagram
Wenn Euch mein Vorschlag geholfen hat, bitte rechts "^" klicken. -
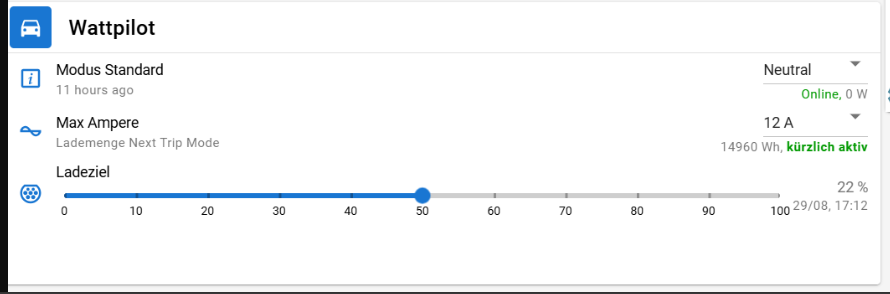
@mcu
Also oben links habe ich es so StateHTML gelöst.
Diese verweisen auf einen Datenpunkt und dort drin passe ich bei einem Klick z.B auf die Produktionsleistung den DP vom StateHTML an:<iframe src="http://192.168.1.203:3000/d-solo/b3395744-04be-4f4d-83ca-358dd5afe53b/energie-live?orgId=1&refresh=30s&theme=light&panelId=27&__feature.dashboardSceneSolo=false" width="100%" height="325" frameborder="0"></iframe>Wenn ich analog die ID in "Assign Widget to Box" Widget ID anpassen könnte, wäre es für mich ideal:
Unten links sind alles "State Lists" die ich gerne anzeigen würde: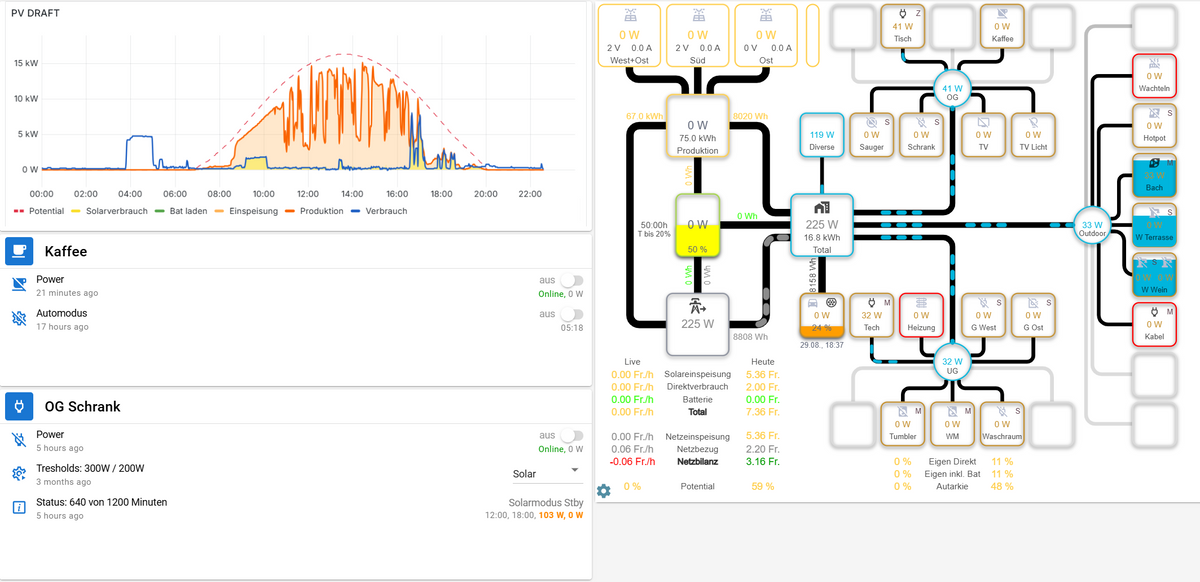
Also Anstatt die beiden (oder eben am Ende ca. 10) soll dort nur ein Widget (State List) dargestellt werden.
-
@mcu
Also oben links habe ich es so StateHTML gelöst.
Diese verweisen auf einen Datenpunkt und dort drin passe ich bei einem Klick z.B auf die Produktionsleistung den DP vom StateHTML an:<iframe src="http://192.168.1.203:3000/d-solo/b3395744-04be-4f4d-83ca-358dd5afe53b/energie-live?orgId=1&refresh=30s&theme=light&panelId=27&__feature.dashboardSceneSolo=false" width="100%" height="325" frameborder="0"></iframe>Wenn ich analog die ID in "Assign Widget to Box" Widget ID anpassen könnte, wäre es für mich ideal:
Unten links sind alles "State Lists" die ich gerne anzeigen würde:Also Anstatt die beiden (oder eben am Ende ca. 10) soll dort nur ein Widget (State List) dargestellt werden.
@mickemup Grafana?
NUC i7 64GB mit Proxmox ---- Jarvis Infos Aktualisierungen der Doku auf Instagram verfolgen -> mcuiobroker Instagram
Wenn Euch mein Vorschlag geholfen hat, bitte rechts "^" klicken. -
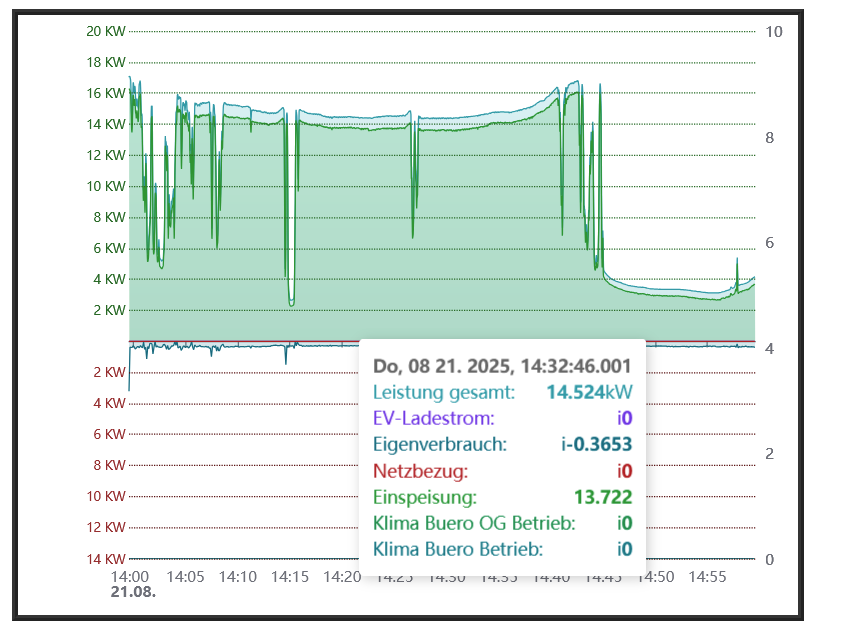
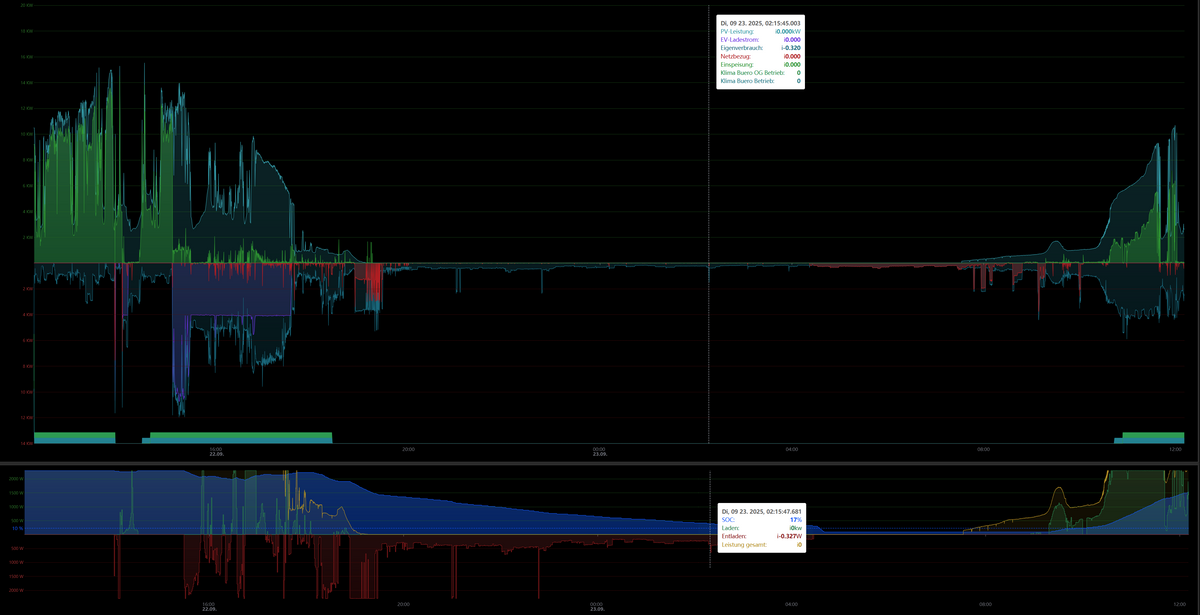
@mcu Oben links kann ich meine Grafana-Plots durchswitchen ja.
Unten Links würde ich das gleiche gerne mit "StateLists" machen.
Ober eben halt nur die ausgewählte/rechts angeklickte anzeigen. -
@mcu
Sry nein das ist unabhängig.Mit Klicks auf die grün markiertern Leistungswerte Toggle ich oben links durch die Grafiken.
Das funktioniert bereits 1A.Mit Klicks auf die orange markierten Kreise (werden evtl. noch mehr) würde ich gerne durch StateLists "togglen" welche dann unten Links stehen sollen.
Ich hoff ,ich konnte mich verständlich ausdrücken.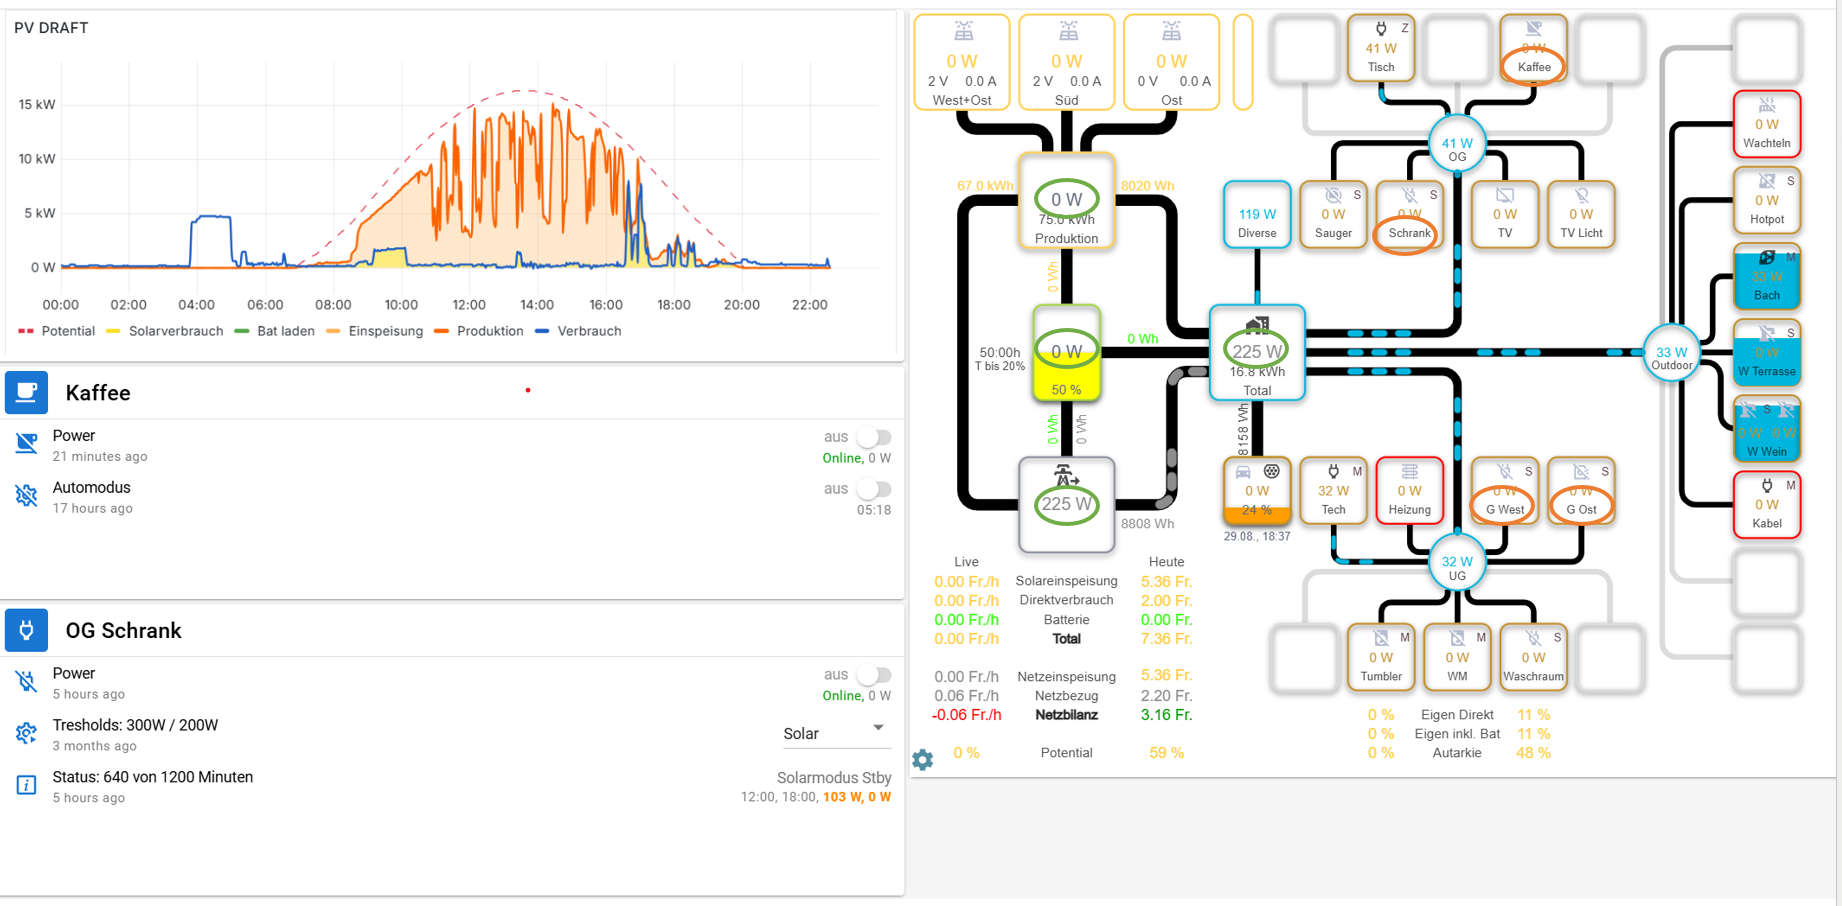
-
@mcu
Sry nein das ist unabhängig.Mit Klicks auf die grün markiertern Leistungswerte Toggle ich oben links durch die Grafiken.
Das funktioniert bereits 1A.Mit Klicks auf die orange markierten Kreise (werden evtl. noch mehr) würde ich gerne durch StateLists "togglen" welche dann unten Links stehen sollen.
Ich hoff ,ich konnte mich verständlich ausdrücken.@mickemup
Order number ändern zieht nur auf dem Handy. Wäre schneller, da man nur die Reihenfolge ändern müsste.
Aber für PC und Tablet muss man alle nachfolgenden bzw. darunter liegenden Widgets neu berechnen, in Abhängigkeit von der Anzeige (einige sind ja ausgeblendet) und den Werten vom aktuellen Widget, welches man an die neue Position setzen will.


Hey! Du scheinst an dieser Unterhaltung interessiert zu sein, hast aber noch kein Konto.
Hast du es satt, bei jedem Besuch durch die gleichen Beiträge zu scrollen? Wenn du dich für ein Konto anmeldest, kommst du immer genau dorthin zurück, wo du zuvor warst, und kannst dich über neue Antworten benachrichtigen lassen (entweder per E-Mail oder Push-Benachrichtigung). Du kannst auch Lesezeichen speichern und Beiträge positiv bewerten, um anderen Community-Mitgliedern deine Wertschätzung zu zeigen.
Mit deinem Input könnte dieser Beitrag noch besser werden 💗
Registrieren AnmeldenSupport us
453
Online33.0k
Benutzer83.4k
Themen1.3m
Beiträge