NEWS


[ Geklärt ] Problem bei Influx Installation
-
@Altersrentner
gib mal folgendes einsystemctl daemon-reload systemctl enable influxdb systemctl start influxdbpi@raspberrypi:~ $ systemctl daemon-reload ==== AUTHENTICATING FOR org.freedesktop.systemd1.reload-daemon === Authentication is required to reload the systemd state. Authenticating as: ,,, (pi) Password: ==== AUTHENTICATION COMPLETE === pi@raspberrypi:~ $ systemctl enable influxdb ==== AUTHENTICATING FOR org.freedesktop.systemd1.manage-unit-files === Authentication is required to manage system service or unit files. Authenticating as: ,,, (pi) Password: ==== AUTHENTICATION COMPLETE === ==== AUTHENTICATING FOR org.freedesktop.systemd1.reload-daemon === Authentication is required to reload the systemd state. Authenticating as: ,,, (pi) Password: ==== AUTHENTICATION COMPLETE === pi@raspberrypi:~ $ systemctl start influxdb ==== AUTHENTICATING FOR org.freedesktop.systemd1.manage-units === Authentication is required to start 'influxdb.service'. Authenticating as: ,,, (pi) Password: ==== AUTHENTICATION COMPLETE === pi@raspberrypi:~ $ -
@crunchip sagte in [ Geklärt ] Problem bei Influx Installation:
ok, dein cifs mount ist fehlerhaft, influx hat er gemacht, grafana fehlerhaft, hast du Grafana laufen? Wenn ja , bräuchtest das ja auch noch
Was kann ich hinsichtlich cifs machen?
Grafana läuft wohl nicht aber die Graphen sind in vis vorhanden und aktualisieren auch
Links ist aber Grafana auf der HDD vorhande?@altersrentner sagte in [ Geklärt ] Problem bei Influx Installation:
Was kann ich hinsichtlich cifs machen?
ich habe keine Ahnung was du alles eingerichtet hast, bzw was du wohin schickst um backup's zu machen. Nutzt du überhaupt cifs oder nur google drive?
grafana läuft, aber du hast wahrscheinlich die Einstellungen für das Grafana Backup nicht richtig gesetzt.(benutzername/passwort/api-key) -
@wendy2702 Ja es ist noch die alte HDD angeschlossen
Nein erhat kein Grafana Backup gemacht.
Habe eben gesehen, das unter
Backitup Grafana der Hostname und der Grafana API Key fehlen
Was sollich dort eintragen bzw wie bekomme ich den Key@altersrentner Hostname sollte der hier sein:
raspberrypiKey... keine Ahnung.
Vielleicht ist es einfacher wenn du über die Grafana GUI gehst und deine Dashboards einfach exportierst.
-
@wendy2702 Ja es ist noch die alte HDD angeschlossen
Nein erhat kein Grafana Backup gemacht.
Habe eben gesehen, das unter
Backitup Grafana der Hostname und der Grafana API Key fehlen
Was sollich dort eintragen bzw wie bekomme ich den Key@altersrentner sagte in [ Geklärt ] Problem bei Influx Installation:
Was sollich dort eintragen bzw wie bekomme ich den Key
Des Weiteren muss in der Grafana-Weboberfläche ein Api-Key erzeugt werden, um Zugriff auf die Dashboards zu bekommen.
Der Api-Key kann unter "Configuration → API Keys" erstellt werden.Edit:
Nochmal zusammengefasst, du hast möchtest umziehen von einer Hdd auf eine SSD. Iobroker hast du dort schon laufen, mittels Backup.
Was du vergessen/nicht beachtet hast, das Grafana und InfluxDB zwei separate Installationen sind, die mit dem Backup des Iobrokers nichts zu tun haben, daher musst du beide entsprechend wieder auf deiner SSD installieren.
wenn du beide Backups(via backitup) von Influx und Grafana hast, kannst du diese auch wieder per backitup zurückspielen, wenn nicht, musst du dir die Daten entsprechend aus deiner HDD holen und wieder in deiner SSD einfügen -
@altersrentner sagte in [ Geklärt ] Problem bei Influx Installation:
Was kann ich hinsichtlich cifs machen?
ich habe keine Ahnung was du alles eingerichtet hast, bzw was du wohin schickst um backup's zu machen. Nutzt du überhaupt cifs oder nur google drive?
grafana läuft, aber du hast wahrscheinlich die Einstellungen für das Grafana Backup nicht richtig gesetzt.(benutzername/passwort/api-key)@crunchip sagte in [ Geklärt ] Problem bei Influx Installation:
oder nur google drive?
Nur Google Drive
Den Key habe ich erstellt.
Nun der Hostname
Wo finde ich den? -
@crunchip sagte in [ Geklärt ] Problem bei Influx Installation:
oder nur google drive?
Nur Google Drive
Den Key habe ich erstellt.
Nun der Hostname
Wo finde ich den?@altersrentner sagte in [ Geklärt ] Problem bei Influx Installation:
Nun der Hostname
gib einfach deine Ip Adresse ein
@altersrentner sagte in [ Geklärt ] Problem bei Influx Installation:
Nur Google Drive
dann hast du NAS/Kopieren scheinbar angehakt, in den Haupteinstellungen, daher der Fehler
-
@crunchip sagte in [ Geklärt ] Problem bei Influx Installation:
oder nur google drive?
Nur Google Drive
Den Key habe ich erstellt.
Nun der Hostname
Wo finde ich den?@altersrentner Hatt ich zwar schon geschrieben kannst aber auch gerne nochmal hier schauen
cat /etc/hosts -
@altersrentner sagte in [ Geklärt ] Problem bei Influx Installation:
Nun der Hostname
gib einfach deine Ip Adresse ein
@altersrentner sagte in [ Geklärt ] Problem bei Influx Installation:
Nur Google Drive
dann hast du NAS/Kopieren scheinbar angehakt, in den Haupteinstellungen, daher der Fehler
@crunchip
Danke!
Jetz mache ich noch ein Backup
mal sehen was dann ist -
@altersrentner Hatt ich zwar schon geschrieben kannst aber auch gerne nochmal hier schauen
cat /etc/hosts@wendy2702 super Danke:blush: :+1:
-
@altersrentner Hatt ich zwar schon geschrieben kannst aber auch gerne nochmal hier schauen
cat /etc/hosts@wendy2702
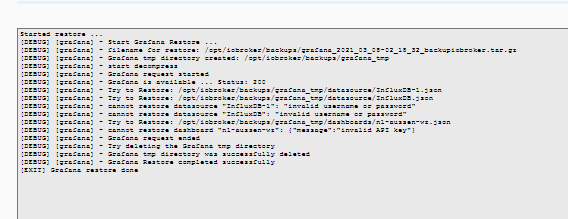
Es erscheint wieder ein Error bei GrafanaDEBUG] [grafana] - Start Grafana Backup ... [DEBUG] [grafana] - Created grafana_tmp directory [DEBUG] [grafana] - Created dashboard directory [DEBUG] [grafana] - Created dashboards_manually_restore directory [DEBUG] [grafana] - Created datasource directory [DEBUG] [grafana] - start Grafana request ... [DEBUG] [grafana] - Grafana is available ... Status: 200 [DEBUG] [grafana] - Error on Grafana Dashoard Request: Error: Request failed with status code 401 [DEBUG] [grafana] - start Grafana backup compress ... [DEBUG] [grafana] - Try deleting the Grafana tmp directory: "/opt/iobroker/backups/grafana_tmp" [DEBUG] [grafana] - Grafana tmp directory "/opt/iobroker/backups/grafana_tmp" successfully deleted [DEBUG] [grafana] - cannot found Grafana Backup files [DEBUG] [grafana] - done [DEBUG] [cifs] - done [DEBUG] [googledrive] - Google Drive: Copy iobroker_2021_03_07-19_08_53_influx grafana_backupiobroker.tar.gz... -
@wendy2702
Es erscheint wieder ein Error bei GrafanaDEBUG] [grafana] - Start Grafana Backup ... [DEBUG] [grafana] - Created grafana_tmp directory [DEBUG] [grafana] - Created dashboard directory [DEBUG] [grafana] - Created dashboards_manually_restore directory [DEBUG] [grafana] - Created datasource directory [DEBUG] [grafana] - start Grafana request ... [DEBUG] [grafana] - Grafana is available ... Status: 200 [DEBUG] [grafana] - Error on Grafana Dashoard Request: Error: Request failed with status code 401 [DEBUG] [grafana] - start Grafana backup compress ... [DEBUG] [grafana] - Try deleting the Grafana tmp directory: "/opt/iobroker/backups/grafana_tmp" [DEBUG] [grafana] - Grafana tmp directory "/opt/iobroker/backups/grafana_tmp" successfully deleted [DEBUG] [grafana] - cannot found Grafana Backup files [DEBUG] [grafana] - done [DEBUG] [cifs] - done [DEBUG] [googledrive] - Google Drive: Copy iobroker_2021_03_07-19_08_53_influx grafana_backupiobroker.tar.gz...@altersrentner sagte in [ Geklärt ] Problem bei Influx Installation:
Error on Grafana Dashoard Request: Error: Request failed with status code 401
Falschen Benutzerdaten oder Api-Key falsch
Grafana ist erreichbar (siehe Status 200) -
@altersrentner sagte in [ Geklärt ] Problem bei Influx Installation:
Error on Grafana Dashoard Request: Error: Request failed with status code 401
Falschen Benutzerdaten oder Api-Key falsch
Grafana ist erreichbar (siehe Status 200)@crunchip
Danke, habe jetzt beim Host die IP eingestellt
und ein neuer Versuch -
@altersrentner sagte in [ Geklärt ] Problem bei Influx Installation:
Error on Grafana Dashoard Request: Error: Request failed with status code 401
Falschen Benutzerdaten oder Api-Key falsch
Grafana ist erreichbar (siehe Status 200)Started iobroker ... [DEBUG] [mount] - first mount attempt with smb option failed. try next mount attempt without smb option ... [ERROR] [mount] - [undefined Error: Command failed: sudo mount -t cifs -o username=Backup,password=****,rw,file_mode=0777,dir_mode=0777 //192.168.178.35/homes/Backup/iobroker/minimalPi4 /opt/iobroker/backups Unable to find suitable address. [ERROR] [mount] - [IGNORED] Error: Command failed: sudo mount -t cifs -o username=Backup,password=****,rw,file_mode=0777,dir_mode=0777 //192.168.178.35/homes/Backup/iobroker/minimalPi4 /opt/iobroker/backups Unable to find suitable address. [DEBUG] [iobroker] - host.raspberrypi 14084 states saved [DEBUG] [iobroker] - host.raspberrypi 16331 objects saved [DEBUG] [iobroker] - Backup created: /opt/iobroker/backups/iobroker_2021_03_07-19_34_18_influx grafana2_backupiobroker.tar.gz [DEBUG] [iobroker] - done [DEBUG] [influxDB] - Start InfluxDB Backup ... [DEBUG] [influxDB] - InfluxDB Backup tmp directory created [DEBUG] [influxDB] - Packed 15MB so far... [DEBUG] [influxDB] - Packed 47MB so far... [DEBUG] [influxDB] - Packed 79MB so far... [DEBUG] [influxDB] - Packed 149MB so far... [DEBUG] [influxDB] - Packed 235MB so far... [DEBUG] [influxDB] - Packed 313MB so far... [DEBUG] [influxDB] - Packed 405MB so far... [DEBUG] [influxDB] - Packed 481MB so far... [DEBUG] [influxDB] - Packed 562MB so far... [DEBUG] [influxDB] - Packed 646MB so far... [DEBUG] [influxDB] - Packed 727MB so far... [DEBUG] [influxDB] - Packed 817MB so far... [DEBUG] [influxDB] - Backup created: /opt/iobroker/backups/influxDB_2021_03_07-19_34_51_influx grafana2_backupiobroker.tar.gz [DEBUG] [influxDB] - Try deleting the InfluxDB tmp directory [DEBUG] [influxDB] - InfluxDB tmp directory was successfully deleted [DEBUG] [influxDB] - done [DEBUG] [grafana] - Start Grafana Backup ... [DEBUG] [grafana] - Created grafana_tmp directory [DEBUG] [grafana] - Created dashboard directory [DEBUG] [grafana] - Created dashboards_manually_restore directory [DEBUG] [grafana] - Created datasource directory [DEBUG] [grafana] - start Grafana request ... [DEBUG] [grafana] - Grafana is available ... Status: 200 [DEBUG] [grafana] - found Dashboard: n1-aussen-wz [DEBUG] [grafana] - start Grafana backup compress ... [DEBUG] [grafana] - Backup created: /opt/iobroker/backups/grafana_2021_03_07-19_42_25_backupiobroker.tar.gz [DEBUG] [grafana] - Try deleting the Grafana tmp directory: "/opt/iobroker/backups/grafana_tmp" [DEBUG] [grafana] - Grafana tmp directory "/opt/iobroker/backups/grafana_tmp" successfully deleted [DEBUG] [grafana] - done [DEBUG] [cifs] - done [DEBUG] [googledrive] - Google Drive: Copy iobroker_2021_03_07-19_34_18_influx grafana2_backupiobroker.tar.gz... [DEBUG] [googledrive] - Google Drive: Copy influxDB_2021_03_07-19_34_51_influx grafana2_backupiobroker.tar.gz...Ich glaube jetzt hat es geklappt:+1: oder:-1:
-
Started iobroker ...
[DEBUG] [mount] - first mount attempt with smb option failed. try next mount attempt without smb option ...
[ERROR] [mount] - [undefined Error: Command failed: sudo mount -t cifs -o username=Backup,password=****,rw,file_mode=0777,dir_mode=0777 //192.168.178.35/homes/Backup/iobroker/minimalPi4 /opt/iobroker/backups
Unable to find suitable address.

[ERROR] [mount] - [IGNORED] Error: Command failed: sudo mount -t cifs -o username=Backup,password=****,rw,file_mode=0777,dir_mode=0777 //192.168.178.35/homes/Backup/iobroker/minimalPi4 /opt/iobroker/backups
Unable to find suitable address.

[DEBUG] [iobroker] - host.raspberrypi 14084 states saved

[DEBUG] [iobroker] - host.raspberrypi 16331 objects saved

[DEBUG] [iobroker] - Backup created: /opt/iobroker/backups/iobroker_2021_03_07-19_34_18_influx grafana2_backupiobroker.tar.gz

[DEBUG] [iobroker] - done
[DEBUG] [influxDB] - Start InfluxDB Backup ...
[DEBUG] [influxDB] - InfluxDB Backup tmp directory created
[DEBUG] [influxDB] - Packed 15MB so far...
[DEBUG] [influxDB] - Packed 47MB so far...
[DEBUG] [influxDB] - Packed 79MB so far...
[DEBUG] [influxDB] - Packed 149MB so far...
[DEBUG] [influxDB] - Packed 235MB so far...
[DEBUG] [influxDB] - Packed 313MB so far...
[DEBUG] [influxDB] - Packed 405MB so far...
[DEBUG] [influxDB] - Packed 481MB so far...
[DEBUG] [influxDB] - Packed 562MB so far...
[DEBUG] [influxDB] - Packed 646MB so far...
[DEBUG] [influxDB] - Packed 727MB so far...
[DEBUG] [influxDB] - Packed 817MB so far...
[DEBUG] [influxDB] - Backup created: /opt/iobroker/backups/influxDB_2021_03_07-19_34_51_influx grafana2_backupiobroker.tar.gz
[DEBUG] [influxDB] - Try deleting the InfluxDB tmp directory
[DEBUG] [influxDB] - InfluxDB tmp directory was successfully deleted
[DEBUG] [influxDB] - done
[DEBUG] [grafana] - Start Grafana Backup ...
[DEBUG] [grafana] - Created grafana_tmp directory
[DEBUG] [grafana] - Created dashboard directory
[DEBUG] [grafana] - Created dashboards_manually_restore directory
[DEBUG] [grafana] - Created datasource directory
[DEBUG] [grafana] - start Grafana request ...
[DEBUG] [grafana] - Grafana is available ... Status: 200
[DEBUG] [grafana] - found Dashboard: n1-aussen-wz
[DEBUG] [grafana] - start Grafana backup compress ...
[DEBUG] [grafana] - Backup created: /opt/iobroker/backups/grafana_2021_03_07-19_42_25_backupiobroker.tar.gz
[DEBUG] [grafana] - Try deleting the Grafana tmp directory: "/opt/iobroker/backups/grafana_tmp"
[DEBUG] [grafana] - Grafana tmp directory "/opt/iobroker/backups/grafana_tmp" successfully deleted
[DEBUG] [grafana] - done
[DEBUG] [cifs] - done
[DEBUG] [googledrive] - Google Drive: Copy iobroker_2021_03_07-19_34_18_influx grafana2_backupiobroker.tar.gz...
[DEBUG] [googledrive] - Google Drive: Copy influxDB_2021_03_07-19_34_51_influx grafana2_backupiobroker.tar.gz...
Ich glaube jetzt hat es geklappt:+1: oder:-1:
@altersrentner sieht so aus, grafana und influx, dein cifs hast aber noch aktiv(was du ja nicht nutzt), also Haken noch raus bei Nas.
aber deine Backups sind gemacht
musst nur dran denken, das du bei deiner SSD Influx und Grafana installiert haben musst um das backup ein zu spielen -
@altersrentner sieht so aus, grafana und influx, dein cifs hast aber noch aktiv(was du ja nicht nutzt), also Haken noch raus bei Nas.
aber deine Backups sind gemacht
musst nur dran denken, das du bei deiner SSD Influx und Grafana installiert haben musst um das backup ein zu spielen@crunchip OK
wget -qO- https://repos.influxdata.com/influxdb.key | sudo apt-key add -
source /etc/os-release
echo "deb https://repos.influxdata.com/debian $(lsb_release -cs) stable" | sudo tee /etc/apt/sources.list.d/influxdb.list

sudo apt update
sudo apt install -y influxdb
sudo systemctl unmask influxdb.service
sudo systemctl start influxdb.service
sudo systemctl enable influxdb.service
Damit installiere ich Influx.
Kannst Du mir bitte noch den Code für Grafana mitteilen?
Danke
Mit freundlichen Grüßen
Michael -
@crunchip OK
wget -qO- https://repos.influxdata.com/influxdb.key | sudo apt-key add -
source /etc/os-release
echo "deb https://repos.influxdata.com/debian $(lsb_release -cs) stable" | sudo tee /etc/apt/sources.list.d/influxdb.list

sudo apt update
sudo apt install -y influxdb
sudo systemctl unmask influxdb.service
sudo systemctl start influxdb.service
sudo systemctl enable influxdb.service
Damit installiere ich Influx.
Kannst Du mir bitte noch den Code für Grafana mitteilen?
Danke
Mit freundlichen Grüßen
Michael@altersrentner
apt-Schlüssel zufügenwget -q -O - https://packages.grafana.com/gpg.key | sudo apt-key add -grafana repository hinzufügen
echo "deb https://packages.grafana.com/oss/deb stable main" | sudo tee -a /etc/apt/sources.list.d/grafana.listinstallieren
sudo apt-get update
sudo apt-get install -y grafana
aktivieren und starten
sudo /bin/systemctl enable grafana-server
sudo /bin/systemctl start grafana-server
aufrufen dann über http://<ip address>:3000
Name und Kennwort ist standard
admin
admin -
@altersrentner
apt-Schlüssel zufügenwget -q -O - https://packages.grafana.com/gpg.key | sudo apt-key add -grafana repository hinzufügen
echo "deb https://packages.grafana.com/oss/deb stable main" | sudo tee -a /etc/apt/sources.list.d/grafana.listinstallieren
sudo apt-get update
sudo apt-get install -y grafana
aktivieren und starten
sudo /bin/systemctl enable grafana-server
sudo /bin/systemctl start grafana-server
aufrufen dann über http://<ip address>:3000
Name und Kennwort ist standard
admin
admin@crunchip D A N K E !
Mit freundlichen Grüßen
Michael -
@altersrentner
apt-Schlüssel zufügenwget -q -O - https://packages.grafana.com/gpg.key | sudo apt-key add -grafana repository hinzufügen
echo "deb https://packages.grafana.com/oss/deb stable main" | sudo tee -a /etc/apt/sources.list.d/grafana.listinstallieren
sudo apt-get update
sudo apt-get install -y grafana
aktivieren und starten
sudo /bin/systemctl enable grafana-server
sudo /bin/systemctl start grafana-server
aufrufen dann über http://<ip address>:3000
Name und Kennwort ist standard
admin
admin@crunchip Hallo,
Die neue SSD ist angeschlossen.
ioBroker läuft,
InfluxDB ist wieder hergestellt,
Influx Adapter ist grün,
Grafana ist wieder hergestellt,
API Key ist eingegeben
In vis kommt bei den Graphen die Meldung:
IP hat Verbindung abgelehnt.
Wenn ich Grafana öffne erscheinen meine angelegten
Dashboards nicht.
Gibt es eine Möglichkeit sie zu finden?
Ist das Protokoll so ok?
Mit freundlichen Grüßen
Michael -
@crunchip Hallo,
Die neue SSD ist angeschlossen.
ioBroker läuft,
InfluxDB ist wieder hergestellt,
Influx Adapter ist grün,
Grafana ist wieder hergestellt,
API Key ist eingegeben
In vis kommt bei den Graphen die Meldung:
IP hat Verbindung abgelehnt.
Wenn ich Grafana öffne erscheinen meine angelegten
Dashboards nicht.
Gibt es eine Möglichkeit sie zu finden?
Ist das Protokoll so ok?
Mit freundlichen Grüßen
Michael@altersrentner sagte in [ Geklärt ] Problem bei Influx Installation:
In vis kommt bei den Graphen die Meldung:
IP hat Verbindung abgelehnt.du meinst bei der Einbindung eines Dashboards in vis? dein Rechner hat ja nun ne neue Ip oder? Dann stimmt ja der Pfad nicht mehr(IP).
in deinem Screen, sofern ichs richtig entziffern kann, steht dein api key, bez. Nutzername/Passwort falsch@altersrentner sagte in [ Geklärt ] Problem bei Influx Installation:
IP hat Verbindung abgelehnt.
du musst auch wieder die Grafana.ini bearbeiten
sudo nano /etc/grafana/grafana.inidort musst du folgende Einträge anppassen(ebenfalls das ; vor jeder dieser Zeilen entfernen, damit dies aktiv werden
orgName musst du natürlich mit deinem ersetzen[security] allow_embedding = true [auth.anonymous] enabled = true org_name = Main Org. org_role = Viewer [users] allow_sign_up = falseanschliesssend grafana-server neustarten
sudo service grafana-server restart -
@altersrentner sagte in [ Geklärt ] Problem bei Influx Installation:
In vis kommt bei den Graphen die Meldung:
IP hat Verbindung abgelehnt.du meinst bei der Einbindung eines Dashboards in vis? dein Rechner hat ja nun ne neue Ip oder? Dann stimmt ja der Pfad nicht mehr(IP).
in deinem Screen, sofern ichs richtig entziffern kann, steht dein api key, bez. Nutzername/Passwort falsch@altersrentner sagte in [ Geklärt ] Problem bei Influx Installation:
IP hat Verbindung abgelehnt.
du musst auch wieder die Grafana.ini bearbeiten
sudo nano /etc/grafana/grafana.inidort musst du folgende Einträge anppassen(ebenfalls das ; vor jeder dieser Zeilen entfernen, damit dies aktiv werden
orgName musst du natürlich mit deinem ersetzen[security] allow_embedding = true [auth.anonymous] enabled = true org_name = Main Org. org_role = Viewer [users] allow_sign_up = falseanschliesssend grafana-server neustarten
sudo service grafana-server restart@crunchip sagte in [ Geklärt ] Problem bei Influx Installation:
dein Rechner hat ja nun ne neue Ip oder? Dann stimmt ja der Pfad nicht mehr(IP).
Hallo,
Neindie IP ist geblieben. Benutzer und Passwort solten auch richtig sein..
Ich stecke nochmal die alte FP an. Mal sehen ob ich was finde
MfG Michael
685
Online32.7k
Users82.3k
Topics1.3m
Posts