

Forecast.solar mit dem Systeminfo Adapter
-
@JB_Sullivan sagte:
wann es ggf. sinnvoller ist den Geschirrspüler, die Waschmaschine, oder Wäschetrockner einzuschalten.
Dann interessieren Dich nicht die "watt_hours_day", sondern die "watts".
-
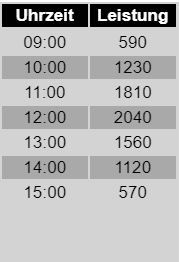
@paul53 Also relativ einfach machbar wäre es die watts_hours in festen Schritten zu errechnen:
Mitternacht bis 9:00
9:00 bis 12:00
12:00 bis 15:00
15:00 bis 18:00
18:00 bis 21:00
21:00 bis Mitternacht@Gargano sagte:
relativ einfach machbar wäre es die watts_hours in festen Schritten zu errechnen:
Das sind die über den Tag kumulierten Werte. Wozu braucht man die ?
So einfach ist es auch nicht, denn das die Zeiten und Werte ab 15:00 Uhr:
'2020-12-15 15:00:00':8720,'2020-12-15 15:41:00':8780,'2020-12-15 16:22:00':8780,Bitte verzichtet auf Chat-Nachrichten, denn die Handhabung ist grauenhaft !
Produktiv: Asus PN 42 / N100 / 8 GB / 500 GB; Proxmox mit 2 VM (iob / openCCU) -
@paul53 sagte in Forecast.solar mit dem Systeminfo Adapter:
Das ganze zweimal und beide Werte addieren.
OK, dann bin ich wieder raus - Javaskript ist halt nicht meins.......aber ist es korrekt, das bei dem Ergebnis nur ein Zahlenwert bei dem Objekt drin steht und keine jsaon Tabelle mit mehreren Werten?
Also bei mir steht 6843 - ich nehme mal an Wh drin. In Wirklichkeit hatte ich heute aber nur 2396 Wh Erzeugung. Wobei lt. Formel das nur der Wert vom Westdach wäre. die 2369 sind aber schon der Tagesertrag von beiden Dachflächen.
Also entweder ich habe irgendwo einen Bock drin, oder so toll ist die Vorhersage dann doch nicht.
@JB_Sullivan sagte:
Tabelle mit mehreren Werten?
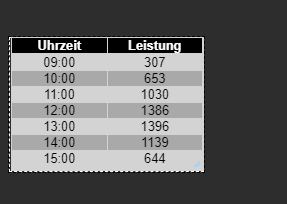
Du möchtest eine JSON-Tabelle. Dafür habe ich mal die Funktion von @Gargano abgewandelt.
function GetSolar() {
    request(options, function(error, response, body) {
        if (!error && response.statusCode == 200) {
            let watts = JSON.parse(body).result.watts;
            let today = formatDate(new Date(), 'YYYY-MM-DD');
            let table = [];
            for(let time in watts) {
                let pos = time.indexOf(':00:00');
                if(time.includes(today) && pos != -1) {
                    let entry = {};
                    entry.Uhrzeit = time.substr(pos - 2, 5);
                    entry.Leistung = watts[time];
                    table.push(entry);
                }
            }
            setState(SolarJSON, JSON.stringify(table), true);
        }
    });
}
Bitte verzichtet auf Chat-Nachrichten, denn die Handhabung ist grauenhaft !
Produktiv: Asus PN 42 / N100 / 8 GB / 500 GB; Proxmox mit 2 VM (iob / openCCU) -
@JB_Sullivan sagte:
Tabelle mit mehreren Werten?
Du möchtest eine JSON-Tabelle. Dafür habe ich mal die Funktion von @Gargano abgewandelt.
function GetSolar() { request(options, function(error, response, body) { if (!error && response.statusCode == 200) { let watts = JSON.parse(body).result.watts; let today = formatDate(new Date(), 'YYYY-MM-DD'); let table = []; for(let time in watts) { let pos = time.indexOf(':00:00'); if(time.includes(today) && pos != -1) { let entry = {}; entry.Uhrzeit = time.substr(pos - 2, 5); entry.Leistung = watts[time]; table.push(entry); } } setState(SolarJSON, JSON.stringify(table), true); } }); } -
@paul53 Evtl. wäre für JB_Sullivan eine Grafik mit den Watts -Werten das Richtige. Hast Du eine Idee, mit welchem Widget man aus der JSON Tabelle die Werte anzeigt ?
@Gargano sagte:
mit welchem Widget
Mit Vis kenne ich mich kaum aus. Ich weiß nur, wie die JSON-Table für das Widget "JSON Table" aufgebaut sein muss.
Bitte verzichtet auf Chat-Nachrichten, denn die Handhabung ist grauenhaft !
Produktiv: Asus PN 42 / N100 / 8 GB / 500 GB; Proxmox mit 2 VM (iob / openCCU) -
@Gargano sagte:
relativ einfach machbar wäre es die watts_hours in festen Schritten zu errechnen:
Das sind die über den Tag kumulierten Werte. Wozu braucht man die ?
So einfach ist es auch nicht, denn das die Zeiten und Werte ab 15:00 Uhr:
'2020-12-15 15:00:00':8720,'2020-12-15 15:41:00':8780,'2020-12-15 16:22:00':8780, -
@Gargano sagte:
mit welchem Widget
Mit Vis kenne ich mich kaum aus. Ich weiß nur, wie die JSON-Table für das Widget "JSON Table" aufgebaut sein muss.
-
@paul53 Auch gut, dann kann man die Teblle in einem JSON Widget darstellen. Werde ich morgen mal ausprobieren.
-
Vielen Dank euch beiden, das ihr Euch für mich den Kopf zerbrecht ;)
Ja eine Grafik wäre cool. Kann man das vielleicht so machen, das man Datenpunkte generiert, welche die Zeit von 6:00 - 22:00 (wegen Sommer) im 30 Minuten Rhythmus abdecken (also 32 DPs).
Diese 32 DP`s trackt man via History oder InfluxDB, wodurch man sich mit FLOT oder GRAFANA dann ein Diagramm basteln kann.Vielleicht geht es auch eleganter, aber für mich als Laien wäre das so eine Idee, wie man ggf. ein Diagramm aus den rein kommenden Daten basteln könnte.
@Gargano - nimm mal oben aus dem Skript deine Geodaten raus - muss ja nicht jeder wissen wo du wohnst - oder?
Achso - das mit der VIS Tabelle habe ich dank Eurer Skripte auch hin bekommen
PS: Das Skript ist aber nach wie vor nur für eine Ausrichtung - oder?
Habe im übrigen noch eine coole Seite gefunden, für Leute welche PV-Prognosen für ihren Standort anzeigen lassen wollen.
ioBroker (since 2018) auf Intel Core i3-5005U NUC und Windwos10 Pro
-
Vielen Dank euch beiden, das ihr Euch für mich den Kopf zerbrecht ;)
Ja eine Grafik wäre cool. Kann man das vielleicht so machen, das man Datenpunkte generiert, welche die Zeit von 6:00 - 22:00 (wegen Sommer) im 30 Minuten Rhythmus abdecken (also 32 DPs).
Diese 32 DP`s trackt man via History oder InfluxDB, wodurch man sich mit FLOT oder GRAFANA dann ein Diagramm basteln kann.Vielleicht geht es auch eleganter, aber für mich als Laien wäre das so eine Idee, wie man ggf. ein Diagramm aus den rein kommenden Daten basteln könnte.
@Gargano - nimm mal oben aus dem Skript deine Geodaten raus - muss ja nicht jeder wissen wo du wohnst - oder?
Achso - das mit der VIS Tabelle habe ich dank Eurer Skripte auch hin bekommen
PS: Das Skript ist aber nach wie vor nur für eine Ausrichtung - oder?
Habe im übrigen noch eine coole Seite gefunden, für Leute welche PV-Prognosen für ihren Standort anzeigen lassen wollen.
@JB_Sullivan sagte:
Das Skript ist aber nach wie vor nur für eine Ausrichtung - oder?
Ja.
@JB_Sullivan sagte in Forecast.solar mit dem Systeminfo Adapter:
Kann man das vielleicht so machen, das man Datenpunkte generiert, welche die Zeit von 6:00 - 22:00 (wegen Sommer) im 30 Minuten Rhythmus abdecken (also 32 DPs).
Die Daten werden nur im Stunden-Rhythmus geliefert. Im Sommer wird die Tabelle automatisch länger.
-
Vielen Dank euch beiden, das ihr Euch für mich den Kopf zerbrecht ;)
Ja eine Grafik wäre cool. Kann man das vielleicht so machen, das man Datenpunkte generiert, welche die Zeit von 6:00 - 22:00 (wegen Sommer) im 30 Minuten Rhythmus abdecken (also 32 DPs).
Diese 32 DP`s trackt man via History oder InfluxDB, wodurch man sich mit FLOT oder GRAFANA dann ein Diagramm basteln kann.Vielleicht geht es auch eleganter, aber für mich als Laien wäre das so eine Idee, wie man ggf. ein Diagramm aus den rein kommenden Daten basteln könnte.
@Gargano - nimm mal oben aus dem Skript deine Geodaten raus - muss ja nicht jeder wissen wo du wohnst - oder?
Achso - das mit der VIS Tabelle habe ich dank Eurer Skripte auch hin bekommen
PS: Das Skript ist aber nach wie vor nur für eine Ausrichtung - oder?
Habe im übrigen noch eine coole Seite gefunden, für Leute welche PV-Prognosen für ihren Standort anzeigen lassen wollen.
@JB_Sullivan So, jetzt gibts es ein Objekt JSONTable für beide Ausrichtungen
Bitte unter options1 und options2 die enstprechenden Werte eintragen
Unter SolarJSONTable ist dann das Objekt mit beiden Ausrichtungenconst SolarJSON1 = "javascript.0.SolarForecast.JSON1"; const SolarJSON2 = "javascript.0.SolarForecast.JSON2"; const SolarJSONTable = "javascript.0.SolarForecast.JSONTable"; const creatStateList = [ {name :SolarJSON1, type:"string", role : "value"}, {name :SolarJSON2, type:"string", role : "value"}, {name :SolarJSONTable, type:"string", role : "value"} ] creatStateList.forEach (function(item) { createState(item.name, { type: item.type, min: 0, def: 0, role: item.role }); }); var request = require('request'); var options1 = {url: 'https://api.forecast.solar/estimate/lat1/lon1/45/45/1', method: 'GET', headers: { 'User-Agent': 'request' }}; var options2 = {url: 'https://api.forecast.solar/estimate/lat2/lon2/45/-45/1', method: 'GET', headers: { 'User-Agent': 'request' }}; var urls = [ {myUrl:options1,mySolarJSON:SolarJSON1}, {myUrl:options2,mySolarJSON:SolarJSON2} ] var promises = urls.map(myAsyncRequest); schedule({hour: 00, minute: 30}, getSolar ); getSolar(); function myAsyncRequest(myUrl) { log('Request '+myUrl.myUrl.url); return new Promise((resolve, reject) => { request(myUrl.myUrl.url, function(error, response, body) { if (!error && response.statusCode == 200) { let today = formatDate(new Date(), 'YYYY-MM-DD'); let watts = JSON.parse(body).result.watts; let table = []; for(let time in watts) { let pos = time.indexOf(':00:00'); if(time.includes(today) && pos != -1) { let entry = {}; entry.Uhrzeit = time.substr(pos - 2, 5); entry.Leistung = watts[time]; table.push(entry); } } log ('JSON: '+myUrl.mySolarJSON); setState(myUrl.mySolarJSON, JSON.stringify(table), true); resolve (body); } }); }) } function makeTable () { log ('MakeTable'); let watts1 = JSON.parse(getState(SolarJSON1).val); let watts2 = JSON.parse(getState(SolarJSON2).val); log ('Items: '+watts1.length); let table = []; for(var n=0;n<watts1.length;n++) { let entry = {}; entry.Uhrzeit = watts1[n].Uhrzeit; entry.Leistung1 = watts1[n].Leistung; entry.Leistung2 = watts2[n].Leistung; table.push(entry); } setState(SolarJSONTable, JSON.stringify(table), true); } function getSolar() { Promise.all(promises) .then(function(bodys) { console.log("All url loaded"); makeTable(); }) } -
@JB_Sullivan So, jetzt gibts es ein Objekt JSONTable für beide Ausrichtungen
Bitte unter options1 und options2 die enstprechenden Werte eintragen
Unter SolarJSONTable ist dann das Objekt mit beiden Ausrichtungenconst SolarJSON1 = "javascript.0.SolarForecast.JSON1"; const SolarJSON2 = "javascript.0.SolarForecast.JSON2"; const SolarJSONTable = "javascript.0.SolarForecast.JSONTable"; const creatStateList = [ {name :SolarJSON1, type:"string", role : "value"}, {name :SolarJSON2, type:"string", role : "value"}, {name :SolarJSONTable, type:"string", role : "value"} ] creatStateList.forEach (function(item) { createState(item.name, { type: item.type, min: 0, def: 0, role: item.role }); }); var request = require('request'); var options1 = {url: 'https://api.forecast.solar/estimate/lat1/lon1/45/45/1', method: 'GET', headers: { 'User-Agent': 'request' }}; var options2 = {url: 'https://api.forecast.solar/estimate/lat2/lon2/45/-45/1', method: 'GET', headers: { 'User-Agent': 'request' }}; var urls = [ {myUrl:options1,mySolarJSON:SolarJSON1}, {myUrl:options2,mySolarJSON:SolarJSON2} ] var promises = urls.map(myAsyncRequest); schedule({hour: 00, minute: 30}, getSolar ); getSolar(); function myAsyncRequest(myUrl) { log('Request '+myUrl.myUrl.url); return new Promise((resolve, reject) => { request(myUrl.myUrl.url, function(error, response, body) { if (!error && response.statusCode == 200) { let today = formatDate(new Date(), 'YYYY-MM-DD'); let watts = JSON.parse(body).result.watts; let table = []; for(let time in watts) { let pos = time.indexOf(':00:00'); if(time.includes(today) && pos != -1) { let entry = {}; entry.Uhrzeit = time.substr(pos - 2, 5); entry.Leistung = watts[time]; table.push(entry); } } log ('JSON: '+myUrl.mySolarJSON); setState(myUrl.mySolarJSON, JSON.stringify(table), true); resolve (body); } }); }) } function makeTable () { log ('MakeTable'); let watts1 = JSON.parse(getState(SolarJSON1).val); let watts2 = JSON.parse(getState(SolarJSON2).val); log ('Items: '+watts1.length); let table = []; for(var n=0;n<watts1.length;n++) { let entry = {}; entry.Uhrzeit = watts1[n].Uhrzeit; entry.Leistung1 = watts1[n].Leistung; entry.Leistung2 = watts2[n].Leistung; table.push(entry); } setState(SolarJSONTable, JSON.stringify(table), true); } function getSolar() { Promise.all(promises) .then(function(bodys) { console.log("All url loaded"); makeTable(); }) }Klappt prima (bis auf die Sonne ;-)
-
@JB_Sullivan So, jetzt gibts es ein Objekt JSONTable für beide Ausrichtungen
Bitte unter options1 und options2 die enstprechenden Werte eintragen
Unter SolarJSONTable ist dann das Objekt mit beiden Ausrichtungenconst SolarJSON1 = "javascript.0.SolarForecast.JSON1"; const SolarJSON2 = "javascript.0.SolarForecast.JSON2"; const SolarJSONTable = "javascript.0.SolarForecast.JSONTable"; const creatStateList = [ {name :SolarJSON1, type:"string", role : "value"}, {name :SolarJSON2, type:"string", role : "value"}, {name :SolarJSONTable, type:"string", role : "value"} ] creatStateList.forEach (function(item) { createState(item.name, { type: item.type, min: 0, def: 0, role: item.role }); }); var request = require('request'); var options1 = {url: 'https://api.forecast.solar/estimate/lat1/lon1/45/45/1', method: 'GET', headers: { 'User-Agent': 'request' }}; var options2 = {url: 'https://api.forecast.solar/estimate/lat2/lon2/45/-45/1', method: 'GET', headers: { 'User-Agent': 'request' }}; var urls = [ {myUrl:options1,mySolarJSON:SolarJSON1}, {myUrl:options2,mySolarJSON:SolarJSON2} ] var promises = urls.map(myAsyncRequest); schedule({hour: 00, minute: 30}, getSolar ); getSolar(); function myAsyncRequest(myUrl) { log('Request '+myUrl.myUrl.url); return new Promise((resolve, reject) => { request(myUrl.myUrl.url, function(error, response, body) { if (!error && response.statusCode == 200) { let today = formatDate(new Date(), 'YYYY-MM-DD'); let watts = JSON.parse(body).result.watts; let table = []; for(let time in watts) { let pos = time.indexOf(':00:00'); if(time.includes(today) && pos != -1) { let entry = {}; entry.Uhrzeit = time.substr(pos - 2, 5); entry.Leistung = watts[time]; table.push(entry); } } log ('JSON: '+myUrl.mySolarJSON); setState(myUrl.mySolarJSON, JSON.stringify(table), true); resolve (body); } }); }) } function makeTable () { log ('MakeTable'); let watts1 = JSON.parse(getState(SolarJSON1).val); let watts2 = JSON.parse(getState(SolarJSON2).val); log ('Items: '+watts1.length); let table = []; for(var n=0;n<watts1.length;n++) { let entry = {}; entry.Uhrzeit = watts1[n].Uhrzeit; entry.Leistung1 = watts1[n].Leistung; entry.Leistung2 = watts2[n].Leistung; table.push(entry); } setState(SolarJSONTable, JSON.stringify(table), true); } function getSolar() { Promise.all(promises) .then(function(bodys) { console.log("All url loaded"); makeTable(); }) }@Gargano sagte:
JSONTable für beide Ausrichtungen
Die Lösung setzt voraus, dass beide Ausrichtungen mit der selben Uhrzeit beginnen und die gleiche Anzahl an Einträgen haben.
Bitte verzichtet auf Chat-Nachrichten, denn die Handhabung ist grauenhaft !
Produktiv: Asus PN 42 / N100 / 8 GB / 500 GB; Proxmox mit 2 VM (iob / openCCU) -
@Gargano sagte:
JSONTable für beide Ausrichtungen
Die Lösung setzt voraus, dass beide Ausrichtungen mit der selben Uhrzeit beginnen und die gleiche Anzahl an Einträgen haben.
-
@paul53 Richtig, da aber die beiden Abfragen zur gleichen Zeit sind , wird dies wohl immer so sein
@Gargano sagte:
da aber die beiden Abfragen zur gleichen Zeit sind , wird dies wohl immer so sein
Das glaube ich nicht bei Ausrichtung Ost/West.
Bitte verzichtet auf Chat-Nachrichten, denn die Handhabung ist grauenhaft !
Produktiv: Asus PN 42 / N100 / 8 GB / 500 GB; Proxmox mit 2 VM (iob / openCCU) -
@Gargano sagte:
da aber die beiden Abfragen zur gleichen Zeit sind , wird dies wohl immer so sein
Das glaube ich nicht bei Ausrichtung Ost/West.
-
@JB_Sullivan So, jetzt gibts es ein Objekt JSONTable für beide Ausrichtungen
Bitte unter options1 und options2 die enstprechenden Werte eintragen
Unter SolarJSONTable ist dann das Objekt mit beiden Ausrichtungenconst SolarJSON1 = "javascript.0.SolarForecast.JSON1"; const SolarJSON2 = "javascript.0.SolarForecast.JSON2"; const SolarJSONTable = "javascript.0.SolarForecast.JSONTable"; const creatStateList = [ {name :SolarJSON1, type:"string", role : "value"}, {name :SolarJSON2, type:"string", role : "value"}, {name :SolarJSONTable, type:"string", role : "value"} ] creatStateList.forEach (function(item) { createState(item.name, { type: item.type, min: 0, def: 0, role: item.role }); }); var request = require('request'); var options1 = {url: 'https://api.forecast.solar/estimate/lat1/lon1/45/45/1', method: 'GET', headers: { 'User-Agent': 'request' }}; var options2 = {url: 'https://api.forecast.solar/estimate/lat2/lon2/45/-45/1', method: 'GET', headers: { 'User-Agent': 'request' }}; var urls = [ {myUrl:options1,mySolarJSON:SolarJSON1}, {myUrl:options2,mySolarJSON:SolarJSON2} ] var promises = urls.map(myAsyncRequest); schedule({hour: 00, minute: 30}, getSolar ); getSolar(); function myAsyncRequest(myUrl) { log('Request '+myUrl.myUrl.url); return new Promise((resolve, reject) => { request(myUrl.myUrl.url, function(error, response, body) { if (!error && response.statusCode == 200) { let today = formatDate(new Date(), 'YYYY-MM-DD'); let watts = JSON.parse(body).result.watts; let table = []; for(let time in watts) { let pos = time.indexOf(':00:00'); if(time.includes(today) && pos != -1) { let entry = {}; entry.Uhrzeit = time.substr(pos - 2, 5); entry.Leistung = watts[time]; table.push(entry); } } log ('JSON: '+myUrl.mySolarJSON); setState(myUrl.mySolarJSON, JSON.stringify(table), true); resolve (body); } }); }) } function makeTable () { log ('MakeTable'); let watts1 = JSON.parse(getState(SolarJSON1).val); let watts2 = JSON.parse(getState(SolarJSON2).val); log ('Items: '+watts1.length); let table = []; for(var n=0;n<watts1.length;n++) { let entry = {}; entry.Uhrzeit = watts1[n].Uhrzeit; entry.Leistung1 = watts1[n].Leistung; entry.Leistung2 = watts2[n].Leistung; table.push(entry); } setState(SolarJSONTable, JSON.stringify(table), true); } function getSolar() { Promise.all(promises) .then(function(bodys) { console.log("All url loaded"); makeTable(); }) }Sieht gut aus - kannst du ggf. Noch eine Summen Bildung von Leistung 1 & 2 mit in die Tabelle aufnehmen?
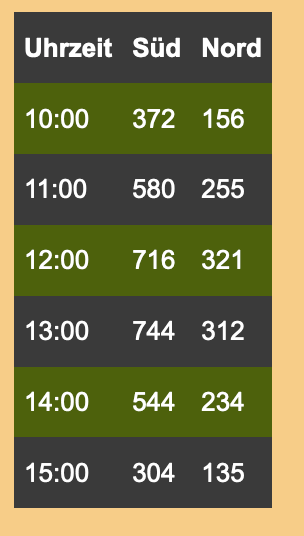
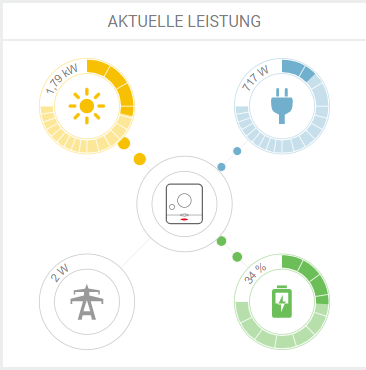
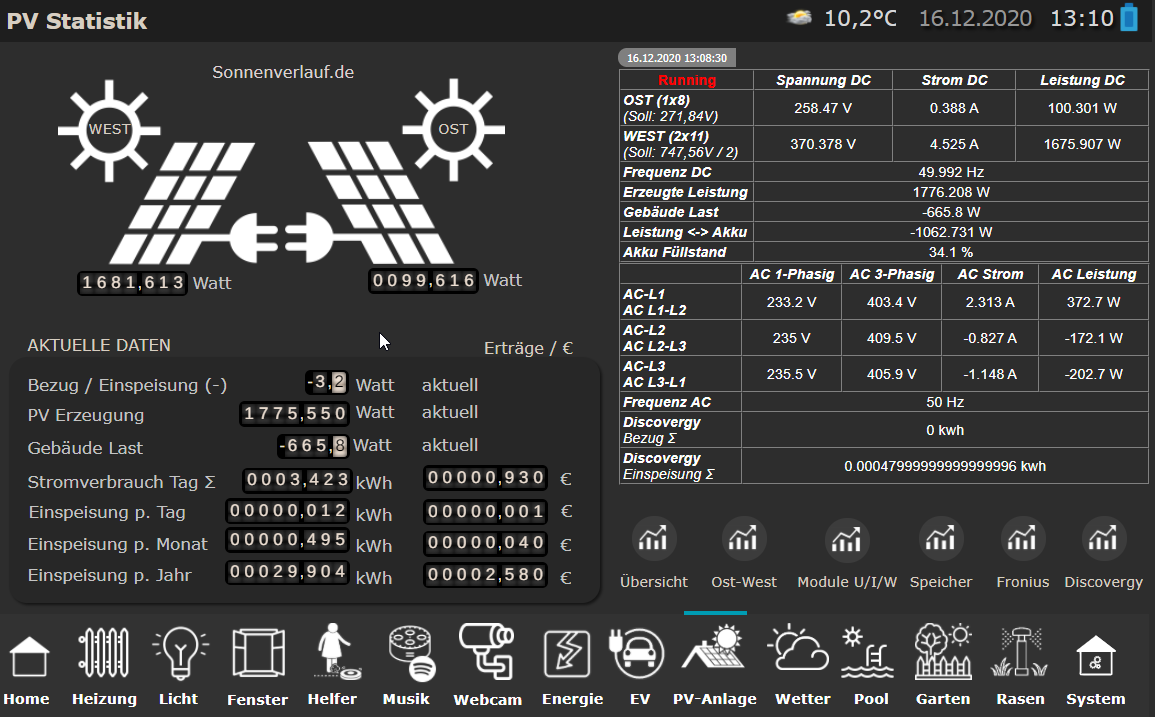
Der Hammer ist, das dass ziehmlich gut passt - 13:00 Uhr lt. Forecast 1952 Watt.
Real guckst du: Um die ~ 150 Watt wollen wir uns jetzt nicht streiten ;)
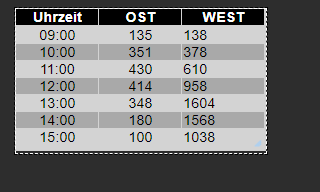
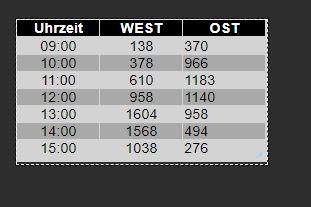
Auch die Aufteilung OST / WEST ist dicht an den prognostiziereten Werten.
ioBroker (since 2018) auf Intel Core i3-5005U NUC und Windwos10 Pro
-
Sieht gut aus - kannst du ggf. Noch eine Summen Bildung von Leistung 1 & 2 mit in die Tabelle aufnehmen?
Der Hammer ist, das dass ziehmlich gut passt - 13:00 Uhr lt. Forecast 1952 Watt.
Real guckst du: Um die ~ 150 Watt wollen wir uns jetzt nicht streiten ;)
Auch die Aufteilung OST / WEST ist dicht an den prognostiziereten Werten.
@JB_Sullivan sagte:
Sieht gut aus
Wie sieht es aus, wenn für options1 die Westausrichtung gewählt wird ?
Bitte verzichtet auf Chat-Nachrichten, denn die Handhabung ist grauenhaft !
Produktiv: Asus PN 42 / N100 / 8 GB / 500 GB; Proxmox mit 2 VM (iob / openCCU) -
@JB_Sullivan sagte:
Sieht gut aus
Wie sieht es aus, wenn für options1 die Westausrichtung gewählt wird ?
Interessant - dann sieht es anderes aus - allerdings habe ich auch unterschiedlich starke Belegungen auf OST und West
https://api.forecast.solar/estimate/52.xx/10.xx/40/90/7.26
https://api.forecast.solar/estimate/52.xx/10.xx/40/-90/2.64
Hey! Du scheinst an dieser Unterhaltung interessiert zu sein, hast aber noch kein Konto.
Hast du es satt, bei jedem Besuch durch die gleichen Beiträge zu scrollen? Wenn du dich für ein Konto anmeldest, kommst du immer genau dorthin zurück, wo du zuvor warst, und kannst dich über neue Antworten benachrichtigen lassen (entweder per E-Mail oder Push-Benachrichtigung). Du kannst auch Lesezeichen speichern und Beiträge positiv bewerten, um anderen Community-Mitgliedern deine Wertschätzung zu zeigen.
Mit deinem Input könnte dieser Beitrag noch besser werden 💗
Registrieren Anmelden375
Online33.0k
Benutzer83.5k
Themen1.3m
Beiträge