

Forecast.solar mit dem Systeminfo Adapter
-
@Gargano
Das sind einen Menge Daten, wobei zur Entscheidung, ob morgens der Puffer aufgeheizt werden soll, 'watt_hours_day' vom aktuellen Datum ausreichen sollte. Etwa:const options = {url: 'https://api.forecast.solar/estimate/Dein-Lat/Dein-Lon/45/45/10', method: 'GET', headers: { 'User-Agent': 'request' }}; request(options, function(error, response, body) { if (!error && response.statusCode == 200) { let res = JSON.parse(body).result; // res ist ein Objekt let today = formatDate(new Date(), 'YYYY-MM-DD'); log(res.watt_hours_day[today]); } });@paul53 sagte in Forecast.solar mit dem Systeminfo Adapter:
@Gargano
Das sind einen Menge Daten, wobei zur Entscheidung, ob morgens der Puffer aufgeheizt werden soll, 'watt_hours_day' vom aktuellen Datum ausreichen sollte. Etwa:const options = {url: 'https://api.forecast.solar/estimate/Dein-Lat/Dein-Lon/45/45/10', method: 'GET', headers: { 'User-Agent': 'request' }}; request(options, function(error, response, body) { if (!error && response.statusCode == 200) { let res = JSON.parse(body).result; // res ist ein Objekt let today = formatDate(new Date(), 'YYYY-MM-DD'); log(res.watt_hours_day[today]); } });Sorry, wenn ich dumm frage, aber ich habe von Javaskript NULL Ahnung - was machen die Codezeilen? Einen Datenpunkt erzeugen mit einer Json Tabelle? Was steht in der Tabelle so drin? Ist das VIS verwendbar?
ioBroker (since 2018) auf Intel Core i3-5005U NUC und Windwos10 Pro
-
@paul53 sagte in Forecast.solar mit dem Systeminfo Adapter:
@Gargano
Das sind einen Menge Daten, wobei zur Entscheidung, ob morgens der Puffer aufgeheizt werden soll, 'watt_hours_day' vom aktuellen Datum ausreichen sollte. Etwa:const options = {url: 'https://api.forecast.solar/estimate/Dein-Lat/Dein-Lon/45/45/10', method: 'GET', headers: { 'User-Agent': 'request' }}; request(options, function(error, response, body) { if (!error && response.statusCode == 200) { let res = JSON.parse(body).result; // res ist ein Objekt let today = formatDate(new Date(), 'YYYY-MM-DD'); log(res.watt_hours_day[today]); } });Sorry, wenn ich dumm frage, aber ich habe von Javaskript NULL Ahnung - was machen die Codezeilen? Einen Datenpunkt erzeugen mit einer Json Tabelle? Was steht in der Tabelle so drin? Ist das VIS verwendbar?
@JB_Sullivan sagte:
was machen die Codezeilen?
Sie ermitteln die Vorhersage der gesamten Einstrahlung (in Wh) für heute.
-
@paul53 sagte in Forecast.solar mit dem Systeminfo Adapter:
@Gargano
Das sind einen Menge Daten, wobei zur Entscheidung, ob morgens der Puffer aufgeheizt werden soll, 'watt_hours_day' vom aktuellen Datum ausreichen sollte. Etwa:const options = {url: 'https://api.forecast.solar/estimate/Dein-Lat/Dein-Lon/45/45/10', method: 'GET', headers: { 'User-Agent': 'request' }}; request(options, function(error, response, body) { if (!error && response.statusCode == 200) { let res = JSON.parse(body).result; // res ist ein Objekt let today = formatDate(new Date(), 'YYYY-MM-DD'); log(res.watt_hours_day[today]); } });Sorry, wenn ich dumm frage, aber ich habe von Javaskript NULL Ahnung - was machen die Codezeilen? Einen Datenpunkt erzeugen mit einer Json Tabelle? Was steht in der Tabelle so drin? Ist das VIS verwendbar?
@JB_Sullivan
Ich hab noch mal einen Datenpunkt dazu genommen
"javascript.0.SolarForecast.Today"
der wird jeden Tag um 0:30 upgedatet.Dein-Lon und Dein-Lat musst Du noch eintragen
Der Syntax der url ist
https://api.forecast.solar/estimate/lat/lon/dec/az/kwplat - latitude of location, -90 (south) … 90 (north)
lon - longitude of location, -180 (west) … 180 (east)
dec - plane declination, 0 (horizontal) … 90 (vertical)
az - plane azimuth, -180 … 180 (-180 = north, -90 = east, 0 = south, 90 = west, 180 = north)
kwp - installed modules power in kilo wattconst SolarToday = "javascript.0.SolarForecast.Today"; const creatStateList = [ {name :SolarToday, type:"number", role : "value"} ] creatStateList.forEach (function(item) { createState(item.name, { type: item.type, min: 0, def: 0, role: item.role }); }); var request = require('request'); var options = {url: 'https://api.forecast.solar/estimate/Dein-Lat/Dein-Lon/45/45/1', method: 'GET', headers: { 'User-Agent': 'request' }}; schedule({hour: 00, minute: 30}, GetSolar ); function GetSolar() { request(options, function(error, response, body) { if (!error && response.statusCode == 200) { let res = JSON.parse(body); // info ist ein Objekt let today = formatDate(new Date(), 'YYYY-MM-DD'); setState(SolarToday,res.result.watt_hours_day[today]); } }); } -
@JB_Sullivan
Ich hab noch mal einen Datenpunkt dazu genommen
"javascript.0.SolarForecast.Today"
der wird jeden Tag um 0:30 upgedatet.Dein-Lon und Dein-Lat musst Du noch eintragen
Der Syntax der url ist
https://api.forecast.solar/estimate/lat/lon/dec/az/kwplat - latitude of location, -90 (south) … 90 (north)
lon - longitude of location, -180 (west) … 180 (east)
dec - plane declination, 0 (horizontal) … 90 (vertical)
az - plane azimuth, -180 … 180 (-180 = north, -90 = east, 0 = south, 90 = west, 180 = north)
kwp - installed modules power in kilo wattconst SolarToday = "javascript.0.SolarForecast.Today"; const creatStateList = [ {name :SolarToday, type:"number", role : "value"} ] creatStateList.forEach (function(item) { createState(item.name, { type: item.type, min: 0, def: 0, role: item.role }); }); var request = require('request'); var options = {url: 'https://api.forecast.solar/estimate/Dein-Lat/Dein-Lon/45/45/1', method: 'GET', headers: { 'User-Agent': 'request' }}; schedule({hour: 00, minute: 30}, GetSolar ); function GetSolar() { request(options, function(error, response, body) { if (!error && response.statusCode == 200) { let res = JSON.parse(body); // info ist ein Objekt let today = formatDate(new Date(), 'YYYY-MM-DD'); setState(SolarToday,res.result.watt_hours_day[today]); } }); }@Gargano sagte in Forecast.solar mit dem Systeminfo Adapter:
az - plane azimuth, -180 … 180 (-180 = north, -90 = east, 0 = south, 90 = west, 180 = north)
Hmmmmmm - wie bekommt man denn hier eine OST / WEST Ausrichtung dargestellt? Also ich habe Solarplatten sowohl auf der Ost-, als auch auf der Westseite
ioBroker (since 2018) auf Intel Core i3-5005U NUC und Windwos10 Pro
-
@Gargano sagte in Forecast.solar mit dem Systeminfo Adapter:
az - plane azimuth, -180 … 180 (-180 = north, -90 = east, 0 = south, 90 = west, 180 = north)
Hmmmmmm - wie bekommt man denn hier eine OST / WEST Ausrichtung dargestellt? Also ich habe Solarplatten sowohl auf der Ost-, als auch auf der Westseite
@JB_Sullivan sagte:
Solarplatten sowohl auf der Ost-, als auch auf der Westseite
Das ganze zweimal und beide Werte addieren.
Bitte verzichtet auf Chat-Nachrichten, denn die Handhabung ist grauenhaft !
Produktiv: Asus PN 42 / N100 / 8 GB / 500 GB; Proxmox mit 2 VM (iob / openCCU) -
@JB_Sullivan sagte:
Solarplatten sowohl auf der Ost-, als auch auf der Westseite
Das ganze zweimal und beide Werte addieren.
@paul53 sagte in Forecast.solar mit dem Systeminfo Adapter:
Das ganze zweimal und beide Werte addieren.
OK, dann bin ich wieder raus - Javaskript ist halt nicht meins.......aber ist es korrekt, das bei dem Ergebnis nur ein Zahlenwert bei dem Objekt drin steht und keine jsaon Tabelle mit mehreren Werten?
Also bei mir steht 6843 - ich nehme mal an Wh drin. In Wirklichkeit hatte ich heute aber nur 2396 Wh Erzeugung. Wobei lt. Formel das nur der Wert vom Westdach wäre. die 2369 sind aber schon der Tagesertrag von beiden Dachflächen.
Also entweder ich habe irgendwo einen Bock drin, oder so toll ist die Vorhersage dann doch nicht.
ioBroker (since 2018) auf Intel Core i3-5005U NUC und Windwos10 Pro
-
@paul53 sagte in Forecast.solar mit dem Systeminfo Adapter:
Das ganze zweimal und beide Werte addieren.
OK, dann bin ich wieder raus - Javaskript ist halt nicht meins.......aber ist es korrekt, das bei dem Ergebnis nur ein Zahlenwert bei dem Objekt drin steht und keine jsaon Tabelle mit mehreren Werten?
Also bei mir steht 6843 - ich nehme mal an Wh drin. In Wirklichkeit hatte ich heute aber nur 2396 Wh Erzeugung. Wobei lt. Formel das nur der Wert vom Westdach wäre. die 2369 sind aber schon der Tagesertrag von beiden Dachflächen.
Also entweder ich habe irgendwo einen Bock drin, oder so toll ist die Vorhersage dann doch nicht.
@JB_Sullivan sagte:
Bock drin, oder so toll ist die Vorhersage dann doch nicht.
Hast Du eine zu große Modulleistung übergeben ?
Da Vorhersagen die Zukunft betreffen, sind sie selten genau. -
@Gargano sagte in Forecast.solar mit dem Systeminfo Adapter:
@JB_Sullivan Was willst Du denn mit den Daten machen ?
Mein Plan war es via Übersichtsseite der Frau aufzuzeigen, wann es ggf. sinnvoller ist den Geschirrspüler, die Waschmaschine, oder Wäschetrockner einzuschalten. Auch die Poolpumpe könnte via Skript eine Option für den Sommer sein - da bin ich mir aber noch nicht sicher.
Es gibt für PV-Anlagen Besitzer zwar so Energiemanagement Hardware Tools die dann diese ganzen Geräte steuern können, jedoch machen diese das anhand des gemessenen PV Überschuss und nicht Prognose basiert.
Beides zusammen, also Prognose und reale Messung, wäre natürlich ideal. Allerdings braucht man dann so einen Solarmanager, welcher nochmal ~700 Euro kostet und alle Verbraucher müssen Kabel mäßig einzeln ansteuerbar sein.
Ist viel (Kosten) Aufwand, aber möglich. Warum also im Vorfeld nicht erstmal gucken, ob man anhand der Prognose Daten es ggf. händisch geregelt bekommt die unterschiedlichen Verbraucher zu nutzen oder nicht zu benutzen ;)
@JB_Sullivan sagte:
wann es ggf. sinnvoller ist den Geschirrspüler, die Waschmaschine, oder Wäschetrockner einzuschalten.
Dann interessieren Dich nicht die "watt_hours_day", sondern die "watts".
Bitte verzichtet auf Chat-Nachrichten, denn die Handhabung ist grauenhaft !
Produktiv: Asus PN 42 / N100 / 8 GB / 500 GB; Proxmox mit 2 VM (iob / openCCU) -
@paul53 sagte in Forecast.solar mit dem Systeminfo Adapter:
Das ganze zweimal und beide Werte addieren.
OK, dann bin ich wieder raus - Javaskript ist halt nicht meins.......aber ist es korrekt, das bei dem Ergebnis nur ein Zahlenwert bei dem Objekt drin steht und keine jsaon Tabelle mit mehreren Werten?
Also bei mir steht 6843 - ich nehme mal an Wh drin. In Wirklichkeit hatte ich heute aber nur 2396 Wh Erzeugung. Wobei lt. Formel das nur der Wert vom Westdach wäre. die 2369 sind aber schon der Tagesertrag von beiden Dachflächen.
Also entweder ich habe irgendwo einen Bock drin, oder so toll ist die Vorhersage dann doch nicht.
@JB_Sullivan Also ich hab mal auch die Watts in dem Objekt JSON hinterlegt.
Zum Test wird die Funktion auch gleich nach dem Start des Scripts einmal aufgerufen , ansonsten um 00:30
Mal sehen, evtl. bekomme ich es morgen hin mit 2 Panel-Flächen.
Nur weis ich nicht wie man die Watts aufdröseln soll. (Objekte Watts jede Stunde ?)const SolarJSON = "javascript.0.SolarForecast.JSON"; const SolarToday = "javascript.0.SolarForecast.Today"; const creatStateList = [ {name :SolarJSON, type:"string", role : "value"}, {name :SolarToday, type:"number", role : "value"} ] creatStateList.forEach (function(item) { createState(item.name, { type: item.type, min: 0, def: 0, role: item.role }); }); var request = require('request'); var options = {url: 'https://api.forecast.solar/estimate/xxx/yyy/45/45/1', method: 'GET', headers: { 'User-Agent': 'request' }}; schedule('6 6-18 * * *', getSolar); getSolar(); function getSolar() { request(options, function(error, response, body) { if (!error && response.statusCode == 200) { let res = JSON.parse(body); // res ist ein Objekt log (res.result.watt_hours_day); let today = formatDate(new Date(), 'YYYY-MM-DD'); log(res.result.watt_hours_day[today]); setState(SolarJSON,JSON.stringify(res.result.watts)); setState(SolarToday,res.result.watt_hours_day[today]); } }); } -
@JB_Sullivan sagte:
wann es ggf. sinnvoller ist den Geschirrspüler, die Waschmaschine, oder Wäschetrockner einzuschalten.
Dann interessieren Dich nicht die "watt_hours_day", sondern die "watts".
-
@paul53 Also relativ einfach machbar wäre es die watts_hours in festen Schritten zu errechnen:
Mitternacht bis 9:00
9:00 bis 12:00
12:00 bis 15:00
15:00 bis 18:00
18:00 bis 21:00
21:00 bis Mitternacht@Gargano sagte:
relativ einfach machbar wäre es die watts_hours in festen Schritten zu errechnen:
Das sind die über den Tag kumulierten Werte. Wozu braucht man die ?
So einfach ist es auch nicht, denn das die Zeiten und Werte ab 15:00 Uhr:
'2020-12-15 15:00:00':8720,'2020-12-15 15:41:00':8780,'2020-12-15 16:22:00':8780,Bitte verzichtet auf Chat-Nachrichten, denn die Handhabung ist grauenhaft !
Produktiv: Asus PN 42 / N100 / 8 GB / 500 GB; Proxmox mit 2 VM (iob / openCCU) -
@paul53 sagte in Forecast.solar mit dem Systeminfo Adapter:
Das ganze zweimal und beide Werte addieren.
OK, dann bin ich wieder raus - Javaskript ist halt nicht meins.......aber ist es korrekt, das bei dem Ergebnis nur ein Zahlenwert bei dem Objekt drin steht und keine jsaon Tabelle mit mehreren Werten?
Also bei mir steht 6843 - ich nehme mal an Wh drin. In Wirklichkeit hatte ich heute aber nur 2396 Wh Erzeugung. Wobei lt. Formel das nur der Wert vom Westdach wäre. die 2369 sind aber schon der Tagesertrag von beiden Dachflächen.
Also entweder ich habe irgendwo einen Bock drin, oder so toll ist die Vorhersage dann doch nicht.
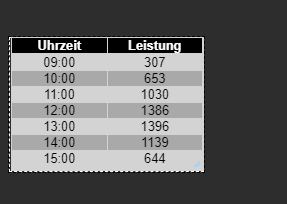
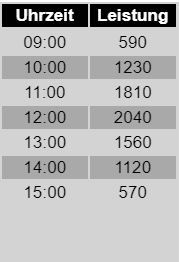
@JB_Sullivan sagte:
Tabelle mit mehreren Werten?
Du möchtest eine JSON-Tabelle. Dafür habe ich mal die Funktion von @Gargano abgewandelt.
function GetSolar() {
    request(options, function(error, response, body) {
        if (!error && response.statusCode == 200) {
            let watts = JSON.parse(body).result.watts;
            let today = formatDate(new Date(), 'YYYY-MM-DD');
            let table = [];
            for(let time in watts) {
                let pos = time.indexOf(':00:00');
                if(time.includes(today) && pos != -1) {
                    let entry = {};
                    entry.Uhrzeit = time.substr(pos - 2, 5);
                    entry.Leistung = watts[time];
                    table.push(entry);
                }
            }
            setState(SolarJSON, JSON.stringify(table), true);
        }
    });
}
Bitte verzichtet auf Chat-Nachrichten, denn die Handhabung ist grauenhaft !
Produktiv: Asus PN 42 / N100 / 8 GB / 500 GB; Proxmox mit 2 VM (iob / openCCU) -
@JB_Sullivan sagte:
Tabelle mit mehreren Werten?
Du möchtest eine JSON-Tabelle. Dafür habe ich mal die Funktion von @Gargano abgewandelt.
function GetSolar() { request(options, function(error, response, body) { if (!error && response.statusCode == 200) { let watts = JSON.parse(body).result.watts; let today = formatDate(new Date(), 'YYYY-MM-DD'); let table = []; for(let time in watts) { let pos = time.indexOf(':00:00'); if(time.includes(today) && pos != -1) { let entry = {}; entry.Uhrzeit = time.substr(pos - 2, 5); entry.Leistung = watts[time]; table.push(entry); } } setState(SolarJSON, JSON.stringify(table), true); } }); } -
@paul53 Evtl. wäre für JB_Sullivan eine Grafik mit den Watts -Werten das Richtige. Hast Du eine Idee, mit welchem Widget man aus der JSON Tabelle die Werte anzeigt ?
@Gargano sagte:
mit welchem Widget
Mit Vis kenne ich mich kaum aus. Ich weiß nur, wie die JSON-Table für das Widget "JSON Table" aufgebaut sein muss.
Bitte verzichtet auf Chat-Nachrichten, denn die Handhabung ist grauenhaft !
Produktiv: Asus PN 42 / N100 / 8 GB / 500 GB; Proxmox mit 2 VM (iob / openCCU) -
@Gargano sagte:
relativ einfach machbar wäre es die watts_hours in festen Schritten zu errechnen:
Das sind die über den Tag kumulierten Werte. Wozu braucht man die ?
So einfach ist es auch nicht, denn das die Zeiten und Werte ab 15:00 Uhr:
'2020-12-15 15:00:00':8720,'2020-12-15 15:41:00':8780,'2020-12-15 16:22:00':8780, -
@Gargano sagte:
mit welchem Widget
Mit Vis kenne ich mich kaum aus. Ich weiß nur, wie die JSON-Table für das Widget "JSON Table" aufgebaut sein muss.
-
@paul53 Auch gut, dann kann man die Teblle in einem JSON Widget darstellen. Werde ich morgen mal ausprobieren.
-
Vielen Dank euch beiden, das ihr Euch für mich den Kopf zerbrecht ;)
Ja eine Grafik wäre cool. Kann man das vielleicht so machen, das man Datenpunkte generiert, welche die Zeit von 6:00 - 22:00 (wegen Sommer) im 30 Minuten Rhythmus abdecken (also 32 DPs).
Diese 32 DP`s trackt man via History oder InfluxDB, wodurch man sich mit FLOT oder GRAFANA dann ein Diagramm basteln kann.Vielleicht geht es auch eleganter, aber für mich als Laien wäre das so eine Idee, wie man ggf. ein Diagramm aus den rein kommenden Daten basteln könnte.
@Gargano - nimm mal oben aus dem Skript deine Geodaten raus - muss ja nicht jeder wissen wo du wohnst - oder?
Achso - das mit der VIS Tabelle habe ich dank Eurer Skripte auch hin bekommen
PS: Das Skript ist aber nach wie vor nur für eine Ausrichtung - oder?
Habe im übrigen noch eine coole Seite gefunden, für Leute welche PV-Prognosen für ihren Standort anzeigen lassen wollen.
ioBroker (since 2018) auf Intel Core i3-5005U NUC und Windwos10 Pro
-
Vielen Dank euch beiden, das ihr Euch für mich den Kopf zerbrecht ;)
Ja eine Grafik wäre cool. Kann man das vielleicht so machen, das man Datenpunkte generiert, welche die Zeit von 6:00 - 22:00 (wegen Sommer) im 30 Minuten Rhythmus abdecken (also 32 DPs).
Diese 32 DP`s trackt man via History oder InfluxDB, wodurch man sich mit FLOT oder GRAFANA dann ein Diagramm basteln kann.Vielleicht geht es auch eleganter, aber für mich als Laien wäre das so eine Idee, wie man ggf. ein Diagramm aus den rein kommenden Daten basteln könnte.
@Gargano - nimm mal oben aus dem Skript deine Geodaten raus - muss ja nicht jeder wissen wo du wohnst - oder?
Achso - das mit der VIS Tabelle habe ich dank Eurer Skripte auch hin bekommen
PS: Das Skript ist aber nach wie vor nur für eine Ausrichtung - oder?
Habe im übrigen noch eine coole Seite gefunden, für Leute welche PV-Prognosen für ihren Standort anzeigen lassen wollen.
@JB_Sullivan sagte:
Das Skript ist aber nach wie vor nur für eine Ausrichtung - oder?
Ja.
@JB_Sullivan sagte in Forecast.solar mit dem Systeminfo Adapter:
Kann man das vielleicht so machen, das man Datenpunkte generiert, welche die Zeit von 6:00 - 22:00 (wegen Sommer) im 30 Minuten Rhythmus abdecken (also 32 DPs).
Die Daten werden nur im Stunden-Rhythmus geliefert. Im Sommer wird die Tabelle automatisch länger.
Hey! Du scheinst an dieser Unterhaltung interessiert zu sein, hast aber noch kein Konto.
Hast du es satt, bei jedem Besuch durch die gleichen Beiträge zu scrollen? Wenn du dich für ein Konto anmeldest, kommst du immer genau dorthin zurück, wo du zuvor warst, und kannst dich über neue Antworten benachrichtigen lassen (entweder per E-Mail oder Push-Benachrichtigung). Du kannst auch Lesezeichen speichern und Beiträge positiv bewerten, um anderen Community-Mitgliedern deine Wertschätzung zu zeigen.
Mit deinem Input könnte dieser Beitrag noch besser werden 💗
Registrieren Anmelden392
Online33.0k
Benutzer83.5k
Themen1.3m
Beiträge