

Test Coronavirus Statistics for ioBroker
-
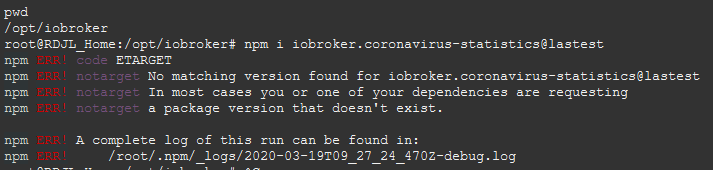
wie komme ich jetzt zu version 0.2.3 ??
lg Rudi
Master Debian 12 (Wien) site to site VPN to Tulln
Intel NUC6CAYH 16GB RAM, 500 GB SSD & auf Proxmox 8. 7. als VMSlave Debian 12. (TULLN) --> site to site VPN to Vienna
Intel NUC6CAYH 16GB RAM, 500 GB SSD & auf Proxmox 8.7. als VMNode 22.23.0
Nodejs 22.23.0
npm 10.9.8
js-controller 7.2.2 -
@MyzerAT sagte in Test Coronavirus Statistics for ioBroker:
wie komme ich jetzt zu version 0.2.3 ??
wird ab circa 15Uhr im admin angeboten, oder jetzt auf console :
cd /opt/iobroker npm i ioBroker.coronavirus-statistics@latest -
@MyzerAT sagte in Test Coronavirus Statistics for ioBroker:
wie komme ich jetzt zu version 0.2.3 ??
wird ab circa 15Uhr im admin angeboten, oder jetzt auf console :
cd /opt/iobroker npm i ioBroker.coronavirus-statistics@latest -
@Scrounger Bei mir kommen keine Linien?! Wo ist der Fehler?
@Uli977
@Scrounger Das sieht bei mir genauso aus. Das passt zu dem Fehler, über den wir per PM geschrieben haben. Gerade deine View zum Testen extra nochmal importiert. Selben Phänomen. -
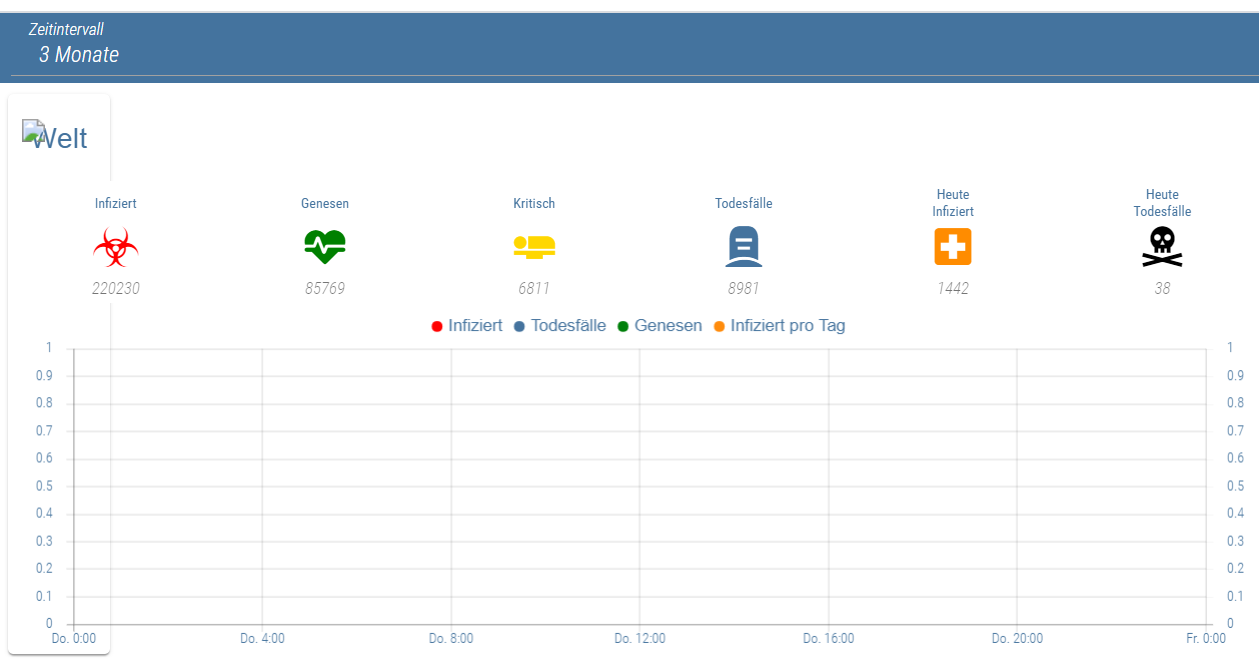
Als Anregung hier meine View(s) mit Material Design Widgets:
View mit Grid Widget mit Selects für Zeitintervall & Filter:
View mit Statistik und Line History Graph - am Beispiel Welt:
Für Filter und Zeitinterval Funktion werden noch folgende Datenpunkte benötigt:

Und folgendes Skript damit man filtern kann:
// Filter für Corona Statistik on({ id: '0_userdata.0.vis.Corona.filter', change: 'any' }, function (obj) { if (obj.state.val === 'continents') { setState('0_userdata.0.vis.Corona.visibileContinent', true, true); setState('0_userdata.0.vis.Corona.visibileCountries', false, true); } else if (obj.state.val === 'countries') { setState('0_userdata.0.vis.Corona.visibileContinent', false, true); setState('0_userdata.0.vis.Corona.visibileCountries', true, true); } else { setState('0_userdata.0.vis.Corona.visibileContinent', true, true); setState('0_userdata.0.vis.Corona.visibileCountries', true, true); } });javascript.0 2020-03-19 10:39:28.302 warn (11884) getState "coronavirus-statistics.0.Togo.todayDeathsPerOneMillion" not found (3) javascript.0 2020-03-19 10:39:28.302 warn (11884) at Timer.processTimers (timers.js:223:10) javascript.0 2020-03-19 10:39:28.302 warn (11884) at listOnTimeout (timers.js:263:5) javascript.0 2020-03-19 10:39:28.302 warn (11884) at tryOnTimeout (timers.js:300:5) javascript.0 2020-03-19 10:39:28.302 warn (11884) at ontimeout (timers.js:438:13) javascript.0 2020-03-19 10:39:28.302 warn (11884) at Timeout._onTimeout (C:\Program Files\iobroker\Test\node_modules\iobroker.javascript\lib\sandbox.js:2077:34) javascript.0 2020-03-19 10:39:28.302 warn (11884) at Object.<anonymous> (script.js.Sigi.Corona_Kontinent:78:17) javascript.0 2020-03-19 10:39:28.302 warn (11884) at calcStats (script.js.Sigi.Corona_Kontinent:110:97) javascript.0 2020-03-19 10:39:28.301 warn (11884) getState "coronavirus-statistics.0.Togo.todayCasesPerOneMillion" not found (3) javascript.0 2020-03-19 10:39:28.301 warn (11884) at Timer.processTimers (timers.js:223:10) javascript.0 2020-03-19 10:39:28.301 warn (11884) at listOnTimeout (timers.js:263:5) javascript.0 2020-03-19 10:39:28.301 warn (11884) at tryOnTimeout (timers.js:300:5) javascript.0 2020-03-19 10:39:28.301 warn (11884) at ontimeout (timers.js:438:13) javascript.0 2020-03-19 10:39:28.301 warn (11884) at Timeout._onTimeout (C:\Program Files\iobroker\Test\node_modules\iobroker.javascript\lib\sandbox.js:2077:34) javascript.0 2020-03-19 10:39:28.301 warn (11884) at Object.<anonymous> (script.js.Sigi.Corona_Kontinent:78:17) javascript.0 2020-03-19 10:39:28.301 warn (11884) at calcStats (script.js.Sigi.Corona_Kontinent:109:93) javascript.0 2020-03-19 10:39:28.301 warn (11884) getState "coronavirus-statistics.0.Togo.criticalPerOneMillion" not found (3)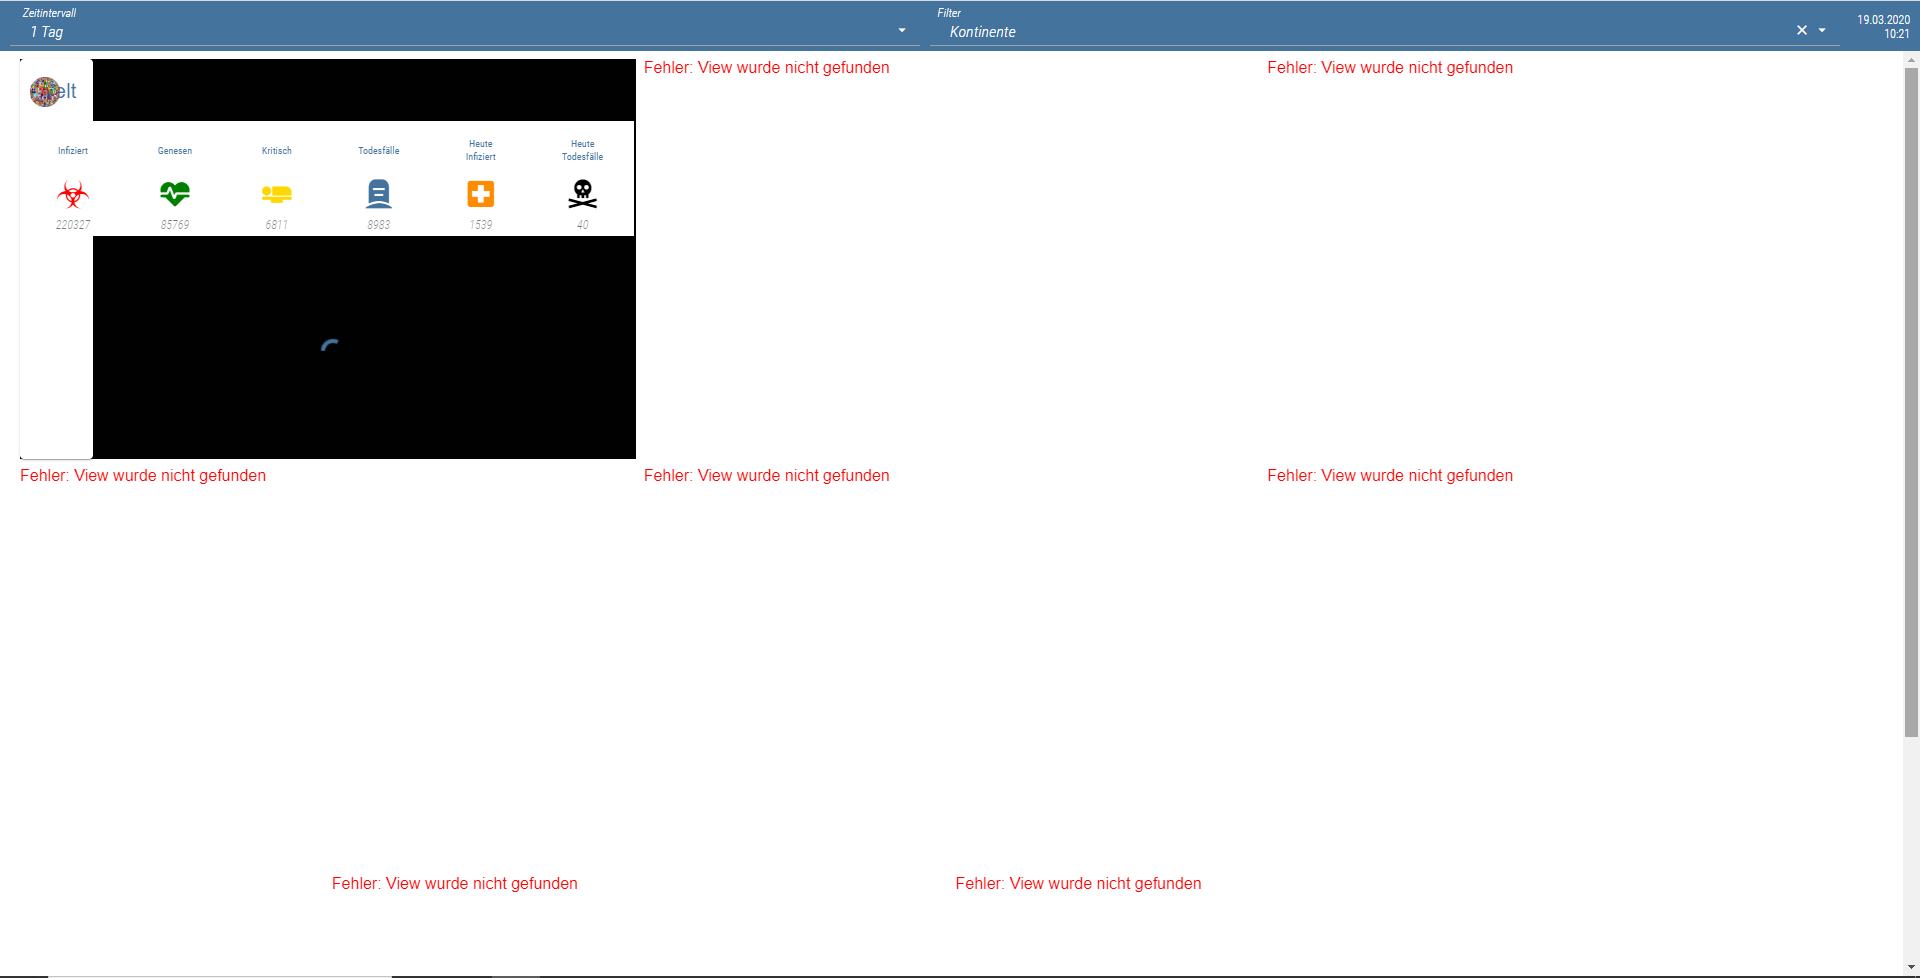
Bitte benutzt das Voting rechts unten im Beitrag wenn er euch geholfen hat.
Immer Daten sichern! -
javascript.0 2020-03-19 10:39:28.302 warn (11884) getState "coronavirus-statistics.0.Togo.todayDeathsPerOneMillion" not found (3) javascript.0 2020-03-19 10:39:28.302 warn (11884) at Timer.processTimers (timers.js:223:10) javascript.0 2020-03-19 10:39:28.302 warn (11884) at listOnTimeout (timers.js:263:5) javascript.0 2020-03-19 10:39:28.302 warn (11884) at tryOnTimeout (timers.js:300:5) javascript.0 2020-03-19 10:39:28.302 warn (11884) at ontimeout (timers.js:438:13) javascript.0 2020-03-19 10:39:28.302 warn (11884) at Timeout._onTimeout (C:\Program Files\iobroker\Test\node_modules\iobroker.javascript\lib\sandbox.js:2077:34) javascript.0 2020-03-19 10:39:28.302 warn (11884) at Object.<anonymous> (script.js.Sigi.Corona_Kontinent:78:17) javascript.0 2020-03-19 10:39:28.302 warn (11884) at calcStats (script.js.Sigi.Corona_Kontinent:110:97) javascript.0 2020-03-19 10:39:28.301 warn (11884) getState "coronavirus-statistics.0.Togo.todayCasesPerOneMillion" not found (3) javascript.0 2020-03-19 10:39:28.301 warn (11884) at Timer.processTimers (timers.js:223:10) javascript.0 2020-03-19 10:39:28.301 warn (11884) at listOnTimeout (timers.js:263:5) javascript.0 2020-03-19 10:39:28.301 warn (11884) at tryOnTimeout (timers.js:300:5) javascript.0 2020-03-19 10:39:28.301 warn (11884) at ontimeout (timers.js:438:13) javascript.0 2020-03-19 10:39:28.301 warn (11884) at Timeout._onTimeout (C:\Program Files\iobroker\Test\node_modules\iobroker.javascript\lib\sandbox.js:2077:34) javascript.0 2020-03-19 10:39:28.301 warn (11884) at Object.<anonymous> (script.js.Sigi.Corona_Kontinent:78:17) javascript.0 2020-03-19 10:39:28.301 warn (11884) at calcStats (script.js.Sigi.Corona_Kontinent:109:93) javascript.0 2020-03-19 10:39:28.301 warn (11884) getState "coronavirus-statistics.0.Togo.criticalPerOneMillion" not found (3)Fehlermeldung kommt wegen dem neuen Wert. Muss ich das Skript anpassen.
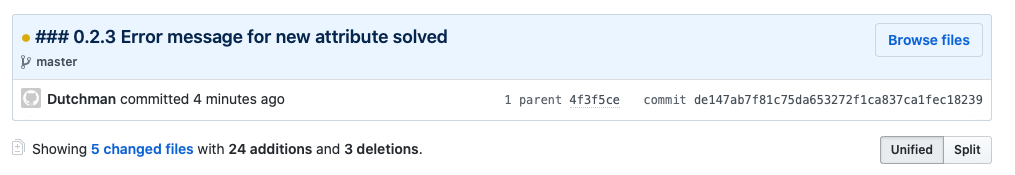
@Dutchman sagte in Test Coronavirus Statistics for ioBroker:
solved in 0.2.3
@sigi234 sagte in Test Coronavirus Statistics for ioBroker:
das funktioniert auch nicht out of the box!
Ihr müsst für die Graphen Eure eigenen History Instanzen und Datenpunkte eintragen -
Fehlermeldung kommt wegen dem neuen Wert. Muss ich das Skript anpassen.
@Dutchman sagte in Test Coronavirus Statistics for ioBroker:
solved in 0.2.3
@sigi234 sagte in Test Coronavirus Statistics for ioBroker:
das funktioniert auch nicht out of the box!
Ihr müsst für die Graphen Eure eigenen History Instanzen und Datenpunkte eintragen@Scrounger sagte in Test Coronavirus Statistics for ioBroker:
Ihr müsst für die Graphen Eure eigenen History Instanzen und Datenpunkte eintragen
Habe ich
Bitte benutzt das Voting rechts unten im Beitrag wenn er euch geholfen hat.
Immer Daten sichern! -
@Scrounger sagte in Test Coronavirus Statistics for ioBroker:
Ihr müsst für die Graphen Eure eigenen History Instanzen und Datenpunkte eintragen
Habe ich
@sigi234 sagte in Test Coronavirus Statistics for ioBroker:
@Scrounger sagte in Test Coronavirus Statistics for ioBroker:
Ihr müsst für die Graphen Eure eigenen History Instanzen und Datenpunkte eintragen
Habe ich
Es gehen keine meiner Charts mehr , dreht ständig im Kreis
Vis-materialdesign-Chart-Line-History
Edit:
Mit Update erledigt.
-
Aktuelle Test Version 0.6.9 Veröffentlichungsdatum 22-03-2021 Github Link https://github.com/iobroker-community-adapters/ioBroker.coronavirus-statistics/blob/master/README.md NPM npm i ioBroker.coronavirus-statistics@latestAdapter to show Global Corona Virus information and current reports
Coronavirus Live Statistics adapter for ioBroker
Adapter to show Global Corona Virus information and current reports
There is no configuration required, after installation it will :
- Receive global information world-wide and write it to "global_totals"
- Create a folder for each country with all relevant information regarding COVID-19
- Update the information every 15 minutes
The following information is available :
Datapoint Details active Amount of current infected people cases Amount of totally known cases casesPerOneMillion Amount of totally known cases per million citizen critical Amount of critical situation (Hospitalized) deaths Amount of current registered deaths deathsPerOneMillion Amount of current registered deaths per million citizen recovered Amount of totally known recovered cases todayCases New Cases by Today todayDeaths Amount of totally known people died today test Total number of covid-19 tests taken globally tests per one million counties Total number of covid-19 tests taken globally per one million Please be aware this adapter uses as much as possible up-to-date information but there can be an delay of several hours depending on the country's report.
German Federal States : https://npgeo-corona-npgeo-de.hub.arcgis.com/ s
Generic Source : https://coronavirus-19-api.herokuapp.comAdvanced settings
Option Description All Countries Get data for all countries World-Wide (Default: false) Continents Group total amounts by continent in seperate state (Default: false) Delete unused States Delete data when countries are deselected (Default: false) German counties Get counties data for Germany (Selected only, Default false) German federal states Get federal state data for Germany (Selected only, Default false) Get all German federal states Get federal state data for Germany (Default false) Get all German counties Get all counties data for Germany (Default false) For Germany only
It's possible to get data for federal states (Bundesländer) and counties (Landeskreise).
You can choose to recieve all data or just select specific regions in advanced settings.Please note : After activation the the adapter must run 1 time to get all federal states and counties before table loads !
Add missing countries
It may happen that countries are not recognized correctly because the API delivers some country names not ISO conform. In such a case you will get a warning message in the log, which looks like this
coronavirus-statistics.0 2020-03-21 09:05:31.328 warn (22937) Timor-Leste not found in lib! Must be added to the country name translator.Using the datapoint
coronavirus-statistics.0.countryTranslatoryou can assign a country yourself. Look for the name of the corresponding country here:With the selected country name you have to create a JSON string and enter it in the datapoint
coronavirus-statistics.0.countryTranslator.
The JSON string then looks like this, for example:{ "Cabo_Verde": "Cape Verde", "Timor-Leste": "East Timor" }As first value the name from the warning message must be taken from the log. The name of the country from the List with country names is then assigned to this.
Changelog
https://github.com/iobroker-community-adapters/ioBroker.coronavirus-statistics/blob/master/README.md
@Dutchman Nur mal in den Raum geworfen:
Hast du auch mal an die Möglichkeit gedacht ein Quarantäne Countdown einzubauen?
ioBroker auf NUC unter Proxmox; VIS: 12" Touchscreen und 17" Touch; Lichtsteuerung, Thermometer und Sensoren: Tasmota (39); Ambiente Beleuchtung: WLED (9); Heizung: DECT Thermostate (9) an Fritz 6690; EMS-ESP; 1 Echo V2; 3 Echo DOT; 1 Echo Connect; 2 Echo Show 5; Unifi Ap-Ac Lite.
-
version 0.2.4 ist raus mit grossen dank an @Scrounger der seine Lösung der continente implementiert hat !
naaste baustelle : filter per land das man nicht die ganze wel rein bekommt :)
-
@Dutchman Nur mal in den Raum geworfen:
Hast du auch mal an die Möglichkeit gedacht ein Quarantäne Countdown einzubauen?@Chaot sagte in Test Coronavirus Statistics for ioBroker:
Hast du auch mal an die Möglichkeit gedacht ein Quarantäne Countdown einzubauen?
hehe, euh .... mach mir ein git issue und ich nimmt beim niesten release mit so schwer ist das garnicht

-
@Chaot sagte in Test Coronavirus Statistics for ioBroker:
Hast du auch mal an die Möglichkeit gedacht ein Quarantäne Countdown einzubauen?
hehe, euh .... mach mir ein git issue und ich nimmt beim niesten release mit so schwer ist das garnicht
@Dutchman
Habe ich gemacht. Alternativ habe ich mir das Ding hier mal angeschaut:
https://forum.iobroker.net/topic/22077/neuer-adapter-countdown/42?page=3Würde auch taugen. Ist zwar bischen blöd einzustellen, aber machbar.
ioBroker auf NUC unter Proxmox; VIS: 12" Touchscreen und 17" Touch; Lichtsteuerung, Thermometer und Sensoren: Tasmota (39); Ambiente Beleuchtung: WLED (9); Heizung: DECT Thermostate (9) an Fritz 6690; EMS-ESP; 1 Echo V2; 3 Echo DOT; 1 Echo Connect; 2 Echo Show 5; Unifi Ap-Ac Lite.
-
@Dutchman
Habe ich gemacht. Alternativ habe ich mir das Ding hier mal angeschaut:
https://forum.iobroker.net/topic/22077/neuer-adapter-countdown/42?page=3Würde auch taugen. Ist zwar bischen blöd einzustellen, aber machbar.
@Chaot sagte in Test Coronavirus Statistics for ioBroker:
Würde auch taugen. Ist zwar bischen blöd einzustellen, aber machbar.
ich dachte eher daran nen Datenpunkt mit datum ein zu tragen der dan runter zählt.
mal schauen -
@Chaot sagte in Test Coronavirus Statistics for ioBroker:
Würde auch taugen. Ist zwar bischen blöd einzustellen, aber machbar.
ich dachte eher daran nen Datenpunkt mit datum ein zu tragen der dan runter zählt.
mal schauen@Dutchman
Ich gehe davon aus das wir in den nächsten Tagen die Anordnung "Quarantäne bis xx.xx.xxxx " bekommen werden.
Dafür taugt dann der Countdown.Bei uns ist seit heute sogar nachts die Straßenbeleuchtung aus aber die Leute sind immer noch unterwegs.
Da hilft dann vermutlich wirklich nur noch die Keule.ioBroker auf NUC unter Proxmox; VIS: 12" Touchscreen und 17" Touch; Lichtsteuerung, Thermometer und Sensoren: Tasmota (39); Ambiente Beleuchtung: WLED (9); Heizung: DECT Thermostate (9) an Fritz 6690; EMS-ESP; 1 Echo V2; 3 Echo DOT; 1 Echo Connect; 2 Echo Show 5; Unifi Ap-Ac Lite.
-
@Dutchman
Ich gehe davon aus das wir in den nächsten Tagen die Anordnung "Quarantäne bis xx.xx.xxxx " bekommen werden.
Dafür taugt dann der Countdown.Bei uns ist seit heute sogar nachts die Straßenbeleuchtung aus aber die Leute sind immer noch unterwegs.
Da hilft dann vermutlich wirklich nur noch die Keule.@Chaot sagte in Test Coronavirus Statistics for ioBroker:
heute sogar nachts die Straßenbeleuchtung
Strom sparen, damit das Smarthome weiter laufen kann

-
@Dutchman
Habe ich gemacht. Alternativ habe ich mir das Ding hier mal angeschaut:
https://forum.iobroker.net/topic/22077/neuer-adapter-countdown/42?page=3Würde auch taugen. Ist zwar bischen blöd einzustellen, aber machbar.
@Chaot sowas wie Einfacher Countdown
allerdings habe ich gesehen, dass du selbst in dem Thread aktiv warst. -
Ich habe mich ein wenig hin gesetzt und eine view in 800*600 speziel für ältere Tablets erstellt (habe mich an einer view hier aus dem Tread bedient... danke für die Vorlage)
kann in iqontrol als PopUp genutzt werden
Falls jemand interesse hat...
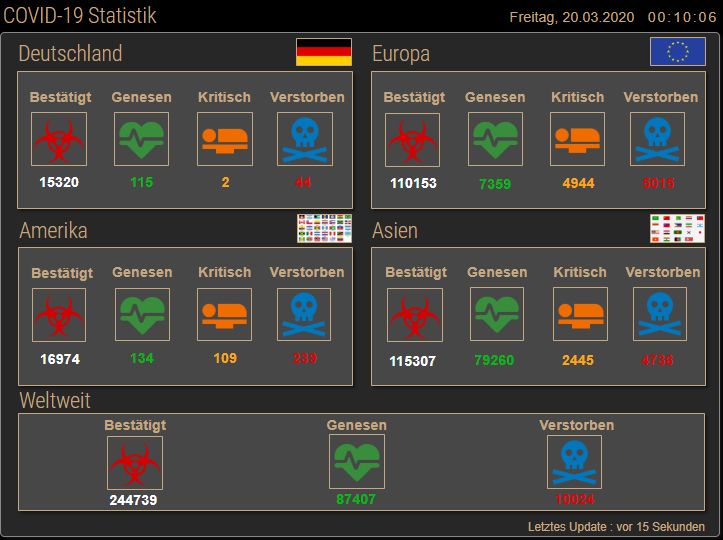
Dazu ein Button für zB iqontrol:

hier die View einfach zum einfügen: Corona View.txt
Die icons: Icons.rarHier noch die Flaggen: Flaggen.rar
Getestet mit iPad2 und Huawei MediaTab T3
edit: hatte die Icons vergessen
-
Ich habe mich ein wenig hin gesetzt und eine view in 800*600 speziel für ältere Tablets erstellt (habe mich an einer view hier aus dem Tread bedient... danke für die Vorlage)
kann in iqontrol als PopUp genutzt werden
Falls jemand interesse hat...
Dazu ein Button für zB iqontrol:
hier die View einfach zum einfügen: Corona View.txt
Die icons: Icons.rarHier noch die Flaggen: Flaggen.rar
Getestet mit iPad2 und Huawei MediaTab T3
edit: hatte die Icons vergessen
 ```
```

Hey! Du scheinst an dieser Unterhaltung interessiert zu sein, hast aber noch kein Konto.
Hast du es satt, bei jedem Besuch durch die gleichen Beiträge zu scrollen? Wenn du dich für ein Konto anmeldest, kommst du immer genau dorthin zurück, wo du zuvor warst, und kannst dich über neue Antworten benachrichtigen lassen (entweder per E-Mail oder Push-Benachrichtigung). Du kannst auch Lesezeichen speichern und Beiträge positiv bewerten, um anderen Community-Mitgliedern deine Wertschätzung zu zeigen.
Mit deinem Input könnte dieser Beitrag noch besser werden 💗
Registrieren AnmeldenSupport us
422
Online33.0k
Benutzer83.4k
Themen1.3m
Beiträge