

Load average IO-Broker auf Raspberry 4 (8GB)
-
Ich habe mal eine neue IO-Broker Installation auf einem jungfräulichen Raspberry 4 mit 8 GB Ram getestet.
Noch nicht wirklich viel dazugemacht. Es gibt einen Shelly, History,ECharts Javascript, ESPHome und Tankerkönig Adapter, auf dem JS Adapter läuft nichts, VIS hat eine Testseite mit 3 Widgets, Echarts genu Chart.
Wenn ich top eingebetop - 20:41:00 up 7 days, 2:11, 3 users, load average: 1,34, 1,62, 1,85 Tasks: 203 total, 4 running, 199 sleeping, 0 stopped, 0 zombiesehe ich, dass die durchschnittliche Last immer größer als 1 ist. Ich dacht immer, die sollte nur in Ausnahmefälle größer als 1 sein damit das System flüssig läuft.
Wie groß ist denn bei Euch die durchschnittliche Last? -
Ich habe mal eine neue IO-Broker Installation auf einem jungfräulichen Raspberry 4 mit 8 GB Ram getestet.
Noch nicht wirklich viel dazugemacht. Es gibt einen Shelly, History,ECharts Javascript, ESPHome und Tankerkönig Adapter, auf dem JS Adapter läuft nichts, VIS hat eine Testseite mit 3 Widgets, Echarts genu Chart.
Wenn ich top eingebetop - 20:41:00 up 7 days, 2:11, 3 users, load average: 1,34, 1,62, 1,85 Tasks: 203 total, 4 running, 199 sleeping, 0 stopped, 0 zombiesehe ich, dass die durchschnittliche Last immer größer als 1 ist. Ich dacht immer, die sollte nur in Ausnahmefälle größer als 1 sein damit das System flüssig läuft.
Wie groß ist denn bei Euch die durchschnittliche Last?@wolfgangfb sagte in Load average IO-Broker auf Raspberry 4 (8GB):
Ich dacht immer, die sollte nur in Ausnahmefälle größer als 1 sein damit das System flüssig läuft.
pro Kern!
also <4 beim Pi4.
@wolfgangfb sagte in Load average IO-Broker auf Raspberry 4 (8GB):
Wie groß ist denn bei Euch die durchschnittliche Last?
trotzdem niedriger.
Aber ohne den Rest zu sehen kann man dazu so nichts sagen.
Zumal 1.3 nicht besorgniserregend ist. -
Ich habe mal eine neue IO-Broker Installation auf einem jungfräulichen Raspberry 4 mit 8 GB Ram getestet.
Noch nicht wirklich viel dazugemacht. Es gibt einen Shelly, History,ECharts Javascript, ESPHome und Tankerkönig Adapter, auf dem JS Adapter läuft nichts, VIS hat eine Testseite mit 3 Widgets, Echarts genu Chart.
Wenn ich top eingebetop - 20:41:00 up 7 days, 2:11, 3 users, load average: 1,34, 1,62, 1,85 Tasks: 203 total, 4 running, 199 sleeping, 0 stopped, 0 zombiesehe ich, dass die durchschnittliche Last immer größer als 1 ist. Ich dacht immer, die sollte nur in Ausnahmefälle größer als 1 sein damit das System flüssig läuft.
Wie groß ist denn bei Euch die durchschnittliche Last?top - 21:27:56 up 1 day, 24 min, 2 users, load average: 0.51, 0.70, 0.60 Tasks: 204 total, 1 running, 203 sleeping, 0 stopped, 0 zombie %Cpu(s): 4.4 us, 4.1 sy, 0.0 ni, 91.2 id, 0.0 wa, 0.0 hi, 0.3 si, 0.0 st MiB Mem : 7810.2 total, 2167.7 free, 2457.6 used, 3307.9 buff/cache MiB Swap: 100.0 total, 100.0 free, 0.0 used. 5352.6 avail MemSo aus dem Zusammhang gerissen sagt das allerdings Null aus.
-
@thomas-braun
Läuft da denn überhaupt etwas bei Dir. Ich sehe genau 1 Task running. Bei mir schwankt die Zahl der running Tasks zwischen 20 und 70.
Als ersten verdächtige ich History und ECharts. Da habe ich ein paar (<10) Sensoren dazu genommen und schon ist die Load average bei ~10. -
@thomas-braun
Läuft da denn überhaupt etwas bei Dir. Ich sehe genau 1 Task running. Bei mir schwankt die Zahl der running Tasks zwischen 20 und 70.
Als ersten verdächtige ich History und ECharts. Da habe ich ein paar (<10) Sensoren dazu genommen und schon ist die Load average bei ~10.@wolfgangfb sagte in Load average IO-Broker auf Raspberry 4 (8GB):
Läuft da denn überhaupt etwas bei Dir.
Klar läuft hier was.
Der komplette ioBroker mit 35 aktiven Instanzen z. B. -
@thomas-braun
Läuft da denn überhaupt etwas bei Dir. Ich sehe genau 1 Task running. Bei mir schwankt die Zahl der running Tasks zwischen 20 und 70.
Als ersten verdächtige ich History und ECharts. Da habe ich ein paar (<10) Sensoren dazu genommen und schon ist die Load average bei ~10.@wolfgangfb sagte in Load average IO-Broker auf Raspberry 4 (8GB):
Als ersten verdächtige ich History und ECharts
du brauchst niemanden zu verdächtigen, du musst dir nur den Rest von top ansehen (nach %cpu sortiert) und uns zeigen.
Allerdings steckt in der load avarage mehr als die CPU-Auslastung.
bitte
iob diagin der Langfassung. -
Ich habe mal eine neue IO-Broker Installation auf einem jungfräulichen Raspberry 4 mit 8 GB Ram getestet.
Noch nicht wirklich viel dazugemacht. Es gibt einen Shelly, History,ECharts Javascript, ESPHome und Tankerkönig Adapter, auf dem JS Adapter läuft nichts, VIS hat eine Testseite mit 3 Widgets, Echarts genu Chart.
Wenn ich top eingebetop - 20:41:00 up 7 days, 2:11, 3 users, load average: 1,34, 1,62, 1,85 Tasks: 203 total, 4 running, 199 sleeping, 0 stopped, 0 zombiesehe ich, dass die durchschnittliche Last immer größer als 1 ist. Ich dacht immer, die sollte nur in Ausnahmefälle größer als 1 sein damit das System flüssig läuft.
Wie groß ist denn bei Euch die durchschnittliche Last?@wolfgangfb sagte in Load average IO-Broker auf Raspberry 4 (8GB):
load average: 1,34, 1,62, 1,85
Moin,
nur um das zu präzisieren, das sind die durchschnittlichen Werte für Prozessdurchläufe für 1, 3, 5 Minuten.
Das bedeutet, dass da ein Prozess, mehrere Prozesse auf CPU Zeit warten, das ist noch kein Indiz, dass Dein System ein Problem hat, da es ja nur eine Momentaufnahme zeigt. Wenn man das über längere Zeit beobachtet und derLoadgleich bleibt, dann kann man anfangen zu suchen, welcher Prozess da immer wieder die ihm zugestandene Zeit der CPU aufbraucht.
Ich gehe mal stark davon aus, dass Du nicht am Kernel Scheduler geschraubt hast und das so nutzt wie von der Installation/Distribution vorgesehen war/ist.
Eine bekannte Einflussgröße ist der I/O, da gibt esDisk I/O,Netzwerk I/O, wenn dort Prozesse notgedrungen Zeit verbraten, dann kann es zu so einemload averagekommen.
Eine langsameSD-Karte, schlechtes Netzwerk fürSMB/NFS, da gibt es einiges, das man untersuchen müsste.Hier einfach nur
top/htopWerte zu posten, ohne das genaue Environment zu kennen ist zwar interessant, aber auch nicht wirklich aussagekräftig.Zur Einschätzung, meiner obigen Aussage, dass ganze Thema ist, sehr viel komplizierter und man sollte sich nicht immer gleich ganz kirre machen lassen, am besten ist es sein System gut zu Monitoren, entweder durch geeignete Monitoring Tools, oder halt zu Fuß, mit
top/htopin einem parallel geöffneten Terminalfenster, während der Zeit wo man am System arbeitet.VG
Bernd -
@wolfgangfb sagte in Load average IO-Broker auf Raspberry 4 (8GB):
load average: 1,34, 1,62, 1,85
Moin,
nur um das zu präzisieren, das sind die durchschnittlichen Werte für Prozessdurchläufe für 1, 3, 5 Minuten.
Das bedeutet, dass da ein Prozess, mehrere Prozesse auf CPU Zeit warten, das ist noch kein Indiz, dass Dein System ein Problem hat, da es ja nur eine Momentaufnahme zeigt. Wenn man das über längere Zeit beobachtet und derLoadgleich bleibt, dann kann man anfangen zu suchen, welcher Prozess da immer wieder die ihm zugestandene Zeit der CPU aufbraucht.
Ich gehe mal stark davon aus, dass Du nicht am Kernel Scheduler geschraubt hast und das so nutzt wie von der Installation/Distribution vorgesehen war/ist.
Eine bekannte Einflussgröße ist der I/O, da gibt esDisk I/O,Netzwerk I/O, wenn dort Prozesse notgedrungen Zeit verbraten, dann kann es zu so einemload averagekommen.
Eine langsameSD-Karte, schlechtes Netzwerk fürSMB/NFS, da gibt es einiges, das man untersuchen müsste.Hier einfach nur
top/htopWerte zu posten, ohne das genaue Environment zu kennen ist zwar interessant, aber auch nicht wirklich aussagekräftig.Zur Einschätzung, meiner obigen Aussage, dass ganze Thema ist, sehr viel komplizierter und man sollte sich nicht immer gleich ganz kirre machen lassen, am besten ist es sein System gut zu Monitoren, entweder durch geeignete Monitoring Tools, oder halt zu Fuß, mit
top/htopin einem parallel geöffneten Terminalfenster, während der Zeit wo man am System arbeitet.VG
Bernd@dp20eic sagte in Load average IO-Broker auf Raspberry 4 (8GB):
Eine bekannte Einflussgröße ist der I/O,
Da habe ich schon eine Vermutung.
Wenn top keine erhöhte %CPU zeigt, müsste man dort weitersuchen
-
@homoran sagte in Load average IO-Broker auf Raspberry 4 (8GB):
@wolfgangfb sagte in Load average IO-Broker auf Raspberry 4 (8GB):
Als ersten verdächtige ich History und ECharts
du brauchst niemanden zu verdächtigen, du musst dir nur den Rest von top ansehen (nach %cpu sortiert) und uns zeigen.
OK, hier ist top nachdem ich echarts wieder gestartet habe und 5 Temperatursensoren hinzugefügt habe.
Für mich auffällig sind die vielen node Prozesse die oftmals als Zombie gelistet sind.
Allerdings steckt in der load avarage mehr als die CPU-Auslastung.
bitte
iob diagin der Langfassung.OK, der erste Versuch hat den Raspi komplett zum Absturz gebracht, harter Neustart war notwendig.
Nach dem Neustart war das System erstmaal extrem langsam. Dann habe ich, um ähnliche Voraussetzungen zu schaffen, wieder in Echarts ein paar Temperatursensoren aufgenommen. Das Ergebnis von Top sieht sehr ähnlich aus (wieder mit vielen Zombies)pi@raspberrypi205:/opt/iobroker/Wolfgang $ top top - 14:21:26 up 23 min, 3 users, load average: 12,95, 7,27, 5,62 Tasks: 256 total, 20 running, 220 sleeping, 0 stopped, 16 zombie %CPU(s): 75,5 us, 23,1 sy, 0,0 ni, 0,0 id, 0,0 wa, 0,0 hi, 1,4 si, 0,0 st MiB Spch: 7811,2 total, 5242,8 free, 1843,7 used, 882,7 buff/cache MiB Swap: 100,0 total, 100,0 free, 0,0 used. 5967,5 avail Spch PID USER PR NI VIRT RES SHR S %CPU %MEM ZEIT+ BEFEHL 817 iobroker 20 0 5341812 291076 38228 R 18,2 3,6 3:29.28 iobroker.js-con 1536 iobroker 20 0 756864 93444 36728 R 15,5 1,2 0:45.69 io.history.0 1747 iobroker 20 0 792560 145732 36904 S 10,9 1,8 2:03.14 io.shelly.0 2084 iobroker 20 0 1058628 188620 43228 S 10,9 2,4 0:45.81 io.admin.0 2159 iobroker 20 0 5162456 105900 39424 S 8,9 1,3 1:08.52 io.esphome.0 11539 iobroker 20 0 0 0 0 Z 8,3 0,0 0:00.25 node 11569 iobroker 20 0 0 0 0 Z 7,9 0,0 0:00.24 node 11519 iobroker 20 0 0 0 0 Z 7,6 0,0 0:00.23 node 11577 iobroker 20 0 0 0 0 Z 7,6 0,0 0:00.23 node 11678 iobroker 20 0 530184 44096 32540 S 7,6 0,6 0:00.23 node 11511 iobroker 20 0 0 0 0 Z 7,3 0,0 0:00.24 node 11533 iobroker 20 0 0 0 0 Z 7,3 0,0 0:00.22 node 11681 iobroker 20 0 530216 43756 32532 S 7,3 0,5 0:00.22 node 11689 iobroker 20 0 530180 43820 32524 S 7,3 0,5 0:00.22 node 11525 iobroker 20 0 0 0 0 Z 6,9 0,0 0:00.21 node 11585 iobroker 20 0 332572 42652 31836 S 6,9 0,5 0:00.21 node 11590 iobroker 20 0 332560 42652 31852 S 6,9 0,5 0:00.21 node 11604 iobroker 20 0 332552 43536 32540 S 6,9 0,5 0:00.21 node 11683 iobroker 20 0 332560 43556 32540 R 6,9 0,5 0:00.21 node 11704 iobroker 20 0 595748 44116 32540 S 6,9 0,6 0:00.21 node 11505 iobroker 20 0 0 0 0 Z 6,6 0,0 0:00.22 node 11568 iobroker 20 0 332552 42644 31852 S 6,6 0,5 0:00.20 node 11570 iobroker 20 0 332552 42644 31852 S 6,6 0,5 0:00.20 nodeJetzt zum iob diag
Skript v.2023-10-10 *** BASE SYSTEM *** Static hostname: raspberrypi205 Icon name: computer Operating System: Debian GNU/Linux 12 (bookworm) Kernel: Linux 6.1.0-rpi4-rpi-v8 Architecture: arm64 Model : Raspberry Pi 4 Model B Rev 1.5 Docker : false Virtualization : none Kernel : aarch64 Userland : arm64 Systemuptime and Load: 14:24:16 up 26 min, 4 users, load average: 20.99, 13.41, 8.26 CPU threads: 4 *** RASPBERRY THROTTLING *** Current issues: No throttling issues detected. Previously detected issues: No throttling issues detected. *** Time and Time Zones *** Local time: Sun 2023-11-05 14:24:17 CET Universal time: Sun 2023-11-05 13:24:17 UTC RTC time: n/a Time zone: Europe/Berlin (CET, +0100) System clock synchronized: yes NTP service: active RTC in local TZ: no *** User and Groups *** pi /home/pi pi adm dialout cdrom sudo audio video plugdev games users input render netdev lpadmin gpio i2c spi iobroker *** X-Server-Setup *** X-Server: false Desktop: Terminal: tty Boot Target: graphical.target *** MEMORY *** total used free shared buff/cache available Mem: 8.2G 2.1G 5.3G 40M 928M 6.0G Swap: 104M 0B 104M Total: 8.3G 2.1G 5.4G 7811 M total memory 2045 M used memory 2117 M active memory 458 M inactive memory 5037 M free memory 46 M buffer memory 839 M swap cache 99 M total swap 0 M used swap 99 M free swap Raspberry only: oom events: 0 lifetime oom required: 0 Mbytes total time in oom handler: 0 ms max time spent in oom handler: 0 ms *** FAILED SERVICES *** UNIT LOAD ACTIVE SUB DESCRIPTION 0 loaded units listed. *** FILESYSTEM *** Filesystem Type Size Used Avail Use% Mounted on udev devtmpfs 3.6G 0 3.6G 0% /dev tmpfs tmpfs 782M 3.1M 779M 1% /run /dev/mmcblk0p2 ext4 29G 7.1G 20G 27% / tmpfs tmpfs 3.9G 216K 3.9G 1% /dev/shm tmpfs tmpfs 5.0M 16K 5.0M 1% /run/lock /dev/mmcblk0p1 vfat 510M 73M 438M 15% /boot/firmware tmpfs tmpfs 782M 36K 782M 1% /run/user/1000 Messages concerning ext4 filesystem in dmesg: [Sun Nov 5 13:57:49 2023] Kernel command line: coherent_pool=1M 8250.nr_uarts=0 snd_bcm2835.enable_headphones=0 snd_bcm2835.enable_headphones=1 snd_bcm2835.enable_hdmi=1 snd_bcm2835.enable_hdmi=0 smsc95xx.macaddr=D8:3A:DD:66:20:22 vc_mem.mem_base=0x3ec00000 vc_mem.mem_size=0x40000000 console=ttyS0,115200 console=tty1 root=PARTUUID=06347f7d-02 rootfstype=ext4 fsck.repair=yes rootwait quiet splash plymouth.ignore-serial-consoles cfg80211.ieee80211_regdom=DE [Sun Nov 5 13:59:01 2023] EXT4-fs (mmcblk0p2): mounted filesystem with ordered data mode. Quota mode: none. [Sun Nov 5 13:59:05 2023] EXT4-fs (mmcblk0p2): re-mounted. Quota mode: none. Show mounted filesystems \(real ones only\): TARGET SOURCE FSTYPE OPTIONS / /dev/mmcblk0p2 ext4 rw,noatime |-/run/user/1000/doc portal fuse.portal rw,nosuid,nodev,relatime,user_id=1000,group_id=1000 `-/boot/firmware /dev/mmcblk0p1 vfat rw,relatime,fmask=0022,dmask=0022,codepage=437,iocharset=ascii,shortname=mixed,errors=remount-ro Files in neuralgic directories: /var: 674M /var/ 299M /var/cache 293M /var/cache/apt 201M /var/lib 180M /var/cache/apt/archives Archived and active journals take up 56.0M in the file system. /opt/iobroker/backups: 49M /opt/iobroker/backups/ /opt/iobroker/iobroker-data: du: cannot read directory '/opt/iobroker/iobroker-data/esphome.0/.esphome/build/galerie-dallas/.piolibdeps/galerie-dallas/ESPAsyncTCP-esphome': Permission denied du: cannot read directory '/opt/iobroker/iobroker-data/esphome.0/.esphome/build/galerie-dallas/.piolibdeps/galerie-dallas/ESPAsyncTCP-esphome@1.2.3': Permission denied du: cannot read directory '/opt/iobroker/iobroker-data/esphome.0/.esphome/build/galerie-dallas/.piolibdeps/galerie-dallas/ESPAsyncWebServer-esphome': Permission denied du: cannot read directory '/opt/iobroker/iobroker-data/esphome.0/.esphome/build/galerie-dallas/.piolibdeps/galerie-dallas/ArduinoJson': Permission denied 391M /opt/iobroker/iobroker-data/ 272M /opt/iobroker/iobroker-data/files 90M /opt/iobroker/iobroker-data/files/echarts.admin 73M /opt/iobroker/iobroker-data/backup-objects 58M /opt/iobroker/iobroker-data/files/echarts The five largest files in iobroker-data are: find: '/opt/iobroker/iobroker-data/esphome.0/.esphome/build/galerie-dallas/.piolibdeps/galerie-dallas/ESPAsyncTCP-esphome': Permission denied find: '/opt/iobroker/iobroker-data/esphome.0/.esphome/build/galerie-dallas/.piolibdeps/galerie-dallas/ESPAsyncTCP-esphome@1.2.3': Permission denied find: '/opt/iobroker/iobroker-data/esphome.0/.esphome/build/galerie-dallas/.piolibdeps/galerie-dallas/ESPAsyncWebServer-esphome': Permission denied find: '/opt/iobroker/iobroker-data/esphome.0/.esphome/build/galerie-dallas/.piolibdeps/galerie-dallas/ArduinoJson': Permission denied 24M /opt/iobroker/iobroker-data/files/echarts/static/js/main.5f66c5d9.js.map 24M /opt/iobroker/iobroker-data/files/echarts.admin/static/js/main.9f2a6569.js.map 24M /opt/iobroker/iobroker-data/files/echarts.admin/chart/static/js/main.5f66c5d9.js.map 23M /opt/iobroker/iobroker-data/objects.jsonl 21M /opt/iobroker/iobroker-data/files/web.admin/static/js/main.aaea95f8.js.map USB-Devices by-id: USB-Sticks - Avoid direct links to /dev/* in your adapter setups, please always prefer the links 'by-id': find: '/dev/serial/by-id/': No such file or directory *** NodeJS-Installation *** /usr/bin/nodejs v18.18.2 /usr/bin/node v18.18.2 /usr/bin/npm 9.8.1 /usr/bin/npx 9.8.1 /usr/bin/corepack 0.19.0 nodejs: Installed: 18.18.2-1nodesource1 Candidate: 18.18.2-1nodesource1 Version table: *** 18.18.2-1nodesource1 500 500 https://deb.nodesource.com/node_18.x nodistro/main arm64 Packages 100 /var/lib/dpkg/status 18.18.1-1nodesource1 500 500 https://deb.nodesource.com/node_18.x nodistro/main arm64 Packages 18.18.0-1nodesource1 500 500 https://deb.nodesource.com/node_18.x nodistro/main arm64 Packages 18.17.1-1nodesource1 500 500 https://deb.nodesource.com/node_18.x nodistro/main arm64 Packages 18.17.0-1nodesource1 500 500 https://deb.nodesource.com/node_18.x nodistro/main arm64 Packages 18.16.1-1nodesource1 500 500 https://deb.nodesource.com/node_18.x nodistro/main arm64 Packages 18.16.0-1nodesource1 500 500 https://deb.nodesource.com/node_18.x nodistro/main arm64 Packages 18.15.0-1nodesource1 500 500 https://deb.nodesource.com/node_18.x nodistro/main arm64 Packages 18.14.2-1nodesource1 500 500 https://deb.nodesource.com/node_18.x nodistro/main arm64 Packages 18.14.1-1nodesource1 500 500 https://deb.nodesource.com/node_18.x nodistro/main arm64 Packages 18.14.0-1nodesource1 500 500 https://deb.nodesource.com/node_18.x nodistro/main arm64 Packages 18.13.0+dfsg1-1 500 500 http://deb.debian.org/debian bookworm/main arm64 Packages 18.13.0-1nodesource1 500 500 https://deb.nodesource.com/node_18.x nodistro/main arm64 Packages 18.12.0-1nodesource1 500 500 https://deb.nodesource.com/node_18.x nodistro/main arm64 Packages 18.11.0-1nodesource1 500 500 https://deb.nodesource.com/node_18.x nodistro/main arm64 Packages 18.10.0-1nodesource1 500 500 https://deb.nodesource.com/node_18.x nodistro/main arm64 Packages 18.9.1-1nodesource1 500 500 https://deb.nodesource.com/node_18.x nodistro/main arm64 Packages 18.9.0-1nodesource1 500 500 https://deb.nodesource.com/node_18.x nodistro/main arm64 Packages 18.8.0-1nodesource1 500 500 https://deb.nodesource.com/node_18.x nodistro/main arm64 Packages 18.7.0-1nodesource1 500 500 https://deb.nodesource.com/node_18.x nodistro/main arm64 Packages 18.6.0-1nodesource1 500 500 https://deb.nodesource.com/node_18.x nodistro/main arm64 Packages 18.5.0-1nodesource1 500 500 https://deb.nodesource.com/node_18.x nodistro/main arm64 Packages 18.4.0-1nodesource1 500 500 https://deb.nodesource.com/node_18.x nodistro/main arm64 Packages 18.3.0-1nodesource1 500 500 https://deb.nodesource.com/node_18.x nodistro/main arm64 Packages 18.2.0-1nodesource1 500 500 https://deb.nodesource.com/node_18.x nodistro/main arm64 Packages 18.1.0-1nodesource1 500 500 https://deb.nodesource.com/node_18.x nodistro/main arm64 Packages 18.0.0-1nodesource1 500 500 https://deb.nodesource.com/node_18.x nodistro/main arm64 Packages Temp directories causing npm8 problem: 0 No problems detected Errors in npm tree: *** ioBroker-Installation *** ioBroker Status iobroker is running on this host. Objects type: jsonl States type: jsonl Core adapters versions js-controller: 5.0.12 admin: 6.10.1 javascript: 7.1.4 Adapters from github: 1 Adapter State + system.adapter.admin.0 : admin : raspberrypi205 - enabled, port: 8081, bind: 0.0.0.0, run as: admin + system.adapter.backitup.0 : backitup : raspberrypi205 - enabled + system.adapter.discovery.0 : discovery : raspberrypi205 - enabled + system.adapter.echarts.0 : echarts : raspberrypi205 - enabled + system.adapter.esphome.0 : esphome : raspberrypi205 - enabled + system.adapter.history.0 : history : raspberrypi205 - enabled + system.adapter.javascript.0 : javascript : raspberrypi205 - enabled + system.adapter.onkyo.0 : onkyo : raspberrypi205 - enabled + system.adapter.shelly.0 : shelly : raspberrypi205 - enabled, port: 1882, bind: 0.0.0.0 + system.adapter.tankerkoenig.0 : tankerkoenig : raspberrypi205 - enabled system.adapter.telegram.0 : telegram : raspberrypi205 - disabled, port: 8443, bind: 0.0.0.0 system.adapter.vis-history.0 : vis-history : raspberrypi205 - enabled + system.adapter.vis-inventwo.0 : vis-inventwo : raspberrypi205 - enabled system.adapter.vis.0 : vis : raspberrypi205 - enabled + system.adapter.web.0 : web : raspberrypi205 - enabled, port: 8082, bind: 0.0.0.0, run as: admin + instance is alive Enabled adapters with bindings + system.adapter.admin.0 : admin : raspberrypi205 - enabled, port: 8081, bind: 0.0.0.0, run as: admin + system.adapter.shelly.0 : shelly : raspberrypi205 - enabled, port: 1882, bind: 0.0.0.0 + system.adapter.web.0 : web : raspberrypi205 - enabled, port: 8082, bind: 0.0.0.0, run as: admin ioBroker-Repositories stable : http://download.iobroker.net/sources-dist.json beta : http://download.iobroker.net/sources-dist-latest.json Active repo(s): stable Installed ioBroker-Instances Used repository: stable Adapter "admin" : 6.12.0 , installed 6.10.1 [Updatable] Adapter "backitup" : 2.8.7 , installed 2.8.1 [Updatable] Adapter "discovery" : 3.1.0 , installed 3.1.0 Adapter "echarts" : 1.5.1 , installed 1.5.4 Adapter "history" : 3.0.1 , installed 3.0.1 Adapter "javascript" : 7.1.4 , installed 7.1.4 Controller "js-controller": 5.0.12 , installed 5.0.12 Adapter "onkyo" : 2.1.2 , installed 2.1.2 Adapter "shelly" : 6.4.5 , installed 6.4.5 Adapter "simple-api" : 2.7.2 , installed 2.7.2 Adapter "socketio" : 6.5.5 , installed 6.6.0 Adapter "tankerkoenig" : 3.3.7 , installed 3.3.7 Adapter "telegram" : 1.16.0 , installed 2.0.1 Adapter "vis" : 1.4.16 , installed 1.4.16 Adapter "vis-history" : 1.0.0 , installed 1.0.0 Adapter "vis-inventwo" : 3.3.3 , installed 3.3.3 Adapter "web" : 6.1.4 , installed 6.1.10 Adapter "ws" : 2.5.5 , installed 2.5.8 Objects and States Please stand by - This may take a while Objects: 5467 States: 3546 *** OS-Repositories and Updates *** Hit:1 http://deb.debian.org/debian bookworm InRelease Hit:2 http://archive.raspberrypi.com/debian bookworm InRelease Hit:3 http://deb.debian.org/debian-security bookworm-security InRelease Hit:4 http://deb.debian.org/debian bookworm-updates InRelease Hit:5 https://deb.nodesource.com/node_18.x nodistro InRelease Reading package lists... Pending Updates: 1 *** Listening Ports *** Active Internet connections (only servers) Proto Recv-Q Send-Q Local Address Foreign Address State User Inode PID/Program name tcp 0 0 127.0.0.1:9000 0.0.0.0:* LISTEN 1001 18751 817/iobroker.js-con tcp 0 0 127.0.0.1:9001 0.0.0.0:* LISTEN 1001 19596 817/iobroker.js-con tcp 0 0 127.0.0.1:631 0.0.0.0:* LISTEN 0 16158 816/cupsd tcp 0 0 127.0.0.1:1883 0.0.0.0:* LISTEN 112 17769 827/mosquitto tcp 0 0 0.0.0.0:6052 0.0.0.0:* LISTEN 1001 24837 2302/python3 tcp 0 0 0.0.0.0:445 0.0.0.0:* LISTEN 0 18015 1078/smbd tcp 0 0 0.0.0.0:22 0.0.0.0:* LISTEN 0 16571 837/sshd: /usr/sbin tcp 0 0 0.0.0.0:139 0.0.0.0:* LISTEN 0 18016 1078/smbd tcp6 0 0 :::8081 :::* LISTEN 1001 22270 2084/io.admin.0 tcp6 0 0 :::8082 :::* LISTEN 1001 22272 2145/io.web.0 tcp6 0 0 ::1:1883 :::* LISTEN 112 17770 827/mosquitto tcp6 0 0 ::1:631 :::* LISTEN 0 16157 816/cupsd tcp6 0 0 :::445 :::* LISTEN 0 18013 1078/smbd tcp6 0 0 :::22 :::* LISTEN 0 16582 837/sshd: /usr/sbin tcp6 0 0 :::139 :::* LISTEN 0 18014 1078/smbd udp 2752 0 0.0.0.0:5683 0.0.0.0:* 1001 19404 1747/io.shelly.0 udp 2752 0 0.0.0.0:34538 0.0.0.0:* 1001 104439 - udp 0 0 192.168.1.255:137 0.0.0.0:* 0 16338 987/nmbd udp 0 0 192.168.1.205:137 0.0.0.0:* 0 16337 987/nmbd udp 0 0 0.0.0.0:137 0.0.0.0:* 0 16322 987/nmbd udp 0 0 192.168.1.255:138 0.0.0.0:* 0 16340 987/nmbd udp 0 0 192.168.1.205:138 0.0.0.0:* 0 16339 987/nmbd udp 0 0 0.0.0.0:138 0.0.0.0:* 0 16323 987/nmbd udp 0 0 0.0.0.0:631 0.0.0.0:* 0 16644 911/cups-browsed udp 0 0 0.0.0.0:46044 0.0.0.0:* 104 16419 582/avahi-daemon: r udp 0 0 127.0.0.1:5353 0.0.0.0:* 1001 23207 2302/python3 udp 0 0 192.168.1.205:5353 0.0.0.0:* 1001 23206 2302/python3 udp 0 0 0.0.0.0:5353 0.0.0.0:* 1001 23202 2302/python3 udp 0 0 0.0.0.0:5353 0.0.0.0:* 1001 22903 2159/io.esphome.0 udp 0 0 0.0.0.0:5353 0.0.0.0:* 104 16417 582/avahi-daemon: r udp6 0 0 :::53054 :::* 104 16420 582/avahi-daemon: r udp6 0 0 :::5353 :::* 104 16418 582/avahi-daemon: r *** Log File - Last 25 Lines *** 2023-11-05 14:25:58.667 - error: esphome.0 (2159) ESPHome client 192.168.1.79 Error: Bad format: Encryption expected 2023-11-05 14:25:58.668 - warn: esphome.0 (2159) Client 192.168.1.79 Connection Lost, will reconnect automatically when device is available! 2023-11-05 14:26:03.660 - warn: esphome.0 (2159) Client 192.168.1.79 Timeout, connection Lost, will reconnect automatically when device is available! 2023-11-05 14:26:24.996 - error: esphome.0 (2159) [dashboardProcess ERROR] 2023-11-05 14:26:28.689 - error: esphome.0 (2159) ESPHome client 192.168.1.79 Error: Bad format: Encryption expected 2023-11-05 14:26:28.692 - warn: esphome.0 (2159) Client 192.168.1.79 Connection Lost, will reconnect automatically when device is available! 2023-11-05 14:26:33.676 - warn: esphome.0 (2159) Client 192.168.1.79 Timeout, connection Lost, will reconnect automatically when device is available! 2023-11-05 14:26:39.997 - error: esphome.0 (2159) [dashboardProcess ERROR] 2023-11-05 14:26:50.001 - error: esphome.0 (2159) [dashboardProcess ERROR] 2023-11-05 14:26:51.622 - warn: esphome.0 (2159) ESPHome client sauna disconnected 2023-11-05 14:26:55.000 - error: esphome.0 (2159) [dashboardProcess ERROR] 2023-11-05 14:26:58.730 - error: esphome.0 (2159) ESPHome client 192.168.1.79 Error: Bad format: Encryption expected 2023-11-05 14:27:03.699 - warn: esphome.0 (2159) Client 192.168.1.79 Timeout, connection Lost, will reconnect automatically when device is available! 2023-11-05 14:27:21.628 - error: esphome.0 (2159) ESPHome client 192.168.1.73 Error: connect ECONNREFUSED 192.168.1.73:6053 2023-11-05 14:27:28.779 - error: esphome.0 (2159) ESPHome client 192.168.1.79 Error: Bad format: Encryption expected 2023-11-05 14:27:28.780 - warn: esphome.0 (2159) Client 192.168.1.79 Connection Lost, will reconnect automatically when device is available! 2023-11-05 14:27:33.738 - warn: esphome.0 (2159) Client 192.168.1.79 Timeout, connection Lost, will reconnect automatically when device is available! 2023-11-05 14:27:51.634 - error: esphome.0 (2159) ESPHome client 192.168.1.73 Error: connect ECONNREFUSED 192.168.1.73:6053 2023-11-05 14:27:58.809 - error: esphome.0 (2159) ESPHome client 192.168.1.79 Error: Bad format: Encryption expected 2023-11-05 14:27:58.814 - warn: esphome.0 (2159) Client 192.168.1.79 Connection Lost, will reconnect automatically when device is available! 2023-11-05 14:28:03.791 - warn: esphome.0 (2159) Client 192.168.1.79 Timeout, connection Lost, will reconnect automatically when device is available! ============ Mark until here for C&P ============= iob diag has finished. Press any key for a summary -
@homoran sagte in Load average IO-Broker auf Raspberry 4 (8GB):
@wolfgangfb sagte in Load average IO-Broker auf Raspberry 4 (8GB):
Als ersten verdächtige ich History und ECharts
du brauchst niemanden zu verdächtigen, du musst dir nur den Rest von top ansehen (nach %cpu sortiert) und uns zeigen.
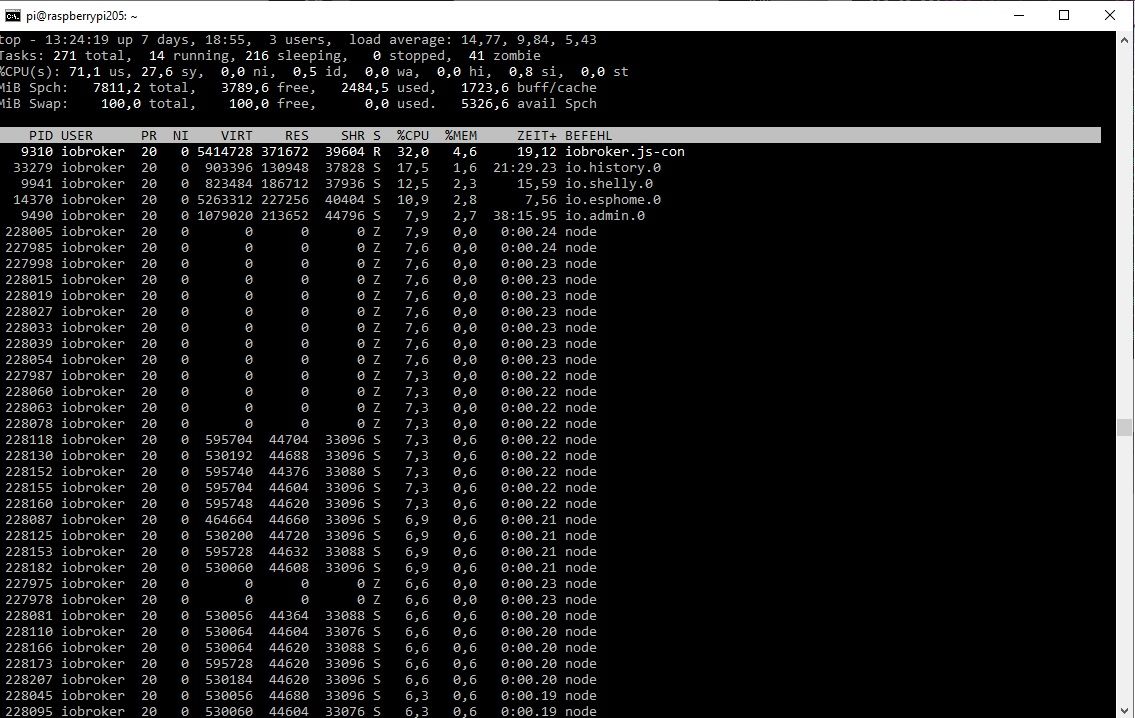
OK, hier ist top nachdem ich echarts wieder gestartet habe und 5 Temperatursensoren hinzugefügt habe.
Für mich auffällig sind die vielen node Prozesse die oftmals als Zombie gelistet sind.
Allerdings steckt in der load avarage mehr als die CPU-Auslastung.
bitte
iob diagin der Langfassung.OK, der erste Versuch hat den Raspi komplett zum Absturz gebracht, harter Neustart war notwendig.
Nach dem Neustart war das System erstmaal extrem langsam. Dann habe ich, um ähnliche Voraussetzungen zu schaffen, wieder in Echarts ein paar Temperatursensoren aufgenommen. Das Ergebnis von Top sieht sehr ähnlich aus (wieder mit vielen Zombies)pi@raspberrypi205:/opt/iobroker/Wolfgang $ top top - 14:21:26 up 23 min, 3 users, load average: 12,95, 7,27, 5,62 Tasks: 256 total, 20 running, 220 sleeping, 0 stopped, 16 zombie %CPU(s): 75,5 us, 23,1 sy, 0,0 ni, 0,0 id, 0,0 wa, 0,0 hi, 1,4 si, 0,0 st MiB Spch: 7811,2 total, 5242,8 free, 1843,7 used, 882,7 buff/cache MiB Swap: 100,0 total, 100,0 free, 0,0 used. 5967,5 avail Spch PID USER PR NI VIRT RES SHR S %CPU %MEM ZEIT+ BEFEHL 817 iobroker 20 0 5341812 291076 38228 R 18,2 3,6 3:29.28 iobroker.js-con 1536 iobroker 20 0 756864 93444 36728 R 15,5 1,2 0:45.69 io.history.0 1747 iobroker 20 0 792560 145732 36904 S 10,9 1,8 2:03.14 io.shelly.0 2084 iobroker 20 0 1058628 188620 43228 S 10,9 2,4 0:45.81 io.admin.0 2159 iobroker 20 0 5162456 105900 39424 S 8,9 1,3 1:08.52 io.esphome.0 11539 iobroker 20 0 0 0 0 Z 8,3 0,0 0:00.25 node 11569 iobroker 20 0 0 0 0 Z 7,9 0,0 0:00.24 node 11519 iobroker 20 0 0 0 0 Z 7,6 0,0 0:00.23 node 11577 iobroker 20 0 0 0 0 Z 7,6 0,0 0:00.23 node 11678 iobroker 20 0 530184 44096 32540 S 7,6 0,6 0:00.23 node 11511 iobroker 20 0 0 0 0 Z 7,3 0,0 0:00.24 node 11533 iobroker 20 0 0 0 0 Z 7,3 0,0 0:00.22 node 11681 iobroker 20 0 530216 43756 32532 S 7,3 0,5 0:00.22 node 11689 iobroker 20 0 530180 43820 32524 S 7,3 0,5 0:00.22 node 11525 iobroker 20 0 0 0 0 Z 6,9 0,0 0:00.21 node 11585 iobroker 20 0 332572 42652 31836 S 6,9 0,5 0:00.21 node 11590 iobroker 20 0 332560 42652 31852 S 6,9 0,5 0:00.21 node 11604 iobroker 20 0 332552 43536 32540 S 6,9 0,5 0:00.21 node 11683 iobroker 20 0 332560 43556 32540 R 6,9 0,5 0:00.21 node 11704 iobroker 20 0 595748 44116 32540 S 6,9 0,6 0:00.21 node 11505 iobroker 20 0 0 0 0 Z 6,6 0,0 0:00.22 node 11568 iobroker 20 0 332552 42644 31852 S 6,6 0,5 0:00.20 node 11570 iobroker 20 0 332552 42644 31852 S 6,6 0,5 0:00.20 nodeJetzt zum iob diag
Skript v.2023-10-10 *** BASE SYSTEM *** Static hostname: raspberrypi205 Icon name: computer Operating System: Debian GNU/Linux 12 (bookworm) Kernel: Linux 6.1.0-rpi4-rpi-v8 Architecture: arm64 Model : Raspberry Pi 4 Model B Rev 1.5 Docker : false Virtualization : none Kernel : aarch64 Userland : arm64 Systemuptime and Load: 14:24:16 up 26 min, 4 users, load average: 20.99, 13.41, 8.26 CPU threads: 4 *** RASPBERRY THROTTLING *** Current issues: No throttling issues detected. Previously detected issues: No throttling issues detected. *** Time and Time Zones *** Local time: Sun 2023-11-05 14:24:17 CET Universal time: Sun 2023-11-05 13:24:17 UTC RTC time: n/a Time zone: Europe/Berlin (CET, +0100) System clock synchronized: yes NTP service: active RTC in local TZ: no *** User and Groups *** pi /home/pi pi adm dialout cdrom sudo audio video plugdev games users input render netdev lpadmin gpio i2c spi iobroker *** X-Server-Setup *** X-Server: false Desktop: Terminal: tty Boot Target: graphical.target *** MEMORY *** total used free shared buff/cache available Mem: 8.2G 2.1G 5.3G 40M 928M 6.0G Swap: 104M 0B 104M Total: 8.3G 2.1G 5.4G 7811 M total memory 2045 M used memory 2117 M active memory 458 M inactive memory 5037 M free memory 46 M buffer memory 839 M swap cache 99 M total swap 0 M used swap 99 M free swap Raspberry only: oom events: 0 lifetime oom required: 0 Mbytes total time in oom handler: 0 ms max time spent in oom handler: 0 ms *** FAILED SERVICES *** UNIT LOAD ACTIVE SUB DESCRIPTION 0 loaded units listed. *** FILESYSTEM *** Filesystem Type Size Used Avail Use% Mounted on udev devtmpfs 3.6G 0 3.6G 0% /dev tmpfs tmpfs 782M 3.1M 779M 1% /run /dev/mmcblk0p2 ext4 29G 7.1G 20G 27% / tmpfs tmpfs 3.9G 216K 3.9G 1% /dev/shm tmpfs tmpfs 5.0M 16K 5.0M 1% /run/lock /dev/mmcblk0p1 vfat 510M 73M 438M 15% /boot/firmware tmpfs tmpfs 782M 36K 782M 1% /run/user/1000 Messages concerning ext4 filesystem in dmesg: [Sun Nov 5 13:57:49 2023] Kernel command line: coherent_pool=1M 8250.nr_uarts=0 snd_bcm2835.enable_headphones=0 snd_bcm2835.enable_headphones=1 snd_bcm2835.enable_hdmi=1 snd_bcm2835.enable_hdmi=0 smsc95xx.macaddr=D8:3A:DD:66:20:22 vc_mem.mem_base=0x3ec00000 vc_mem.mem_size=0x40000000 console=ttyS0,115200 console=tty1 root=PARTUUID=06347f7d-02 rootfstype=ext4 fsck.repair=yes rootwait quiet splash plymouth.ignore-serial-consoles cfg80211.ieee80211_regdom=DE [Sun Nov 5 13:59:01 2023] EXT4-fs (mmcblk0p2): mounted filesystem with ordered data mode. Quota mode: none. [Sun Nov 5 13:59:05 2023] EXT4-fs (mmcblk0p2): re-mounted. Quota mode: none. Show mounted filesystems \(real ones only\): TARGET SOURCE FSTYPE OPTIONS / /dev/mmcblk0p2 ext4 rw,noatime |-/run/user/1000/doc portal fuse.portal rw,nosuid,nodev,relatime,user_id=1000,group_id=1000 `-/boot/firmware /dev/mmcblk0p1 vfat rw,relatime,fmask=0022,dmask=0022,codepage=437,iocharset=ascii,shortname=mixed,errors=remount-ro Files in neuralgic directories: /var: 674M /var/ 299M /var/cache 293M /var/cache/apt 201M /var/lib 180M /var/cache/apt/archives Archived and active journals take up 56.0M in the file system. /opt/iobroker/backups: 49M /opt/iobroker/backups/ /opt/iobroker/iobroker-data: du: cannot read directory '/opt/iobroker/iobroker-data/esphome.0/.esphome/build/galerie-dallas/.piolibdeps/galerie-dallas/ESPAsyncTCP-esphome': Permission denied du: cannot read directory '/opt/iobroker/iobroker-data/esphome.0/.esphome/build/galerie-dallas/.piolibdeps/galerie-dallas/ESPAsyncTCP-esphome@1.2.3': Permission denied du: cannot read directory '/opt/iobroker/iobroker-data/esphome.0/.esphome/build/galerie-dallas/.piolibdeps/galerie-dallas/ESPAsyncWebServer-esphome': Permission denied du: cannot read directory '/opt/iobroker/iobroker-data/esphome.0/.esphome/build/galerie-dallas/.piolibdeps/galerie-dallas/ArduinoJson': Permission denied 391M /opt/iobroker/iobroker-data/ 272M /opt/iobroker/iobroker-data/files 90M /opt/iobroker/iobroker-data/files/echarts.admin 73M /opt/iobroker/iobroker-data/backup-objects 58M /opt/iobroker/iobroker-data/files/echarts The five largest files in iobroker-data are: find: '/opt/iobroker/iobroker-data/esphome.0/.esphome/build/galerie-dallas/.piolibdeps/galerie-dallas/ESPAsyncTCP-esphome': Permission denied find: '/opt/iobroker/iobroker-data/esphome.0/.esphome/build/galerie-dallas/.piolibdeps/galerie-dallas/ESPAsyncTCP-esphome@1.2.3': Permission denied find: '/opt/iobroker/iobroker-data/esphome.0/.esphome/build/galerie-dallas/.piolibdeps/galerie-dallas/ESPAsyncWebServer-esphome': Permission denied find: '/opt/iobroker/iobroker-data/esphome.0/.esphome/build/galerie-dallas/.piolibdeps/galerie-dallas/ArduinoJson': Permission denied 24M /opt/iobroker/iobroker-data/files/echarts/static/js/main.5f66c5d9.js.map 24M /opt/iobroker/iobroker-data/files/echarts.admin/static/js/main.9f2a6569.js.map 24M /opt/iobroker/iobroker-data/files/echarts.admin/chart/static/js/main.5f66c5d9.js.map 23M /opt/iobroker/iobroker-data/objects.jsonl 21M /opt/iobroker/iobroker-data/files/web.admin/static/js/main.aaea95f8.js.map USB-Devices by-id: USB-Sticks - Avoid direct links to /dev/* in your adapter setups, please always prefer the links 'by-id': find: '/dev/serial/by-id/': No such file or directory *** NodeJS-Installation *** /usr/bin/nodejs v18.18.2 /usr/bin/node v18.18.2 /usr/bin/npm 9.8.1 /usr/bin/npx 9.8.1 /usr/bin/corepack 0.19.0 nodejs: Installed: 18.18.2-1nodesource1 Candidate: 18.18.2-1nodesource1 Version table: *** 18.18.2-1nodesource1 500 500 https://deb.nodesource.com/node_18.x nodistro/main arm64 Packages 100 /var/lib/dpkg/status 18.18.1-1nodesource1 500 500 https://deb.nodesource.com/node_18.x nodistro/main arm64 Packages 18.18.0-1nodesource1 500 500 https://deb.nodesource.com/node_18.x nodistro/main arm64 Packages 18.17.1-1nodesource1 500 500 https://deb.nodesource.com/node_18.x nodistro/main arm64 Packages 18.17.0-1nodesource1 500 500 https://deb.nodesource.com/node_18.x nodistro/main arm64 Packages 18.16.1-1nodesource1 500 500 https://deb.nodesource.com/node_18.x nodistro/main arm64 Packages 18.16.0-1nodesource1 500 500 https://deb.nodesource.com/node_18.x nodistro/main arm64 Packages 18.15.0-1nodesource1 500 500 https://deb.nodesource.com/node_18.x nodistro/main arm64 Packages 18.14.2-1nodesource1 500 500 https://deb.nodesource.com/node_18.x nodistro/main arm64 Packages 18.14.1-1nodesource1 500 500 https://deb.nodesource.com/node_18.x nodistro/main arm64 Packages 18.14.0-1nodesource1 500 500 https://deb.nodesource.com/node_18.x nodistro/main arm64 Packages 18.13.0+dfsg1-1 500 500 http://deb.debian.org/debian bookworm/main arm64 Packages 18.13.0-1nodesource1 500 500 https://deb.nodesource.com/node_18.x nodistro/main arm64 Packages 18.12.0-1nodesource1 500 500 https://deb.nodesource.com/node_18.x nodistro/main arm64 Packages 18.11.0-1nodesource1 500 500 https://deb.nodesource.com/node_18.x nodistro/main arm64 Packages 18.10.0-1nodesource1 500 500 https://deb.nodesource.com/node_18.x nodistro/main arm64 Packages 18.9.1-1nodesource1 500 500 https://deb.nodesource.com/node_18.x nodistro/main arm64 Packages 18.9.0-1nodesource1 500 500 https://deb.nodesource.com/node_18.x nodistro/main arm64 Packages 18.8.0-1nodesource1 500 500 https://deb.nodesource.com/node_18.x nodistro/main arm64 Packages 18.7.0-1nodesource1 500 500 https://deb.nodesource.com/node_18.x nodistro/main arm64 Packages 18.6.0-1nodesource1 500 500 https://deb.nodesource.com/node_18.x nodistro/main arm64 Packages 18.5.0-1nodesource1 500 500 https://deb.nodesource.com/node_18.x nodistro/main arm64 Packages 18.4.0-1nodesource1 500 500 https://deb.nodesource.com/node_18.x nodistro/main arm64 Packages 18.3.0-1nodesource1 500 500 https://deb.nodesource.com/node_18.x nodistro/main arm64 Packages 18.2.0-1nodesource1 500 500 https://deb.nodesource.com/node_18.x nodistro/main arm64 Packages 18.1.0-1nodesource1 500 500 https://deb.nodesource.com/node_18.x nodistro/main arm64 Packages 18.0.0-1nodesource1 500 500 https://deb.nodesource.com/node_18.x nodistro/main arm64 Packages Temp directories causing npm8 problem: 0 No problems detected Errors in npm tree: *** ioBroker-Installation *** ioBroker Status iobroker is running on this host. Objects type: jsonl States type: jsonl Core adapters versions js-controller: 5.0.12 admin: 6.10.1 javascript: 7.1.4 Adapters from github: 1 Adapter State + system.adapter.admin.0 : admin : raspberrypi205 - enabled, port: 8081, bind: 0.0.0.0, run as: admin + system.adapter.backitup.0 : backitup : raspberrypi205 - enabled + system.adapter.discovery.0 : discovery : raspberrypi205 - enabled + system.adapter.echarts.0 : echarts : raspberrypi205 - enabled + system.adapter.esphome.0 : esphome : raspberrypi205 - enabled + system.adapter.history.0 : history : raspberrypi205 - enabled + system.adapter.javascript.0 : javascript : raspberrypi205 - enabled + system.adapter.onkyo.0 : onkyo : raspberrypi205 - enabled + system.adapter.shelly.0 : shelly : raspberrypi205 - enabled, port: 1882, bind: 0.0.0.0 + system.adapter.tankerkoenig.0 : tankerkoenig : raspberrypi205 - enabled system.adapter.telegram.0 : telegram : raspberrypi205 - disabled, port: 8443, bind: 0.0.0.0 system.adapter.vis-history.0 : vis-history : raspberrypi205 - enabled + system.adapter.vis-inventwo.0 : vis-inventwo : raspberrypi205 - enabled system.adapter.vis.0 : vis : raspberrypi205 - enabled + system.adapter.web.0 : web : raspberrypi205 - enabled, port: 8082, bind: 0.0.0.0, run as: admin + instance is alive Enabled adapters with bindings + system.adapter.admin.0 : admin : raspberrypi205 - enabled, port: 8081, bind: 0.0.0.0, run as: admin + system.adapter.shelly.0 : shelly : raspberrypi205 - enabled, port: 1882, bind: 0.0.0.0 + system.adapter.web.0 : web : raspberrypi205 - enabled, port: 8082, bind: 0.0.0.0, run as: admin ioBroker-Repositories stable : http://download.iobroker.net/sources-dist.json beta : http://download.iobroker.net/sources-dist-latest.json Active repo(s): stable Installed ioBroker-Instances Used repository: stable Adapter "admin" : 6.12.0 , installed 6.10.1 [Updatable] Adapter "backitup" : 2.8.7 , installed 2.8.1 [Updatable] Adapter "discovery" : 3.1.0 , installed 3.1.0 Adapter "echarts" : 1.5.1 , installed 1.5.4 Adapter "history" : 3.0.1 , installed 3.0.1 Adapter "javascript" : 7.1.4 , installed 7.1.4 Controller "js-controller": 5.0.12 , installed 5.0.12 Adapter "onkyo" : 2.1.2 , installed 2.1.2 Adapter "shelly" : 6.4.5 , installed 6.4.5 Adapter "simple-api" : 2.7.2 , installed 2.7.2 Adapter "socketio" : 6.5.5 , installed 6.6.0 Adapter "tankerkoenig" : 3.3.7 , installed 3.3.7 Adapter "telegram" : 1.16.0 , installed 2.0.1 Adapter "vis" : 1.4.16 , installed 1.4.16 Adapter "vis-history" : 1.0.0 , installed 1.0.0 Adapter "vis-inventwo" : 3.3.3 , installed 3.3.3 Adapter "web" : 6.1.4 , installed 6.1.10 Adapter "ws" : 2.5.5 , installed 2.5.8 Objects and States Please stand by - This may take a while Objects: 5467 States: 3546 *** OS-Repositories and Updates *** Hit:1 http://deb.debian.org/debian bookworm InRelease Hit:2 http://archive.raspberrypi.com/debian bookworm InRelease Hit:3 http://deb.debian.org/debian-security bookworm-security InRelease Hit:4 http://deb.debian.org/debian bookworm-updates InRelease Hit:5 https://deb.nodesource.com/node_18.x nodistro InRelease Reading package lists... Pending Updates: 1 *** Listening Ports *** Active Internet connections (only servers) Proto Recv-Q Send-Q Local Address Foreign Address State User Inode PID/Program name tcp 0 0 127.0.0.1:9000 0.0.0.0:* LISTEN 1001 18751 817/iobroker.js-con tcp 0 0 127.0.0.1:9001 0.0.0.0:* LISTEN 1001 19596 817/iobroker.js-con tcp 0 0 127.0.0.1:631 0.0.0.0:* LISTEN 0 16158 816/cupsd tcp 0 0 127.0.0.1:1883 0.0.0.0:* LISTEN 112 17769 827/mosquitto tcp 0 0 0.0.0.0:6052 0.0.0.0:* LISTEN 1001 24837 2302/python3 tcp 0 0 0.0.0.0:445 0.0.0.0:* LISTEN 0 18015 1078/smbd tcp 0 0 0.0.0.0:22 0.0.0.0:* LISTEN 0 16571 837/sshd: /usr/sbin tcp 0 0 0.0.0.0:139 0.0.0.0:* LISTEN 0 18016 1078/smbd tcp6 0 0 :::8081 :::* LISTEN 1001 22270 2084/io.admin.0 tcp6 0 0 :::8082 :::* LISTEN 1001 22272 2145/io.web.0 tcp6 0 0 ::1:1883 :::* LISTEN 112 17770 827/mosquitto tcp6 0 0 ::1:631 :::* LISTEN 0 16157 816/cupsd tcp6 0 0 :::445 :::* LISTEN 0 18013 1078/smbd tcp6 0 0 :::22 :::* LISTEN 0 16582 837/sshd: /usr/sbin tcp6 0 0 :::139 :::* LISTEN 0 18014 1078/smbd udp 2752 0 0.0.0.0:5683 0.0.0.0:* 1001 19404 1747/io.shelly.0 udp 2752 0 0.0.0.0:34538 0.0.0.0:* 1001 104439 - udp 0 0 192.168.1.255:137 0.0.0.0:* 0 16338 987/nmbd udp 0 0 192.168.1.205:137 0.0.0.0:* 0 16337 987/nmbd udp 0 0 0.0.0.0:137 0.0.0.0:* 0 16322 987/nmbd udp 0 0 192.168.1.255:138 0.0.0.0:* 0 16340 987/nmbd udp 0 0 192.168.1.205:138 0.0.0.0:* 0 16339 987/nmbd udp 0 0 0.0.0.0:138 0.0.0.0:* 0 16323 987/nmbd udp 0 0 0.0.0.0:631 0.0.0.0:* 0 16644 911/cups-browsed udp 0 0 0.0.0.0:46044 0.0.0.0:* 104 16419 582/avahi-daemon: r udp 0 0 127.0.0.1:5353 0.0.0.0:* 1001 23207 2302/python3 udp 0 0 192.168.1.205:5353 0.0.0.0:* 1001 23206 2302/python3 udp 0 0 0.0.0.0:5353 0.0.0.0:* 1001 23202 2302/python3 udp 0 0 0.0.0.0:5353 0.0.0.0:* 1001 22903 2159/io.esphome.0 udp 0 0 0.0.0.0:5353 0.0.0.0:* 104 16417 582/avahi-daemon: r udp6 0 0 :::53054 :::* 104 16420 582/avahi-daemon: r udp6 0 0 :::5353 :::* 104 16418 582/avahi-daemon: r *** Log File - Last 25 Lines *** 2023-11-05 14:25:58.667 - error: esphome.0 (2159) ESPHome client 192.168.1.79 Error: Bad format: Encryption expected 2023-11-05 14:25:58.668 - warn: esphome.0 (2159) Client 192.168.1.79 Connection Lost, will reconnect automatically when device is available! 2023-11-05 14:26:03.660 - warn: esphome.0 (2159) Client 192.168.1.79 Timeout, connection Lost, will reconnect automatically when device is available! 2023-11-05 14:26:24.996 - error: esphome.0 (2159) [dashboardProcess ERROR] 2023-11-05 14:26:28.689 - error: esphome.0 (2159) ESPHome client 192.168.1.79 Error: Bad format: Encryption expected 2023-11-05 14:26:28.692 - warn: esphome.0 (2159) Client 192.168.1.79 Connection Lost, will reconnect automatically when device is available! 2023-11-05 14:26:33.676 - warn: esphome.0 (2159) Client 192.168.1.79 Timeout, connection Lost, will reconnect automatically when device is available! 2023-11-05 14:26:39.997 - error: esphome.0 (2159) [dashboardProcess ERROR] 2023-11-05 14:26:50.001 - error: esphome.0 (2159) [dashboardProcess ERROR] 2023-11-05 14:26:51.622 - warn: esphome.0 (2159) ESPHome client sauna disconnected 2023-11-05 14:26:55.000 - error: esphome.0 (2159) [dashboardProcess ERROR] 2023-11-05 14:26:58.730 - error: esphome.0 (2159) ESPHome client 192.168.1.79 Error: Bad format: Encryption expected 2023-11-05 14:27:03.699 - warn: esphome.0 (2159) Client 192.168.1.79 Timeout, connection Lost, will reconnect automatically when device is available! 2023-11-05 14:27:21.628 - error: esphome.0 (2159) ESPHome client 192.168.1.73 Error: connect ECONNREFUSED 192.168.1.73:6053 2023-11-05 14:27:28.779 - error: esphome.0 (2159) ESPHome client 192.168.1.79 Error: Bad format: Encryption expected 2023-11-05 14:27:28.780 - warn: esphome.0 (2159) Client 192.168.1.79 Connection Lost, will reconnect automatically when device is available! 2023-11-05 14:27:33.738 - warn: esphome.0 (2159) Client 192.168.1.79 Timeout, connection Lost, will reconnect automatically when device is available! 2023-11-05 14:27:51.634 - error: esphome.0 (2159) ESPHome client 192.168.1.73 Error: connect ECONNREFUSED 192.168.1.73:6053 2023-11-05 14:27:58.809 - error: esphome.0 (2159) ESPHome client 192.168.1.79 Error: Bad format: Encryption expected 2023-11-05 14:27:58.814 - warn: esphome.0 (2159) Client 192.168.1.79 Connection Lost, will reconnect automatically when device is available! 2023-11-05 14:28:03.791 - warn: esphome.0 (2159) Client 192.168.1.79 Timeout, connection Lost, will reconnect automatically when device is available! ============ Mark until here for C&P ============= iob diag has finished. Press any key for a summary@wolfgangfb sagte in Load average IO-Broker auf Raspberry 4 (8GB):
Für mich auffällig sind die vielen node Prozesse die oftmals als Zombie gelistet sind.
ja, das sind startende iob Prozesse, warum auch immer
und
@wolfgangfb sagte in Load average IO-Broker auf Raspberry 4 (8GB):
%CPU(s): 75,5 us,
ist wirklich zu viel
-
@homoran sagte in Load average IO-Broker auf Raspberry 4 (8GB):
@wolfgangfb sagte in Load average IO-Broker auf Raspberry 4 (8GB):
Als ersten verdächtige ich History und ECharts
du brauchst niemanden zu verdächtigen, du musst dir nur den Rest von top ansehen (nach %cpu sortiert) und uns zeigen.
OK, hier ist top nachdem ich echarts wieder gestartet habe und 5 Temperatursensoren hinzugefügt habe.
Für mich auffällig sind die vielen node Prozesse die oftmals als Zombie gelistet sind.
Allerdings steckt in der load avarage mehr als die CPU-Auslastung.
bitte
iob diagin der Langfassung.OK, der erste Versuch hat den Raspi komplett zum Absturz gebracht, harter Neustart war notwendig.
Nach dem Neustart war das System erstmaal extrem langsam. Dann habe ich, um ähnliche Voraussetzungen zu schaffen, wieder in Echarts ein paar Temperatursensoren aufgenommen. Das Ergebnis von Top sieht sehr ähnlich aus (wieder mit vielen Zombies)pi@raspberrypi205:/opt/iobroker/Wolfgang $ top top - 14:21:26 up 23 min, 3 users, load average: 12,95, 7,27, 5,62 Tasks: 256 total, 20 running, 220 sleeping, 0 stopped, 16 zombie %CPU(s): 75,5 us, 23,1 sy, 0,0 ni, 0,0 id, 0,0 wa, 0,0 hi, 1,4 si, 0,0 st MiB Spch: 7811,2 total, 5242,8 free, 1843,7 used, 882,7 buff/cache MiB Swap: 100,0 total, 100,0 free, 0,0 used. 5967,5 avail Spch PID USER PR NI VIRT RES SHR S %CPU %MEM ZEIT+ BEFEHL 817 iobroker 20 0 5341812 291076 38228 R 18,2 3,6 3:29.28 iobroker.js-con 1536 iobroker 20 0 756864 93444 36728 R 15,5 1,2 0:45.69 io.history.0 1747 iobroker 20 0 792560 145732 36904 S 10,9 1,8 2:03.14 io.shelly.0 2084 iobroker 20 0 1058628 188620 43228 S 10,9 2,4 0:45.81 io.admin.0 2159 iobroker 20 0 5162456 105900 39424 S 8,9 1,3 1:08.52 io.esphome.0 11539 iobroker 20 0 0 0 0 Z 8,3 0,0 0:00.25 node 11569 iobroker 20 0 0 0 0 Z 7,9 0,0 0:00.24 node 11519 iobroker 20 0 0 0 0 Z 7,6 0,0 0:00.23 node 11577 iobroker 20 0 0 0 0 Z 7,6 0,0 0:00.23 node 11678 iobroker 20 0 530184 44096 32540 S 7,6 0,6 0:00.23 node 11511 iobroker 20 0 0 0 0 Z 7,3 0,0 0:00.24 node 11533 iobroker 20 0 0 0 0 Z 7,3 0,0 0:00.22 node 11681 iobroker 20 0 530216 43756 32532 S 7,3 0,5 0:00.22 node 11689 iobroker 20 0 530180 43820 32524 S 7,3 0,5 0:00.22 node 11525 iobroker 20 0 0 0 0 Z 6,9 0,0 0:00.21 node 11585 iobroker 20 0 332572 42652 31836 S 6,9 0,5 0:00.21 node 11590 iobroker 20 0 332560 42652 31852 S 6,9 0,5 0:00.21 node 11604 iobroker 20 0 332552 43536 32540 S 6,9 0,5 0:00.21 node 11683 iobroker 20 0 332560 43556 32540 R 6,9 0,5 0:00.21 node 11704 iobroker 20 0 595748 44116 32540 S 6,9 0,6 0:00.21 node 11505 iobroker 20 0 0 0 0 Z 6,6 0,0 0:00.22 node 11568 iobroker 20 0 332552 42644 31852 S 6,6 0,5 0:00.20 node 11570 iobroker 20 0 332552 42644 31852 S 6,6 0,5 0:00.20 nodeJetzt zum iob diag
Skript v.2023-10-10 *** BASE SYSTEM *** Static hostname: raspberrypi205 Icon name: computer Operating System: Debian GNU/Linux 12 (bookworm) Kernel: Linux 6.1.0-rpi4-rpi-v8 Architecture: arm64 Model : Raspberry Pi 4 Model B Rev 1.5 Docker : false Virtualization : none Kernel : aarch64 Userland : arm64 Systemuptime and Load: 14:24:16 up 26 min, 4 users, load average: 20.99, 13.41, 8.26 CPU threads: 4 *** RASPBERRY THROTTLING *** Current issues: No throttling issues detected. Previously detected issues: No throttling issues detected. *** Time and Time Zones *** Local time: Sun 2023-11-05 14:24:17 CET Universal time: Sun 2023-11-05 13:24:17 UTC RTC time: n/a Time zone: Europe/Berlin (CET, +0100) System clock synchronized: yes NTP service: active RTC in local TZ: no *** User and Groups *** pi /home/pi pi adm dialout cdrom sudo audio video plugdev games users input render netdev lpadmin gpio i2c spi iobroker *** X-Server-Setup *** X-Server: false Desktop: Terminal: tty Boot Target: graphical.target *** MEMORY *** total used free shared buff/cache available Mem: 8.2G 2.1G 5.3G 40M 928M 6.0G Swap: 104M 0B 104M Total: 8.3G 2.1G 5.4G 7811 M total memory 2045 M used memory 2117 M active memory 458 M inactive memory 5037 M free memory 46 M buffer memory 839 M swap cache 99 M total swap 0 M used swap 99 M free swap Raspberry only: oom events: 0 lifetime oom required: 0 Mbytes total time in oom handler: 0 ms max time spent in oom handler: 0 ms *** FAILED SERVICES *** UNIT LOAD ACTIVE SUB DESCRIPTION 0 loaded units listed. *** FILESYSTEM *** Filesystem Type Size Used Avail Use% Mounted on udev devtmpfs 3.6G 0 3.6G 0% /dev tmpfs tmpfs 782M 3.1M 779M 1% /run /dev/mmcblk0p2 ext4 29G 7.1G 20G 27% / tmpfs tmpfs 3.9G 216K 3.9G 1% /dev/shm tmpfs tmpfs 5.0M 16K 5.0M 1% /run/lock /dev/mmcblk0p1 vfat 510M 73M 438M 15% /boot/firmware tmpfs tmpfs 782M 36K 782M 1% /run/user/1000 Messages concerning ext4 filesystem in dmesg: [Sun Nov 5 13:57:49 2023] Kernel command line: coherent_pool=1M 8250.nr_uarts=0 snd_bcm2835.enable_headphones=0 snd_bcm2835.enable_headphones=1 snd_bcm2835.enable_hdmi=1 snd_bcm2835.enable_hdmi=0 smsc95xx.macaddr=D8:3A:DD:66:20:22 vc_mem.mem_base=0x3ec00000 vc_mem.mem_size=0x40000000 console=ttyS0,115200 console=tty1 root=PARTUUID=06347f7d-02 rootfstype=ext4 fsck.repair=yes rootwait quiet splash plymouth.ignore-serial-consoles cfg80211.ieee80211_regdom=DE [Sun Nov 5 13:59:01 2023] EXT4-fs (mmcblk0p2): mounted filesystem with ordered data mode. Quota mode: none. [Sun Nov 5 13:59:05 2023] EXT4-fs (mmcblk0p2): re-mounted. Quota mode: none. Show mounted filesystems \(real ones only\): TARGET SOURCE FSTYPE OPTIONS / /dev/mmcblk0p2 ext4 rw,noatime |-/run/user/1000/doc portal fuse.portal rw,nosuid,nodev,relatime,user_id=1000,group_id=1000 `-/boot/firmware /dev/mmcblk0p1 vfat rw,relatime,fmask=0022,dmask=0022,codepage=437,iocharset=ascii,shortname=mixed,errors=remount-ro Files in neuralgic directories: /var: 674M /var/ 299M /var/cache 293M /var/cache/apt 201M /var/lib 180M /var/cache/apt/archives Archived and active journals take up 56.0M in the file system. /opt/iobroker/backups: 49M /opt/iobroker/backups/ /opt/iobroker/iobroker-data: du: cannot read directory '/opt/iobroker/iobroker-data/esphome.0/.esphome/build/galerie-dallas/.piolibdeps/galerie-dallas/ESPAsyncTCP-esphome': Permission denied du: cannot read directory '/opt/iobroker/iobroker-data/esphome.0/.esphome/build/galerie-dallas/.piolibdeps/galerie-dallas/ESPAsyncTCP-esphome@1.2.3': Permission denied du: cannot read directory '/opt/iobroker/iobroker-data/esphome.0/.esphome/build/galerie-dallas/.piolibdeps/galerie-dallas/ESPAsyncWebServer-esphome': Permission denied du: cannot read directory '/opt/iobroker/iobroker-data/esphome.0/.esphome/build/galerie-dallas/.piolibdeps/galerie-dallas/ArduinoJson': Permission denied 391M /opt/iobroker/iobroker-data/ 272M /opt/iobroker/iobroker-data/files 90M /opt/iobroker/iobroker-data/files/echarts.admin 73M /opt/iobroker/iobroker-data/backup-objects 58M /opt/iobroker/iobroker-data/files/echarts The five largest files in iobroker-data are: find: '/opt/iobroker/iobroker-data/esphome.0/.esphome/build/galerie-dallas/.piolibdeps/galerie-dallas/ESPAsyncTCP-esphome': Permission denied find: '/opt/iobroker/iobroker-data/esphome.0/.esphome/build/galerie-dallas/.piolibdeps/galerie-dallas/ESPAsyncTCP-esphome@1.2.3': Permission denied find: '/opt/iobroker/iobroker-data/esphome.0/.esphome/build/galerie-dallas/.piolibdeps/galerie-dallas/ESPAsyncWebServer-esphome': Permission denied find: '/opt/iobroker/iobroker-data/esphome.0/.esphome/build/galerie-dallas/.piolibdeps/galerie-dallas/ArduinoJson': Permission denied 24M /opt/iobroker/iobroker-data/files/echarts/static/js/main.5f66c5d9.js.map 24M /opt/iobroker/iobroker-data/files/echarts.admin/static/js/main.9f2a6569.js.map 24M /opt/iobroker/iobroker-data/files/echarts.admin/chart/static/js/main.5f66c5d9.js.map 23M /opt/iobroker/iobroker-data/objects.jsonl 21M /opt/iobroker/iobroker-data/files/web.admin/static/js/main.aaea95f8.js.map USB-Devices by-id: USB-Sticks - Avoid direct links to /dev/* in your adapter setups, please always prefer the links 'by-id': find: '/dev/serial/by-id/': No such file or directory *** NodeJS-Installation *** /usr/bin/nodejs v18.18.2 /usr/bin/node v18.18.2 /usr/bin/npm 9.8.1 /usr/bin/npx 9.8.1 /usr/bin/corepack 0.19.0 nodejs: Installed: 18.18.2-1nodesource1 Candidate: 18.18.2-1nodesource1 Version table: *** 18.18.2-1nodesource1 500 500 https://deb.nodesource.com/node_18.x nodistro/main arm64 Packages 100 /var/lib/dpkg/status 18.18.1-1nodesource1 500 500 https://deb.nodesource.com/node_18.x nodistro/main arm64 Packages 18.18.0-1nodesource1 500 500 https://deb.nodesource.com/node_18.x nodistro/main arm64 Packages 18.17.1-1nodesource1 500 500 https://deb.nodesource.com/node_18.x nodistro/main arm64 Packages 18.17.0-1nodesource1 500 500 https://deb.nodesource.com/node_18.x nodistro/main arm64 Packages 18.16.1-1nodesource1 500 500 https://deb.nodesource.com/node_18.x nodistro/main arm64 Packages 18.16.0-1nodesource1 500 500 https://deb.nodesource.com/node_18.x nodistro/main arm64 Packages 18.15.0-1nodesource1 500 500 https://deb.nodesource.com/node_18.x nodistro/main arm64 Packages 18.14.2-1nodesource1 500 500 https://deb.nodesource.com/node_18.x nodistro/main arm64 Packages 18.14.1-1nodesource1 500 500 https://deb.nodesource.com/node_18.x nodistro/main arm64 Packages 18.14.0-1nodesource1 500 500 https://deb.nodesource.com/node_18.x nodistro/main arm64 Packages 18.13.0+dfsg1-1 500 500 http://deb.debian.org/debian bookworm/main arm64 Packages 18.13.0-1nodesource1 500 500 https://deb.nodesource.com/node_18.x nodistro/main arm64 Packages 18.12.0-1nodesource1 500 500 https://deb.nodesource.com/node_18.x nodistro/main arm64 Packages 18.11.0-1nodesource1 500 500 https://deb.nodesource.com/node_18.x nodistro/main arm64 Packages 18.10.0-1nodesource1 500 500 https://deb.nodesource.com/node_18.x nodistro/main arm64 Packages 18.9.1-1nodesource1 500 500 https://deb.nodesource.com/node_18.x nodistro/main arm64 Packages 18.9.0-1nodesource1 500 500 https://deb.nodesource.com/node_18.x nodistro/main arm64 Packages 18.8.0-1nodesource1 500 500 https://deb.nodesource.com/node_18.x nodistro/main arm64 Packages 18.7.0-1nodesource1 500 500 https://deb.nodesource.com/node_18.x nodistro/main arm64 Packages 18.6.0-1nodesource1 500 500 https://deb.nodesource.com/node_18.x nodistro/main arm64 Packages 18.5.0-1nodesource1 500 500 https://deb.nodesource.com/node_18.x nodistro/main arm64 Packages 18.4.0-1nodesource1 500 500 https://deb.nodesource.com/node_18.x nodistro/main arm64 Packages 18.3.0-1nodesource1 500 500 https://deb.nodesource.com/node_18.x nodistro/main arm64 Packages 18.2.0-1nodesource1 500 500 https://deb.nodesource.com/node_18.x nodistro/main arm64 Packages 18.1.0-1nodesource1 500 500 https://deb.nodesource.com/node_18.x nodistro/main arm64 Packages 18.0.0-1nodesource1 500 500 https://deb.nodesource.com/node_18.x nodistro/main arm64 Packages Temp directories causing npm8 problem: 0 No problems detected Errors in npm tree: *** ioBroker-Installation *** ioBroker Status iobroker is running on this host. Objects type: jsonl States type: jsonl Core adapters versions js-controller: 5.0.12 admin: 6.10.1 javascript: 7.1.4 Adapters from github: 1 Adapter State + system.adapter.admin.0 : admin : raspberrypi205 - enabled, port: 8081, bind: 0.0.0.0, run as: admin + system.adapter.backitup.0 : backitup : raspberrypi205 - enabled + system.adapter.discovery.0 : discovery : raspberrypi205 - enabled + system.adapter.echarts.0 : echarts : raspberrypi205 - enabled + system.adapter.esphome.0 : esphome : raspberrypi205 - enabled + system.adapter.history.0 : history : raspberrypi205 - enabled + system.adapter.javascript.0 : javascript : raspberrypi205 - enabled + system.adapter.onkyo.0 : onkyo : raspberrypi205 - enabled + system.adapter.shelly.0 : shelly : raspberrypi205 - enabled, port: 1882, bind: 0.0.0.0 + system.adapter.tankerkoenig.0 : tankerkoenig : raspberrypi205 - enabled system.adapter.telegram.0 : telegram : raspberrypi205 - disabled, port: 8443, bind: 0.0.0.0 system.adapter.vis-history.0 : vis-history : raspberrypi205 - enabled + system.adapter.vis-inventwo.0 : vis-inventwo : raspberrypi205 - enabled system.adapter.vis.0 : vis : raspberrypi205 - enabled + system.adapter.web.0 : web : raspberrypi205 - enabled, port: 8082, bind: 0.0.0.0, run as: admin + instance is alive Enabled adapters with bindings + system.adapter.admin.0 : admin : raspberrypi205 - enabled, port: 8081, bind: 0.0.0.0, run as: admin + system.adapter.shelly.0 : shelly : raspberrypi205 - enabled, port: 1882, bind: 0.0.0.0 + system.adapter.web.0 : web : raspberrypi205 - enabled, port: 8082, bind: 0.0.0.0, run as: admin ioBroker-Repositories stable : http://download.iobroker.net/sources-dist.json beta : http://download.iobroker.net/sources-dist-latest.json Active repo(s): stable Installed ioBroker-Instances Used repository: stable Adapter "admin" : 6.12.0 , installed 6.10.1 [Updatable] Adapter "backitup" : 2.8.7 , installed 2.8.1 [Updatable] Adapter "discovery" : 3.1.0 , installed 3.1.0 Adapter "echarts" : 1.5.1 , installed 1.5.4 Adapter "history" : 3.0.1 , installed 3.0.1 Adapter "javascript" : 7.1.4 , installed 7.1.4 Controller "js-controller": 5.0.12 , installed 5.0.12 Adapter "onkyo" : 2.1.2 , installed 2.1.2 Adapter "shelly" : 6.4.5 , installed 6.4.5 Adapter "simple-api" : 2.7.2 , installed 2.7.2 Adapter "socketio" : 6.5.5 , installed 6.6.0 Adapter "tankerkoenig" : 3.3.7 , installed 3.3.7 Adapter "telegram" : 1.16.0 , installed 2.0.1 Adapter "vis" : 1.4.16 , installed 1.4.16 Adapter "vis-history" : 1.0.0 , installed 1.0.0 Adapter "vis-inventwo" : 3.3.3 , installed 3.3.3 Adapter "web" : 6.1.4 , installed 6.1.10 Adapter "ws" : 2.5.5 , installed 2.5.8 Objects and States Please stand by - This may take a while Objects: 5467 States: 3546 *** OS-Repositories and Updates *** Hit:1 http://deb.debian.org/debian bookworm InRelease Hit:2 http://archive.raspberrypi.com/debian bookworm InRelease Hit:3 http://deb.debian.org/debian-security bookworm-security InRelease Hit:4 http://deb.debian.org/debian bookworm-updates InRelease Hit:5 https://deb.nodesource.com/node_18.x nodistro InRelease Reading package lists... Pending Updates: 1 *** Listening Ports *** Active Internet connections (only servers) Proto Recv-Q Send-Q Local Address Foreign Address State User Inode PID/Program name tcp 0 0 127.0.0.1:9000 0.0.0.0:* LISTEN 1001 18751 817/iobroker.js-con tcp 0 0 127.0.0.1:9001 0.0.0.0:* LISTEN 1001 19596 817/iobroker.js-con tcp 0 0 127.0.0.1:631 0.0.0.0:* LISTEN 0 16158 816/cupsd tcp 0 0 127.0.0.1:1883 0.0.0.0:* LISTEN 112 17769 827/mosquitto tcp 0 0 0.0.0.0:6052 0.0.0.0:* LISTEN 1001 24837 2302/python3 tcp 0 0 0.0.0.0:445 0.0.0.0:* LISTEN 0 18015 1078/smbd tcp 0 0 0.0.0.0:22 0.0.0.0:* LISTEN 0 16571 837/sshd: /usr/sbin tcp 0 0 0.0.0.0:139 0.0.0.0:* LISTEN 0 18016 1078/smbd tcp6 0 0 :::8081 :::* LISTEN 1001 22270 2084/io.admin.0 tcp6 0 0 :::8082 :::* LISTEN 1001 22272 2145/io.web.0 tcp6 0 0 ::1:1883 :::* LISTEN 112 17770 827/mosquitto tcp6 0 0 ::1:631 :::* LISTEN 0 16157 816/cupsd tcp6 0 0 :::445 :::* LISTEN 0 18013 1078/smbd tcp6 0 0 :::22 :::* LISTEN 0 16582 837/sshd: /usr/sbin tcp6 0 0 :::139 :::* LISTEN 0 18014 1078/smbd udp 2752 0 0.0.0.0:5683 0.0.0.0:* 1001 19404 1747/io.shelly.0 udp 2752 0 0.0.0.0:34538 0.0.0.0:* 1001 104439 - udp 0 0 192.168.1.255:137 0.0.0.0:* 0 16338 987/nmbd udp 0 0 192.168.1.205:137 0.0.0.0:* 0 16337 987/nmbd udp 0 0 0.0.0.0:137 0.0.0.0:* 0 16322 987/nmbd udp 0 0 192.168.1.255:138 0.0.0.0:* 0 16340 987/nmbd udp 0 0 192.168.1.205:138 0.0.0.0:* 0 16339 987/nmbd udp 0 0 0.0.0.0:138 0.0.0.0:* 0 16323 987/nmbd udp 0 0 0.0.0.0:631 0.0.0.0:* 0 16644 911/cups-browsed udp 0 0 0.0.0.0:46044 0.0.0.0:* 104 16419 582/avahi-daemon: r udp 0 0 127.0.0.1:5353 0.0.0.0:* 1001 23207 2302/python3 udp 0 0 192.168.1.205:5353 0.0.0.0:* 1001 23206 2302/python3 udp 0 0 0.0.0.0:5353 0.0.0.0:* 1001 23202 2302/python3 udp 0 0 0.0.0.0:5353 0.0.0.0:* 1001 22903 2159/io.esphome.0 udp 0 0 0.0.0.0:5353 0.0.0.0:* 104 16417 582/avahi-daemon: r udp6 0 0 :::53054 :::* 104 16420 582/avahi-daemon: r udp6 0 0 :::5353 :::* 104 16418 582/avahi-daemon: r *** Log File - Last 25 Lines *** 2023-11-05 14:25:58.667 - error: esphome.0 (2159) ESPHome client 192.168.1.79 Error: Bad format: Encryption expected 2023-11-05 14:25:58.668 - warn: esphome.0 (2159) Client 192.168.1.79 Connection Lost, will reconnect automatically when device is available! 2023-11-05 14:26:03.660 - warn: esphome.0 (2159) Client 192.168.1.79 Timeout, connection Lost, will reconnect automatically when device is available! 2023-11-05 14:26:24.996 - error: esphome.0 (2159) [dashboardProcess ERROR] 2023-11-05 14:26:28.689 - error: esphome.0 (2159) ESPHome client 192.168.1.79 Error: Bad format: Encryption expected 2023-11-05 14:26:28.692 - warn: esphome.0 (2159) Client 192.168.1.79 Connection Lost, will reconnect automatically when device is available! 2023-11-05 14:26:33.676 - warn: esphome.0 (2159) Client 192.168.1.79 Timeout, connection Lost, will reconnect automatically when device is available! 2023-11-05 14:26:39.997 - error: esphome.0 (2159) [dashboardProcess ERROR] 2023-11-05 14:26:50.001 - error: esphome.0 (2159) [dashboardProcess ERROR] 2023-11-05 14:26:51.622 - warn: esphome.0 (2159) ESPHome client sauna disconnected 2023-11-05 14:26:55.000 - error: esphome.0 (2159) [dashboardProcess ERROR] 2023-11-05 14:26:58.730 - error: esphome.0 (2159) ESPHome client 192.168.1.79 Error: Bad format: Encryption expected 2023-11-05 14:27:03.699 - warn: esphome.0 (2159) Client 192.168.1.79 Timeout, connection Lost, will reconnect automatically when device is available! 2023-11-05 14:27:21.628 - error: esphome.0 (2159) ESPHome client 192.168.1.73 Error: connect ECONNREFUSED 192.168.1.73:6053 2023-11-05 14:27:28.779 - error: esphome.0 (2159) ESPHome client 192.168.1.79 Error: Bad format: Encryption expected 2023-11-05 14:27:28.780 - warn: esphome.0 (2159) Client 192.168.1.79 Connection Lost, will reconnect automatically when device is available! 2023-11-05 14:27:33.738 - warn: esphome.0 (2159) Client 192.168.1.79 Timeout, connection Lost, will reconnect automatically when device is available! 2023-11-05 14:27:51.634 - error: esphome.0 (2159) ESPHome client 192.168.1.73 Error: connect ECONNREFUSED 192.168.1.73:6053 2023-11-05 14:27:58.809 - error: esphome.0 (2159) ESPHome client 192.168.1.79 Error: Bad format: Encryption expected 2023-11-05 14:27:58.814 - warn: esphome.0 (2159) Client 192.168.1.79 Connection Lost, will reconnect automatically when device is available! 2023-11-05 14:28:03.791 - warn: esphome.0 (2159) Client 192.168.1.79 Timeout, connection Lost, will reconnect automatically when device is available! ============ Mark until here for C&P ============= iob diag has finished. Press any key for a summaryDas sieht vom Setup her eigentlich okay aus.
Ich vermute, du hast dir da irgendein unglückliches Skript reingelegt. -
Das sieht vom Setup her eigentlich okay aus.
Ich vermute, du hast dir da irgendein unglückliches Skript reingelegt.@thomas-braun sagte in Load average IO-Broker auf Raspberry 4 (8GB):
Das sieht vom Setup her eigentlich okay aus.
Moin,
nein, denn
/opt/iobroker/iobroker-data:
du: cannot read directory '/opt/iobroker/iobroker-data/esphome.0/.esphome/build/galerie-dallas/.piolibdeps/galerie-dallas/ESPAsyncTCP-esphome': Permission denied
du: cannot read directory '/opt/iobroker/iobroker-data/esphome.0/.esphome/build/galerie-dallas/.piolibdeps/galerie-dallas/ESPAsyncTCP-esphome@1.2.3': Permission denied
du: cannot read directory '/opt/iobroker/iobroker-data/esphome.0/.esphome/build/galerie-dallas/.piolibdeps/galerie-dallas/ESPAsyncWebServer-esphome': Permission denied
du: cannot read directory '/opt/iobroker/iobroker-data/esphome.0/.esphome/build/galerie-dallas/.piolibdeps/galerie-dallas/ArduinoJson': Permission denied
Und auch das
The five largest files in iobroker-data are:
find: '/opt/iobroker/iobroker-data/esphome.0/.esphome/build/galerie-dallas/.piolibdeps/galerie-dallas/ESPAsyncTCP-esphome': Permission denied
find: '/opt/iobroker/iobroker-data/esphome.0/.esphome/build/galerie-dallas/.piolibdeps/galerie-dallas/ESPAsyncTCP-esphome@1.2.3': Permission denied
find: '/opt/iobroker/iobroker-data/esphome.0/.esphome/build/galerie-dallas/.piolibdeps/galerie-dallas/ESPAsyncWebServer-esphome': Permission denied
find: '/opt/iobroker/iobroker-data/esphome.0/.esphome/build/galerie-dallas/.piolibdeps/galerie-dallas/ArduinoJson': Permission denied
Kann dazu führen, dass sich das System damit beschäftigt, und alles andere langsam ist!
An den TE, achte darauf, dass Dein System ohne solche Fehler läuft, wie ich oben schon geschrieben habe,
Disk I/Okann die ganze Kiste langsam machen.VG
Bernd -
@thomas-braun sagte in Load average IO-Broker auf Raspberry 4 (8GB):
Das sieht vom Setup her eigentlich okay aus.
Moin,
nein, denn
/opt/iobroker/iobroker-data:
du: cannot read directory '/opt/iobroker/iobroker-data/esphome.0/.esphome/build/galerie-dallas/.piolibdeps/galerie-dallas/ESPAsyncTCP-esphome': Permission denied
du: cannot read directory '/opt/iobroker/iobroker-data/esphome.0/.esphome/build/galerie-dallas/.piolibdeps/galerie-dallas/ESPAsyncTCP-esphome@1.2.3': Permission denied
du: cannot read directory '/opt/iobroker/iobroker-data/esphome.0/.esphome/build/galerie-dallas/.piolibdeps/galerie-dallas/ESPAsyncWebServer-esphome': Permission denied
du: cannot read directory '/opt/iobroker/iobroker-data/esphome.0/.esphome/build/galerie-dallas/.piolibdeps/galerie-dallas/ArduinoJson': Permission denied
Und auch das
The five largest files in iobroker-data are:
find: '/opt/iobroker/iobroker-data/esphome.0/.esphome/build/galerie-dallas/.piolibdeps/galerie-dallas/ESPAsyncTCP-esphome': Permission denied
find: '/opt/iobroker/iobroker-data/esphome.0/.esphome/build/galerie-dallas/.piolibdeps/galerie-dallas/ESPAsyncTCP-esphome@1.2.3': Permission denied
find: '/opt/iobroker/iobroker-data/esphome.0/.esphome/build/galerie-dallas/.piolibdeps/galerie-dallas/ESPAsyncWebServer-esphome': Permission denied
find: '/opt/iobroker/iobroker-data/esphome.0/.esphome/build/galerie-dallas/.piolibdeps/galerie-dallas/ArduinoJson': Permission denied
Kann dazu führen, dass sich das System damit beschäftigt, und alles andere langsam ist!
An den TE, achte darauf, dass Dein System ohne solche Fehler läuft, wie ich oben schon geschrieben habe,
Disk I/Okann die ganze Kiste langsam machen.VG
Bernd@dp20eic dann würde ich @WolfgangFB erst einmal dazu raten
iob stop
iob fix
iob start
auszuführen, in der Hoffnung, dass nur die Rechte verbogen sind.
-
@dp20eic dann würde ich @WolfgangFB erst einmal dazu raten
iob stop
iob fix
iob start
auszuführen, in der Hoffnung, dass nur die Rechte verbogen sind.
@homoran
So, nachdem iob diag durchgelaufen war, habe ich dann festgestellt, dass der Raspi wieder komplett eingefroren war. Ob das jetzt an diag oder echarts liegt weiß ich nicht.
Jedenfalls hat sich das ganze dann etwas beruigt, obwohl ich echarts offen habe zeigt top:top - 16:07:07 up 50 min, 3 users, load average: 2,35, 2,33, 2,48 Tasks: 202 total, 4 running, 198 sleeping, 0 stopped, 0 zombie %CPU(s): 8,3 us, 1,5 sy, 0,0 ni, 89,6 id, 0,0 wa, 0,0 hi, 0,6 si, 0,0 st MiB Spch: 7811,2 total, 5847,5 free, 1512,0 used, 607,4 buff/cache MiB Swap: 100,0 total, 100,0 free, 0,0 used. 6299,2 avail Spch PID USER PR NI VIRT RES SHR S %CPU %MEM ZEIT+ BEFEHL 835 iobroker 20 0 5230036 344588 38228 R 14,3 4,3 7:13.18 iobroker.js-con 1779 iobroker 20 0 740876 174128 37052 S 11,0 2,2 4:27.98 io.shelly.0 1756 iobroker 20 0 5172328 119348 39440 R 5,3 1,5 2:42.62 io.esphome.0 1785 iobroker 20 0 966732 159424 37392 R 3,7 2,0 1:29.91 io.javascript.0 1538 iobroker 20 0 885780 85592 36728 S 2,7 1,1 1:10.60 io.history.0 1896 iobroker 20 0 346032 37000 13992 S 2,0 0,5 1:15.42 esphome 1792 iobroker 20 0 1026616 156752 43344 S 1,0 2,0 0:39.09 io.admin.0 581 avahi 20 0 7648 3584 2856 S 0,7 0,0 0:35.82 avahi-daemon 1895 pi 20 0 9488 5084 2920 R 0,7 0,1 0:13.78 top 15 root 20 0 0 0 0 I 0,3 0,0 0:05.61 rcu_preempt 1682 iobroker 20 0 680724 72184 36860 S 0,3 0,9 0:06.92 io.discovery.0was immer noch über 2 ist, aber zumindest mal besser.
Jetzt nochmal 5 Echarts hinzugefügt und das ganze sieht so aus:
top - 16:15:02 up 58 min,  3 users,  load average: 16,26, 8,08, 4,62
Tasks: 285 total,  16 running, 215 sleeping,   0 stopped,  54 zombie
%CPU(s): 73,6 us, 25,2 sy,  0,0 ni,  0,2 id,  0,0 wa,  0,0 hi,  1,0 si,  0,0 st
MiB Spch:   7811,2 total,   5526,1 free,   1830,0 used,    611,3 buff/cache
MiB Swap:    100,0 total,    100,0 free,      0,0 used.   5981,2 avail Spch

    PID USER      PR  NI    VIRT    RES    SHR S  %CPU  %MEM     ZEIT+ BEFEHL
    835 iobroker  20   0 5230884 346056  38228 R  24,1   4,3   8:35.69 iobroker.js-con
   1538 iobroker  20   0  888220 121384  36728 S  16,5   1,5   1:43.96 io.history.0
   1779 iobroker  20   0  741644 176716  37052 R   9,9   2,2   5:23.91 io.shelly.0
   1756 iobroker  20   0 5165052 107292  39440 S   8,6   1,3   3:14.71 io.esphome.0
   1792 iobroker  20   0 1028408 162884  43344 R   8,6   2,0   0:57.73 io.admin.0
  20723 iobroker  20   0       0      0      0 Z   8,6   0,0   0:00.26 node
  20731 iobroker  20   0       0      0      0 Z   8,3   0,0   0:00.25 node
  20752 iobroker  20   0       0      0      0 Z   8,3   0,0   0:00.25 node
  20786 iobroker  20   0       0      0      0 Z   8,3   0,0   0:00.25 node
  20717 iobroker  20   0       0      0      0 Z   7,9   0,0   0:00.24 node
  20732 iobroker  20   0       0      0      0 Z   7,9   0,0   0:00.24 node
  20886 iobroker  20   0  332572  43536  32524 S   7,9   0,5   0:00.24 node
  20702 iobroker  20   0       0      0      0 Z   7,6   0,0   0:00.25 node
  20744 iobroker  20   0       0      0      0 Z   7,6   0,0   0:00.23 node
  20757 iobroker  20   0       0      0      0 Z   7,6   0,0   0:00.23 node
  20761 iobroker  20   0       0      0      0 Z   7,6   0,0   0:00.23 node
  20893 iobroker  20   0  530056  44136  32536 S   7,6   0,6   0:00.23 node
  20709 iobroker  20   0       0      0      0 Z   7,3   0,0   0:00.23 node
  20808 iobroker  20   0  530192  43744  32484 S   7,3   0,5   0:00.22 node
  20828 iobroker  20   0  596236  44968  32600 S   7,3   0,6   0:00.22 node
  20887 iobroker  20   0  332560  43540  32536 S   7,3   0,5   0:00.22 node
mal sehn ober sich das System von selbst davon erholt.
-
@thomas-braun sagte in Load average IO-Broker auf Raspberry 4 (8GB):
Das sieht vom Setup her eigentlich okay aus.
Moin,
nein, denn
/opt/iobroker/iobroker-data:
du: cannot read directory '/opt/iobroker/iobroker-data/esphome.0/.esphome/build/galerie-dallas/.piolibdeps/galerie-dallas/ESPAsyncTCP-esphome': Permission denied
du: cannot read directory '/opt/iobroker/iobroker-data/esphome.0/.esphome/build/galerie-dallas/.piolibdeps/galerie-dallas/ESPAsyncTCP-esphome@1.2.3': Permission denied
du: cannot read directory '/opt/iobroker/iobroker-data/esphome.0/.esphome/build/galerie-dallas/.piolibdeps/galerie-dallas/ESPAsyncWebServer-esphome': Permission denied
du: cannot read directory '/opt/iobroker/iobroker-data/esphome.0/.esphome/build/galerie-dallas/.piolibdeps/galerie-dallas/ArduinoJson': Permission denied
Und auch das
The five largest files in iobroker-data are:
find: '/opt/iobroker/iobroker-data/esphome.0/.esphome/build/galerie-dallas/.piolibdeps/galerie-dallas/ESPAsyncTCP-esphome': Permission denied
find: '/opt/iobroker/iobroker-data/esphome.0/.esphome/build/galerie-dallas/.piolibdeps/galerie-dallas/ESPAsyncTCP-esphome@1.2.3': Permission denied
find: '/opt/iobroker/iobroker-data/esphome.0/.esphome/build/galerie-dallas/.piolibdeps/galerie-dallas/ESPAsyncWebServer-esphome': Permission denied
find: '/opt/iobroker/iobroker-data/esphome.0/.esphome/build/galerie-dallas/.piolibdeps/galerie-dallas/ArduinoJson': Permission denied
Kann dazu führen, dass sich das System damit beschäftigt, und alles andere langsam ist!
An den TE, achte darauf, dass Dein System ohne solche Fehler läuft, wie ich oben schon geschrieben habe,
Disk I/Okann die ganze Kiste langsam machen.VG
Bernd@dp20eic sagte in Load average IO-Broker auf Raspberry 4 (8GB):
@thomas-braun sagte in Load average IO-Broker auf Raspberry 4 (8GB):
Das sieht vom Setup her eigentlich okay aus.
Moin,
nein, denn
/opt/iobroker/iobroker-data:
du: cannot read directory '/opt/iobroker/iobroker-data/esphome.0/.esphome/build/galerie-dallas/.piolibdeps/galerie-dallas/ESPAsyncTCP-esphome': Permission denied
du: cannot read directory '/opt/iobroker/iobroker-data/esphome.0/.esphome/build/galerie-dallas/.piolibdeps/galerie-dallas/ESPAsyncTCP-esphome@1.2.3': Permission denied
du: cannot read directory '/opt/iobroker/iobroker-data/esphome.0/.esphome/build/galerie-dallas/.piolibdeps/galerie-dallas/ESPAsyncWebServer-esphome': Permission denied
du: cannot read directory '/opt/iobroker/iobroker-data/esphome.0/.esphome/build/galerie-dallas/.piolibdeps/galerie-dallas/ArduinoJson': Permission denied
Und auch das
The five largest files in iobroker-data are:
find: '/opt/iobroker/iobroker-data/esphome.0/.esphome/build/galerie-dallas/.piolibdeps/galerie-dallas/ESPAsyncTCP-esphome': Permission denied
find: '/opt/iobroker/iobroker-data/esphome.0/.esphome/build/galerie-dallas/.piolibdeps/galerie-dallas/ESPAsyncTCP-esphome@1.2.3': Permission denied
find: '/opt/iobroker/iobroker-data/esphome.0/.esphome/build/galerie-dallas/.piolibdeps/galerie-dallas/ESPAsyncWebServer-esphome': Permission denied
find: '/opt/iobroker/iobroker-data/esphome.0/.esphome/build/galerie-dallas/.piolibdeps/galerie-dallas/ArduinoJson': Permission denied
Kann dazu führen, dass sich das System damit beschäftigt, und alles andere langsam ist!
Wie bekomme ich das weg?
Für mich ist nicht nachvollziebar, warum ESPHome sich da selbst nicht die Rechte gibt.
drwxrwxr-x+ 3 iobroker iobroker 4096  4. Nov 21:23 src
pi@raspberrypi205:/opt/iobroker/iobroker-data/esphome.0/.esphome/build/galerie-dallas $ cd .piolibdeps/
pi@raspberrypi205:/opt/iobroker/iobroker-data/esphome.0/.esphome/build/galerie-dallas/.piolibdeps $ ls -la
insgesamt 12
drwxrwxr-x+ 3 iobroker iobroker 4096  4. Nov 21:52 .
drwxrwxr-x+ 5 iobroker iobroker 4096  4. Nov 21:27 ..
drwxrwxr-x+ 6 iobroker iobroker 4096  4. Nov 21:30 galerie-dallas
pi@raspberrypi205:/opt/iobroker/iobroker-data/esphome.0/.esphome/build/galerie-dallas/.piolibdeps $ cd galerie-dallas/
pi@raspberrypi205:/opt/iobroker/iobroker-data/esphome.0/.esphome/build/galerie-dallas/.piolibdeps/galerie-dallas $ ls -la
insgesamt 28
drwxrwxr-x+ 6 iobroker iobroker 4096  4. Nov 21:30 .
drwxrwxr-x+ 3 iobroker iobroker 4096  4. Nov 21:52 ..
drwx------+ 5 iobroker iobroker 4096  4. Nov 21:30 ArduinoJson
drwx------+ 6 iobroker iobroker 4096  4. Nov 21:28 ESPAsyncTCP-esphome
drwx------+ 6 iobroker iobroker 4096  4. Nov 21:29 ESPAsyncTCP-esphome@1.2.3
drwx------+ 5 iobroker iobroker 4096  4. Nov 21:28 ESPAsyncWebServer-esphome
-rw-rw-r--+ 1 iobroker iobroker  136  4. Nov 21:27 integrity.dat
pi@raspberrypi205:/opt/iobroker/iobroker-data/esphome.0/.esphome/build/galerie-dallas/.piolibdeps/galerie-dallas $ cd ESPAsyncTCP-esphome@1.2.3/
-bash: cd: ESPAsyncTCP-esphome@1.2.3/: Keine Berechtigung
reicht es da aus, wenn ich von Hand allen ein Leserecht gebe?
-
@homoran
So, nachdem iob diag durchgelaufen war, habe ich dann festgestellt, dass der Raspi wieder komplett eingefroren war. Ob das jetzt an diag oder echarts liegt weiß ich nicht.
Jedenfalls hat sich das ganze dann etwas beruigt, obwohl ich echarts offen habe zeigt top:top - 16:07:07 up 50 min, 3 users, load average: 2,35, 2,33, 2,48 Tasks: 202 total, 4 running, 198 sleeping, 0 stopped, 0 zombie %CPU(s): 8,3 us, 1,5 sy, 0,0 ni, 89,6 id, 0,0 wa, 0,0 hi, 0,6 si, 0,0 st MiB Spch: 7811,2 total, 5847,5 free, 1512,0 used, 607,4 buff/cache MiB Swap: 100,0 total, 100,0 free, 0,0 used. 6299,2 avail Spch PID USER PR NI VIRT RES SHR S %CPU %MEM ZEIT+ BEFEHL 835 iobroker 20 0 5230036 344588 38228 R 14,3 4,3 7:13.18 iobroker.js-con 1779 iobroker 20 0 740876 174128 37052 S 11,0 2,2 4:27.98 io.shelly.0 1756 iobroker 20 0 5172328 119348 39440 R 5,3 1,5 2:42.62 io.esphome.0 1785 iobroker 20 0 966732 159424 37392 R 3,7 2,0 1:29.91 io.javascript.0 1538 iobroker 20 0 885780 85592 36728 S 2,7 1,1 1:10.60 io.history.0 1896 iobroker 20 0 346032 37000 13992 S 2,0 0,5 1:15.42 esphome 1792 iobroker 20 0 1026616 156752 43344 S 1,0 2,0 0:39.09 io.admin.0 581 avahi 20 0 7648 3584 2856 S 0,7 0,0 0:35.82 avahi-daemon 1895 pi 20 0 9488 5084 2920 R 0,7 0,1 0:13.78 top 15 root 20 0 0 0 0 I 0,3 0,0 0:05.61 rcu_preempt 1682 iobroker 20 0 680724 72184 36860 S 0,3 0,9 0:06.92 io.discovery.0was immer noch über 2 ist, aber zumindest mal besser.
Jetzt nochmal 5 Echarts hinzugefügt und das ganze sieht so aus:
top - 16:15:02 up 58 min,  3 users,  load average: 16,26, 8,08, 4,62
Tasks: 285 total,  16 running, 215 sleeping,   0 stopped,  54 zombie
%CPU(s): 73,6 us, 25,2 sy,  0,0 ni,  0,2 id,  0,0 wa,  0,0 hi,  1,0 si,  0,0 st
MiB Spch:   7811,2 total,   5526,1 free,   1830,0 used,    611,3 buff/cache
MiB Swap:    100,0 total,    100,0 free,      0,0 used.   5981,2 avail Spch

    PID USER      PR  NI    VIRT    RES    SHR S  %CPU  %MEM     ZEIT+ BEFEHL
    835 iobroker  20   0 5230884 346056  38228 R  24,1   4,3   8:35.69 iobroker.js-con
   1538 iobroker  20   0  888220 121384  36728 S  16,5   1,5   1:43.96 io.history.0
   1779 iobroker  20   0  741644 176716  37052 R   9,9   2,2   5:23.91 io.shelly.0
   1756 iobroker  20   0 5165052 107292  39440 S   8,6   1,3   3:14.71 io.esphome.0
   1792 iobroker  20   0 1028408 162884  43344 R   8,6   2,0   0:57.73 io.admin.0
  20723 iobroker  20   0       0      0      0 Z   8,6   0,0   0:00.26 node
  20731 iobroker  20   0       0      0      0 Z   8,3   0,0   0:00.25 node
  20752 iobroker  20   0       0      0      0 Z   8,3   0,0   0:00.25 node
  20786 iobroker  20   0       0      0      0 Z   8,3   0,0   0:00.25 node
  20717 iobroker  20   0       0      0      0 Z   7,9   0,0   0:00.24 node
  20732 iobroker  20   0       0      0      0 Z   7,9   0,0   0:00.24 node
  20886 iobroker  20   0  332572  43536  32524 S   7,9   0,5   0:00.24 node
  20702 iobroker  20   0       0      0      0 Z   7,6   0,0   0:00.25 node
  20744 iobroker  20   0       0      0      0 Z   7,6   0,0   0:00.23 node
  20757 iobroker  20   0       0      0      0 Z   7,6   0,0   0:00.23 node
  20761 iobroker  20   0       0      0      0 Z   7,6   0,0   0:00.23 node
  20893 iobroker  20   0  530056  44136  32536 S   7,6   0,6   0:00.23 node
  20709 iobroker  20   0       0      0      0 Z   7,3   0,0   0:00.23 node
  20808 iobroker  20   0  530192  43744  32484 S   7,3   0,5   0:00.22 node
  20828 iobroker  20   0  596236  44968  32600 S   7,3   0,6   0:00.22 node
  20887 iobroker  20   0  332560  43540  32536 S   7,3   0,5   0:00.22 node
mal sehn ober sich das System von selbst davon erholt.
@wolfgangfb sagte in Load average IO-Broker auf Raspberry 4 (8GB):
, nachdem iob diag durchgelaufen war, habe ich dann festgestellt, dass der Raspi wieder komplett eingefroren war.
nicht eingefroren, sondern beschäftigt
@wolfgangfb sagte in Load average IO-Broker auf Raspberry 4 (8GB):
load average: 12,95, 7,27, 5,62
und zwar erst in den letzten 5 Minuten hochgeschaukelt.
@wolfgangfb sagte in Load average IO-Broker auf Raspberry 4 (8GB):
obwohl ich echarts offen habe zeigt top:
@wolfgangfb sagte in Load average IO-Broker auf Raspberry 4 (8GB):
0 zombie
@wolfgangfb sagte in Load average IO-Broker auf Raspberry 4 (8GB):
Jetzt nochmal 5 Echarts hinzugefügt
@wolfgangfb sagte in Load average IO-Broker auf Raspberry 4 (8GB):
54 zombie
da ist was massiv faul
@wolfgangfb sagte in Load average IO-Broker auf Raspberry 4 (8GB):
1538 iobroker 20 0 885780 85592 36728 S %(#ff0000)**[2,7]** 1,1 1:10.60 io.history.0steigt auf
@wolfgangfb sagte in Load average IO-Broker auf Raspberry 4 (8GB):
1538 iobroker 20 0 888220 121384 36728 S %(#ff0000)[**16,5**] 1,5 1:43.96 io.history.0Was sind das für Datenreihen?
wo ist die History abgelegt? -
@dp20eic sagte in Load average IO-Broker auf Raspberry 4 (8GB):
@thomas-braun sagte in Load average IO-Broker auf Raspberry 4 (8GB):
Das sieht vom Setup her eigentlich okay aus.
Moin,
nein, denn
/opt/iobroker/iobroker-data:
du: cannot read directory '/opt/iobroker/iobroker-data/esphome.0/.esphome/build/galerie-dallas/.piolibdeps/galerie-dallas/ESPAsyncTCP-esphome': Permission denied
du: cannot read directory '/opt/iobroker/iobroker-data/esphome.0/.esphome/build/galerie-dallas/.piolibdeps/galerie-dallas/ESPAsyncTCP-esphome@1.2.3': Permission denied
du: cannot read directory '/opt/iobroker/iobroker-data/esphome.0/.esphome/build/galerie-dallas/.piolibdeps/galerie-dallas/ESPAsyncWebServer-esphome': Permission denied
du: cannot read directory '/opt/iobroker/iobroker-data/esphome.0/.esphome/build/galerie-dallas/.piolibdeps/galerie-dallas/ArduinoJson': Permission denied
Und auch das
The five largest files in iobroker-data are:
find: '/opt/iobroker/iobroker-data/esphome.0/.esphome/build/galerie-dallas/.piolibdeps/galerie-dallas/ESPAsyncTCP-esphome': Permission denied
find: '/opt/iobroker/iobroker-data/esphome.0/.esphome/build/galerie-dallas/.piolibdeps/galerie-dallas/ESPAsyncTCP-esphome@1.2.3': Permission denied
find: '/opt/iobroker/iobroker-data/esphome.0/.esphome/build/galerie-dallas/.piolibdeps/galerie-dallas/ESPAsyncWebServer-esphome': Permission denied
find: '/opt/iobroker/iobroker-data/esphome.0/.esphome/build/galerie-dallas/.piolibdeps/galerie-dallas/ArduinoJson': Permission denied
Kann dazu führen, dass sich das System damit beschäftigt, und alles andere langsam ist!
Wie bekomme ich das weg?
Für mich ist nicht nachvollziebar, warum ESPHome sich da selbst nicht die Rechte gibt.
drwxrwxr-x+ 3 iobroker iobroker 4096  4. Nov 21:23 src
pi@raspberrypi205:/opt/iobroker/iobroker-data/esphome.0/.esphome/build/galerie-dallas $ cd .piolibdeps/
pi@raspberrypi205:/opt/iobroker/iobroker-data/esphome.0/.esphome/build/galerie-dallas/.piolibdeps $ ls -la
insgesamt 12
drwxrwxr-x+ 3 iobroker iobroker 4096  4. Nov 21:52 .
drwxrwxr-x+ 5 iobroker iobroker 4096  4. Nov 21:27 ..
drwxrwxr-x+ 6 iobroker iobroker 4096  4. Nov 21:30 galerie-dallas
pi@raspberrypi205:/opt/iobroker/iobroker-data/esphome.0/.esphome/build/galerie-dallas/.piolibdeps $ cd galerie-dallas/
pi@raspberrypi205:/opt/iobroker/iobroker-data/esphome.0/.esphome/build/galerie-dallas/.piolibdeps/galerie-dallas $ ls -la
insgesamt 28
drwxrwxr-x+ 6 iobroker iobroker 4096  4. Nov 21:30 .
drwxrwxr-x+ 3 iobroker iobroker 4096  4. Nov 21:52 ..
drwx------+ 5 iobroker iobroker 4096  4. Nov 21:30 ArduinoJson
drwx------+ 6 iobroker iobroker 4096  4. Nov 21:28 ESPAsyncTCP-esphome
drwx------+ 6 iobroker iobroker 4096  4. Nov 21:29 ESPAsyncTCP-esphome@1.2.3
drwx------+ 5 iobroker iobroker 4096  4. Nov 21:28 ESPAsyncWebServer-esphome
-rw-rw-r--+ 1 iobroker iobroker  136  4. Nov 21:27 integrity.dat
pi@raspberrypi205:/opt/iobroker/iobroker-data/esphome.0/.esphome/build/galerie-dallas/.piolibdeps/galerie-dallas $ cd ESPAsyncTCP-esphome@1.2.3/
-bash: cd: ESPAsyncTCP-esphome@1.2.3/: Keine Berechtigung
reicht es da aus, wenn ich von Hand allen ein Leserecht gebe?
@wolfgangfb sagte in Load average IO-Broker auf Raspberry 4 (8GB):
wenn ich von Hand allen ein Leserecht gebe?
nein!
@wolfgangfb sagte in Load average IO-Broker auf Raspberry 4 (8GB):
warum ESPHome sich da selbst nicht die Rechte gibt.
wie soll es?
mal irgendwas als root bearbeitet?@wolfgangfb sagte in Load average IO-Broker auf Raspberry 4 (8GB):
Wie bekomme ich das weg?
@homoran sagte in Load average IO-Broker auf Raspberry 4 (8GB):
@dp20eic dann würde ich @WolfgangFB erst einmal dazu raten
iob stop
iob fix
iob start
auszuführen, in der Hoffnung, dass nur die Rechte verbogen sind.
-
@dp20eic sagte in Load average IO-Broker auf Raspberry 4 (8GB):
@thomas-braun sagte in Load average IO-Broker auf Raspberry 4 (8GB):
Das sieht vom Setup her eigentlich okay aus.
Moin,
nein, denn
/opt/iobroker/iobroker-data:
du: cannot read directory '/opt/iobroker/iobroker-data/esphome.0/.esphome/build/galerie-dallas/.piolibdeps/galerie-dallas/ESPAsyncTCP-esphome': Permission denied
du: cannot read directory '/opt/iobroker/iobroker-data/esphome.0/.esphome/build/galerie-dallas/.piolibdeps/galerie-dallas/ESPAsyncTCP-esphome@1.2.3': Permission denied
du: cannot read directory '/opt/iobroker/iobroker-data/esphome.0/.esphome/build/galerie-dallas/.piolibdeps/galerie-dallas/ESPAsyncWebServer-esphome': Permission denied
du: cannot read directory '/opt/iobroker/iobroker-data/esphome.0/.esphome/build/galerie-dallas/.piolibdeps/galerie-dallas/ArduinoJson': Permission denied
Und auch das
The five largest files in iobroker-data are:
find: '/opt/iobroker/iobroker-data/esphome.0/.esphome/build/galerie-dallas/.piolibdeps/galerie-dallas/ESPAsyncTCP-esphome': Permission denied
find: '/opt/iobroker/iobroker-data/esphome.0/.esphome/build/galerie-dallas/.piolibdeps/galerie-dallas/ESPAsyncTCP-esphome@1.2.3': Permission denied
find: '/opt/iobroker/iobroker-data/esphome.0/.esphome/build/galerie-dallas/.piolibdeps/galerie-dallas/ESPAsyncWebServer-esphome': Permission denied
find: '/opt/iobroker/iobroker-data/esphome.0/.esphome/build/galerie-dallas/.piolibdeps/galerie-dallas/ArduinoJson': Permission denied
Kann dazu führen, dass sich das System damit beschäftigt, und alles andere langsam ist!
Wie bekomme ich das weg?
Für mich ist nicht nachvollziebar, warum ESPHome sich da selbst nicht die Rechte gibt.
drwxrwxr-x+ 3 iobroker iobroker 4096  4. Nov 21:23 src
pi@raspberrypi205:/opt/iobroker/iobroker-data/esphome.0/.esphome/build/galerie-dallas $ cd .piolibdeps/
pi@raspberrypi205:/opt/iobroker/iobroker-data/esphome.0/.esphome/build/galerie-dallas/.piolibdeps $ ls -la
insgesamt 12
drwxrwxr-x+ 3 iobroker iobroker 4096  4. Nov 21:52 .
drwxrwxr-x+ 5 iobroker iobroker 4096  4. Nov 21:27 ..
drwxrwxr-x+ 6 iobroker iobroker 4096  4. Nov 21:30 galerie-dallas
pi@raspberrypi205:/opt/iobroker/iobroker-data/esphome.0/.esphome/build/galerie-dallas/.piolibdeps $ cd galerie-dallas/
pi@raspberrypi205:/opt/iobroker/iobroker-data/esphome.0/.esphome/build/galerie-dallas/.piolibdeps/galerie-dallas $ ls -la
insgesamt 28
drwxrwxr-x+ 6 iobroker iobroker 4096  4. Nov 21:30 .
drwxrwxr-x+ 3 iobroker iobroker 4096  4. Nov 21:52 ..
drwx------+ 5 iobroker iobroker 4096  4. Nov 21:30 ArduinoJson
drwx------+ 6 iobroker iobroker 4096  4. Nov 21:28 ESPAsyncTCP-esphome
drwx------+ 6 iobroker iobroker 4096  4. Nov 21:29 ESPAsyncTCP-esphome@1.2.3
drwx------+ 5 iobroker iobroker 4096  4. Nov 21:28 ESPAsyncWebServer-esphome
-rw-rw-r--+ 1 iobroker iobroker  136  4. Nov 21:27 integrity.dat
pi@raspberrypi205:/opt/iobroker/iobroker-data/esphome.0/.esphome/build/galerie-dallas/.piolibdeps/galerie-dallas $ cd ESPAsyncTCP-esphome@1.2.3/
-bash: cd: ESPAsyncTCP-esphome@1.2.3/: Keine Berechtigung
reicht es da aus, wenn ich von Hand allen ein Leserecht gebe?
@wolfgangfb sagte in Load average IO-Broker auf Raspberry 4 (8GB):
Für mich ist nicht nachvollziebar, warum ESPHome sich da selbst nicht die Rechte gibt.
Du fuhrwerkst da augenscheinlich mit falschen usern/Rechten herum.
Es gibt auch kein sinnvolles Verzeichnis 'Wolfgang' an der Stelle:pi@raspberrypi205:/opt/iobroker/Wolfgang $Was soll das werden? Ein home-Verzeichnis für einen user 'Wolfgang'?
-
@thomas-braun sagte in Load average IO-Broker auf Raspberry 4 (8GB):
Das sieht vom Setup her eigentlich okay aus.
Moin,
nein, denn
/opt/iobroker/iobroker-data:
du: cannot read directory '/opt/iobroker/iobroker-data/esphome.0/.esphome/build/galerie-dallas/.piolibdeps/galerie-dallas/ESPAsyncTCP-esphome': Permission denied
du: cannot read directory '/opt/iobroker/iobroker-data/esphome.0/.esphome/build/galerie-dallas/.piolibdeps/galerie-dallas/ESPAsyncTCP-esphome@1.2.3': Permission denied
du: cannot read directory '/opt/iobroker/iobroker-data/esphome.0/.esphome/build/galerie-dallas/.piolibdeps/galerie-dallas/ESPAsyncWebServer-esphome': Permission denied
du: cannot read directory '/opt/iobroker/iobroker-data/esphome.0/.esphome/build/galerie-dallas/.piolibdeps/galerie-dallas/ArduinoJson': Permission denied
Und auch das
The five largest files in iobroker-data are:
find: '/opt/iobroker/iobroker-data/esphome.0/.esphome/build/galerie-dallas/.piolibdeps/galerie-dallas/ESPAsyncTCP-esphome': Permission denied
find: '/opt/iobroker/iobroker-data/esphome.0/.esphome/build/galerie-dallas/.piolibdeps/galerie-dallas/ESPAsyncTCP-esphome@1.2.3': Permission denied
find: '/opt/iobroker/iobroker-data/esphome.0/.esphome/build/galerie-dallas/.piolibdeps/galerie-dallas/ESPAsyncWebServer-esphome': Permission denied
find: '/opt/iobroker/iobroker-data/esphome.0/.esphome/build/galerie-dallas/.piolibdeps/galerie-dallas/ArduinoJson': Permission denied
Kann dazu führen, dass sich das System damit beschäftigt, und alles andere langsam ist!
An den TE, achte darauf, dass Dein System ohne solche Fehler läuft, wie ich oben schon geschrieben habe,
Disk I/Okann die ganze Kiste langsam machen.VG
Bernd@dp20eic sagte in Load average IO-Broker auf Raspberry 4 (8GB):
Kann dazu führen, dass sich das System damit beschäftigt, und alles andere langsam ist!
Das ist aber kein Fehler, weil
iob diaghalt mit so wenig Rechten wie möglich um sich wirft. Und i.d.R. reicht die Gruppenzugehörigkeit des ausführenden users zur Gruppeiobrokeraus. Hier nicht, weil esphome offenbar die build-Verzeichnisse nur dem ausführenden useriobrokervermacht. Ist ja auch sinnvoll.
Und treibt auch die Load nicht so ins exorbitante wie bei dem System. -
@dp20eic sagte in Load average IO-Broker auf Raspberry 4 (8GB):
Kann dazu führen, dass sich das System damit beschäftigt, und alles andere langsam ist!
Das ist aber kein Fehler, weil
iob diaghalt mit so wenig Rechten wie möglich um sich wirft. Und i.d.R. reicht die Gruppenzugehörigkeit des ausführenden users zur Gruppeiobrokeraus. Hier nicht, weil esphome offenbar die build-Verzeichnisse nur dem ausführenden useriobrokervermacht. Ist ja auch sinnvoll.
Und treibt auch die Load nicht so ins exorbitante wie bei dem System.@thomas-braun sagte in Load average IO-Broker auf Raspberry 4 (8GB):
build-Verzeichnisse nur dem ausführenden user iobroker vermacht. Ist ja auch sinnvoll.
Moin,
mag ja alles sein, aber der User hatte die benötigten Rechte
*** User and Groups ***
pi
/home/pi
pi adm dialout cdrom sudo audio video plugdev games users input render netdev lpadmin gpio i2c spi iobroker
Ich habe mein
esp.homemal wieder gestartet, und wenn ichiob diaglaufen lasse, dann bekomme ich solche Meldungen nicht im Output.
Was ich damit eigentlich dem TE an die Hand geben wollte, ist nicht nach Flöhen zu suchen, wenn da noch der Elefant im Raum steht.VG
Bernd
Hey! Du scheinst an dieser Unterhaltung interessiert zu sein, hast aber noch kein Konto.
Hast du es satt, bei jedem Besuch durch die gleichen Beiträge zu scrollen? Wenn du dich für ein Konto anmeldest, kommst du immer genau dorthin zurück, wo du zuvor warst, und kannst dich über neue Antworten benachrichtigen lassen (entweder per E-Mail oder Push-Benachrichtigung). Du kannst auch Lesezeichen speichern und Beiträge positiv bewerten, um anderen Community-Mitgliedern deine Wertschätzung zu zeigen.
Mit deinem Input könnte dieser Beitrag noch besser werden 💗
Registrieren Anmelden275
Online33.0k
Benutzer83.4k
Themen1.3m
Beiträge