NEWS


TibberLink Adapter
-
Hi @reblausgt ,
danke für Dein Feedback.
Klar, bau es gerne ein. Ich habe das ja hier gepostet, weil ich dachte, dass es auch für andere praktisch sein kann.
Mal was anderes.... die X-Achse mit Strings war ein Entwurf der 1h Zeitscheiben.... jetzt, mit den 15 Minuten Scheiben überlege ich ob man das doch lieber im category time ändern sollte.... das zerschmeißt dann halt alles was man sich da schon an template gebastelt hatte.... Ist das ne Katastrophe? oder Überwiegen die Vorteile?
-
Ich brauche mal ne Erklärung zum "Batterie laden" Kanal nach der 15min Umstellung :-)
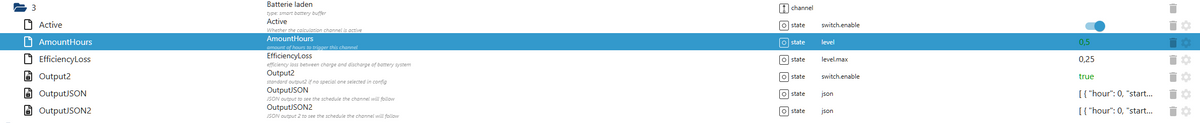
Wenn ich die AmountHours auf z.B. "0,5" stelle, schaltet er dann jede verfügbaren 30min Slot, wo der Preis 25% unter dem höchsten Tagespreis ist auf true? (den highest nutze ich nicht)
-
@schimi said in TibberLink Adapter:
Ich brauche mal ne Erklärung zum "Batterie laden" Kanal nach der 15min Umstellung :-)
Er sucht die 2 billigsten 15 Minuten und lädt die Batterie. Dann nimmt er den Preis der teuersten Phase = die teuerste Wattstunde im Speicher und rechnet dazu den Wirkungsgradverlust hinzu.... alles was da drunter liegt sperrt er das Entladen, was darüber liegt wird entladen.
-
Mal was anderes.... die X-Achse mit Strings war ein Entwurf der 1h Zeitscheiben.... jetzt, mit den 15 Minuten Scheiben überlege ich ob man das doch lieber im category time ändern sollte.... das zerschmeißt dann halt alles was man sich da schon an template gebastelt hatte.... Ist das ne Katastrophe? oder Überwiegen die Vorteile?
Gute Frage. Für mich war das mein erster Berührpunkt mit ECharts. So, wie es jetzt ist, passt es bei mir mit der Skalierung relativ gut. Je nach Fenstergröße auf unterschiedlichen Größen wählt ECharts hier recht vernünftig, welche Punkte auf der Skala weggelassen werden. Beispielsweise sehe ich in dem kleinen Ausschnitt, den ich dem Chart in meiner Visualisierung gönne, die vollen Stunden und wenn ich das Chart alleine im Browser Fullscreen öffne auch die Viertelstunden.
Ich habe mir aber jetzt gerade eine Echart Demo angeschaut (https://echarts.apache.org/examples/en/editor.html?c=area-time-axis), da lässt sich in dem Chart mit dem Mausrad zoomen. Das geht bei uns nicht. Ob die String-Skala der Grund ist, weiß ich nicht. Das könnte ich mir aber vorstellen.
Was wohl in jedem Fall schöner wäre: Es wäre halt der Weg, den ECharts für Zeitserien vorsieht. Das Datum würde nicht ständig wiederholt, sondern nur einmal angezeigt und ansonsten nur die Uhrzeit. Die X-Achse wäre also etwas übersichtlicher.
Mir persönlich wäre die Änderung nicht wichtig, das Template wäre aber leicht anzupassen. Ich kann da bei Bedarf auch gerne unterstützen. Wer sich beispielsweise veränderte Tooltips eingebaut hat, müsste halt selbst noch mal Hand anlegen. Ich würde aber vermuten, wer das hinbekommen hat, wird auch an dem Umbau nicht scheitern.
Übrigens: Ich vermute, dass es einige Nutzer gibt, die mit ECharts keine Berührpunkte hatten und die in ihrer Automatisierung nur für die Tibberpreise benutzen. Dann ist es schon etwas knifflig, die URL für die generierten Charts herauszufinden und die Templates in den Editor zu kopieren könnte auf manche auch etwas abschreckend wirken. Vermutlich benutzen die Meisten eines der Standard Templates ohne Veränderungen.
Da könnte es aus meiner Sicht helfen, wenn die URL im Adapter direkt angezeigt würde und es eine Auswahl der Art "Standard Darstellung", "alternative Darstellung" oder "benutzerdefinierte Darstellung" gäbe und damit der ganze Flexchart Hintergrund samt Erklärungen, Beispielen und Editor nur sichtbar wird, wenn man zuvor "benutzerdefiniert" ausgewählt hat.
-
ist das was?
{ backgroundColor: "#ffffff", title: { text: "Tibber Preis", left: "center", textStyle: { color: "#333", fontSize: 16 } }, tooltip: { trigger: "axis", axisPointer: { type: "cross" }, valueFormatter: value => value.toFixed(3) + " €" }, grid: { left: "8%", right: "4%", top: "10%", bottom: "10%" }, xAxis: { type: "time", name: "Zeit", axisLabel: { formatter: value => { const date = new Date(value); const hours = date.getHours().toString().padStart(2, "0"); const minutes = date.getMinutes().toString().padStart(2, "0"); return hours + ":" + minutes; } }, splitLine: { show: false } }, yAxis: { type: "value", name: "Preis (€)", axisLabel: { formatter: "{value} €" }, splitLine: { show: true } }, visualMap: { show: false, min: 0.2, max: 0.4, inRange: { color: ["green", "yellow", "red"] } }, series: [ { name: "Preis", type: "line", symbol: "none", step: "end", data: %%yAxisData%%, // Format: [ [timestamp, value], [timestamp, value], ... ] markArea: { itemStyle: { color: "rgba(120, 200, 120, 0.2)" }, data: [ %%CalcChannelsData%% ] // z. B. [[{ xAxis: "2025-11-04T10:00" }, { xAxis: "2025-11-04T14:00" }]] }, markLine: { symbol: "none", label: { formatter: "Jetzt", position: "end", color: "#333" }, lineStyle: { color: "red", type: "solid" }, data: [ { xAxis: new Date().toISOString() } ] } } ] } -
hehe, dachte ich bin mal "clever" und jag es einfach durch ChatGPT :D
scheint wohl nicht geklappt zu haben....
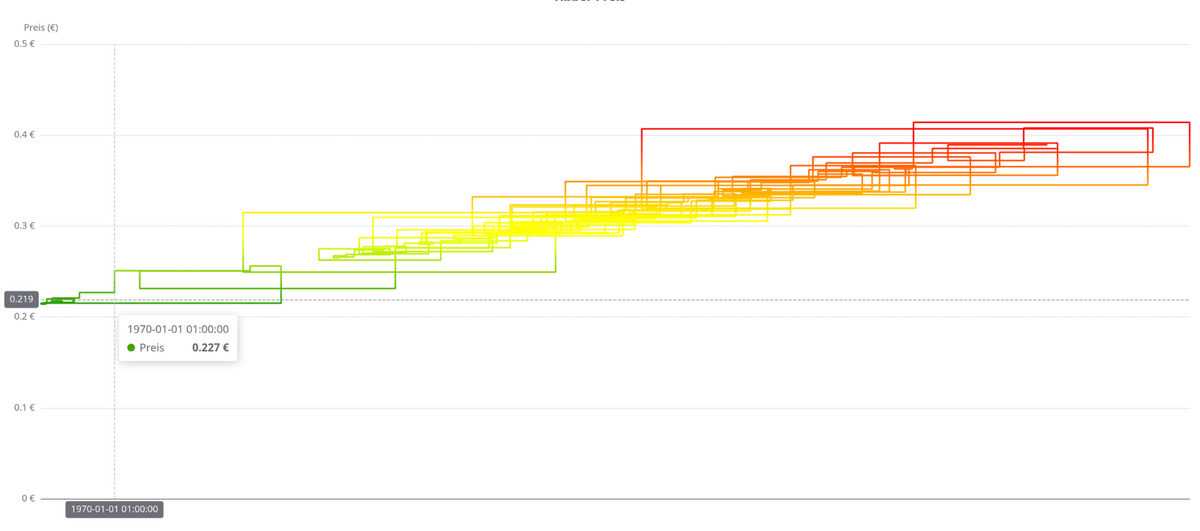
besser? :D
{
	backgroundColor: "#ffffff",

	title: {
		text: "Tibber Preis",
		left: "center",
		textStyle: { color: "#333", fontSize: 16 }
	},

	tooltip: {
		trigger: "axis",
		axisPointer: { type: "cross" },
		valueFormatter: value => value.toFixed(3) + " €"
	},

	grid: {
		left: "8%", right: "4%", top: "10%", bottom: "10%"
	},

	xAxis: {
		type: "time",
		name: "Zeit",
		axisLabel: {
			formatter: value => {
				const date = new Date(value);
				const hours = date.getHours().toString().padStart(2, "0");
				const minutes = date.getMinutes().toString().padStart(2, "0");
				return hours + ":" + minutes;
			}
		},
		splitLine: { show: false }
	},

	yAxis: {
		type: "value",
		name: "Preis (€)",
		axisLabel: { formatter: "{value} €" },
		splitLine: { show: true }
	},

	visualMap: {
		show: false,
		min: 0.2,
		max: 0.4,
		inRange: {
			color: ["green", "yellow", "red"]
		}
	},

	series: [
		{
			name: "Preis",
			type: "line",
			symbol: "none",
			smooth: true,          // <<< weiche Kurve statt Stufen
			data: %%yAxisData%%,   // Format: [ [timestamp, value], [timestamp, value], ... ]

			lineStyle: {
				width: 2
			},

			markArea: {
				itemStyle: { color: "rgba(120, 200, 120, 0.2)" },
				data: [ %%CalcChannelsData%% ]
			},

			markLine: {
				symbol: "none",
				label: {
					formatter: "Jetzt",
					position: "end",
					color: "#333"
				},
				lineStyle: { color: "red", type: "solid" },
				data: [
					{
						xAxis: new Date().toISOString()
					}
				]
			}
		}
	]
}
Falls das auch nichts ist, gebe ich auf ;-)
-
hehe, dachte ich bin mal "clever" und jag es einfach durch ChatGPT :D
scheint wohl nicht geklappt zu haben....
besser? :D
{
	backgroundColor: "#ffffff",

	title: {
		text: "Tibber Preis",
		left: "center",
		textStyle: { color: "#333", fontSize: 16 }
	},

	tooltip: {
		trigger: "axis",
		axisPointer: { type: "cross" },
		valueFormatter: value => value.toFixed(3) + " €"
	},

	grid: {
		left: "8%", right: "4%", top: "10%", bottom: "10%"
	},

	xAxis: {
		type: "time",
		name: "Zeit",
		axisLabel: {
			formatter: value => {
				const date = new Date(value);
				const hours = date.getHours().toString().padStart(2, "0");
				const minutes = date.getMinutes().toString().padStart(2, "0");
				return hours + ":" + minutes;
			}
		},
		splitLine: { show: false }
	},

	yAxis: {
		type: "value",
		name: "Preis (€)",
		axisLabel: { formatter: "{value} €" },
		splitLine: { show: true }
	},

	visualMap: {
		show: false,
		min: 0.2,
		max: 0.4,
		inRange: {
			color: ["green", "yellow", "red"]
		}
	},

	series: [
		{
			name: "Preis",
			type: "line",
			symbol: "none",
			smooth: true,          // <<< weiche Kurve statt Stufen
			data: %%yAxisData%%,   // Format: [ [timestamp, value], [timestamp, value], ... ]

			lineStyle: {
				width: 2
			},

			markArea: {
				itemStyle: { color: "rgba(120, 200, 120, 0.2)" },
				data: [ %%CalcChannelsData%% ]
			},

			markLine: {
				symbol: "none",
				label: {
					formatter: "Jetzt",
					position: "end",
					color: "#333"
				},
				lineStyle: { color: "red", type: "solid" },
				data: [
					{
						xAxis: new Date().toISOString()
					}
				]
			}
		}
	]
}
Falls das auch nichts ist, gebe ich auf ;-)
@schimi sagte in TibberLink Adapter:
scheint wohl nicht geklappt zu haben....
Schwer zu sagen. Falls Du das hier erreichen wolltest, hat es geklappt:
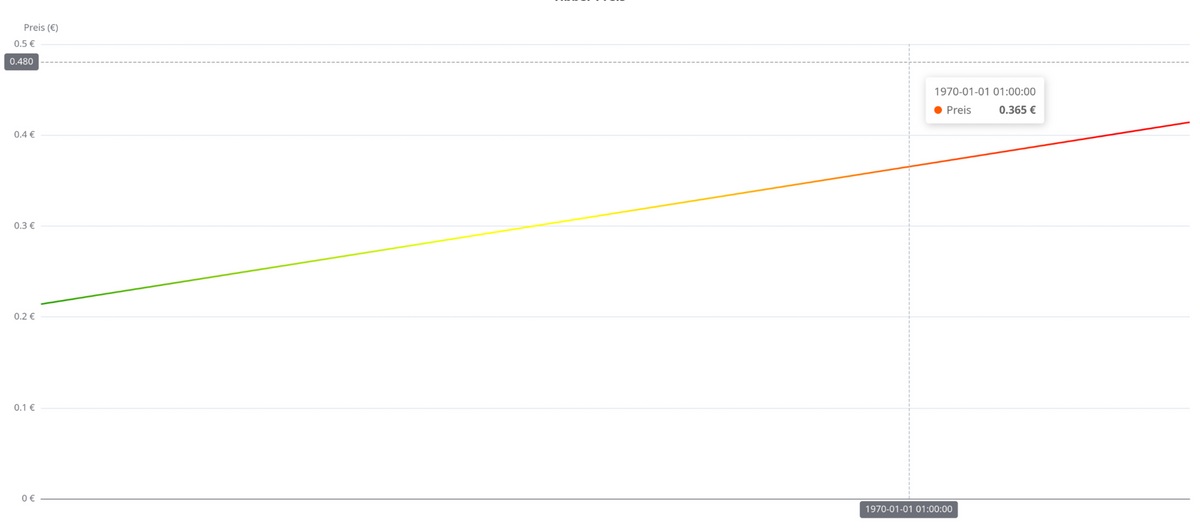
Was ist denn Dein Ziel?
-
@schimi sagte in TibberLink Adapter:
scheint wohl nicht geklappt zu haben....
Schwer zu sagen. Falls Du das hier erreichen wolltest, hat es geklappt:
Was ist denn Dein Ziel?
@hansjochen sieht nicht richtig aus :D
wollte dein script (für welche die es brauchen, ich habe aktuell keine Verwendung für die Funktion)
umbauen das unten nur Uhrzeit angezeigt wird und nicht immer das Datum (quasi wie ihr danach drüber geschrieben habt) -
@hansjochen sieht nicht richtig aus :D
wollte dein script (für welche die es brauchen, ich habe aktuell keine Verwendung für die Funktion)
umbauen das unten nur Uhrzeit angezeigt wird und nicht immer das Datum (quasi wie ihr danach drüber geschrieben habt)Okay, das fällt dann wohl in die Kategorie "gut gemeint" :)
Das Verhalten von Hand nachzubilden, solange der Adapter hier noch auf Strings basiert, wäre ziemlich müßig. Echarts macht das ja schon automatisch, wenn @ReblausGT , wie er es hier angedacht hat, den Adapter auf Datumsobjekte umstellt. Das sollte dann aber synchron passieren: Im Adapter und in den Templates.
-
@schimi said in TibberLink Adapter:
Ich brauche mal ne Erklärung zum "Batterie laden" Kanal nach der 15min Umstellung :-)
Er sucht die 2 billigsten 15 Minuten und lädt die Batterie. Dann nimmt er den Preis der teuersten Phase = die teuerste Wattstunde im Speicher und rechnet dazu den Wirkungsgradverlust hinzu.... alles was da drunter liegt sperrt er das Entladen, was darüber liegt wird entladen.
@reblausgt also nicht zusammenhängende 15 min (30min am stück)... sondern einfach nur 2 x 15min egal wie verteilt?
wenn ich "AmountHours" auf 0.75 stelle, dann wären es 3 x 15min?
Habe das zuerst so verstanden, das er schaut das er (bei 0.5) 30min am stück findet die 25% günstiger als der max preis ist...
-
@reblausgt also nicht zusammenhängende 15 min (30min am stück)... sondern einfach nur 2 x 15min egal wie verteilt?
wenn ich "AmountHours" auf 0.75 stelle, dann wären es 3 x 15min?
Habe das zuerst so verstanden, das er schaut das er (bei 0.5) 30min am stück findet die 25% günstiger als der max preis ist...
@schimi wie kommst du auf 25%?
Es ist der günstigste Preis vom Tag. -
@schimi wie kommst du auf 25%?
Es ist der günstigste Preis vom Tag.@bakerman23 beim "Batterie laden"-kanal?
Dann sollte die Erklärung überarbeitet werden (vielleicht mit einem Beispiel zu den Einstellungen), habe ich dann total anders/falsch verstanden?
-
@reblausgt also nicht zusammenhängende 15 min (30min am stück)... sondern einfach nur 2 x 15min egal wie verteilt?
wenn ich "AmountHours" auf 0.75 stelle, dann wären es 3 x 15min?
Habe das zuerst so verstanden, das er schaut das er (bei 0.5) 30min am stück findet die 25% günstiger als der max preis ist...
@Schimi said in TibberLink Adapter:
@reblausgt also nicht zusammenhängende 15 min (30min am stück)... sondern einfach nur 2 x 15min egal wie verteilt?
0.75 sind die 3 besten 15 Minuten zum Laden genutzt.... Entladen wird nur in Zeiten wenn der Preis höher ist wie 1 + Wirkungsgradverlust des Stroms den du geladen hast.....
Aus dem Source Code (hours sind jetzt 15 minuten... muss ich mal n der Doku ändern):
//#region *** SPECIFICATION Smart Battery Buffer *** /* Summary: Develop a channel that categorizes hourly energy prices into three groups—cheap, normal, and expensive. The categorization is based on the total price of each hour, considering a efficiency loss of a battery system. Detailed Description: The system has an algorithm to organize hourly energy prices, providing users with a clear understanding of price dynamics. The algorithm follows these steps: - Sort by Total Price: Sort hourly rates in ascending order based on the total price. - Identify Cheap Hours: Starting with the cheapest hour, include hours in the cheap category if the total price is lower than the total price of the most expensive hour minus a minimum distance (MinDelta). Hereby calculate MinDelta based on the average total price of the cheap hours and a user-defined efficiency loss of a battery system. Collect cheap hours up to a maximum number of maxCheapCount - Determine the Most Expensive Hour Among the Cheap: Identify the hour with the highest total price among the cheap hours. - Classify Normal and Expensive Hours: Hours not classified as cheap are further categorized as follows: Normal Hours: Total price is lower than MinDelta plus the highest total price among the cheap hours. Expensive Hours: Total price is higher than MinDelta plus the highest total price among the cheap hours. User Customization: Allow users to specify the maximum number of cheap hours they want to identify (maxCheapCount) and define the efficiency loss (efficiencyLoss). Output: - Not Active - disable battery charging (OFF-1) and also disable feed into home energy system (OFF-2) - Cheap Hours - enable battery charging (ON-1) and disable feed into home energy system (OFF-2) - Normal Hours - disable battery charging (OFF-1) and also disable feed into home energy system (OFF-2) - Expensive Hours - disable battery charging (OFF-1) and enable feed into home energy system (ON-2) */ //#endregion -
@Schimi said in TibberLink Adapter:
@reblausgt also nicht zusammenhängende 15 min (30min am stück)... sondern einfach nur 2 x 15min egal wie verteilt?
0.75 sind die 3 besten 15 Minuten zum Laden genutzt.... Entladen wird nur in Zeiten wenn der Preis höher ist wie 1 + Wirkungsgradverlust des Stroms den du geladen hast.....
Aus dem Source Code (hours sind jetzt 15 minuten... muss ich mal n der Doku ändern):
//#region *** SPECIFICATION Smart Battery Buffer *** /* Summary: Develop a channel that categorizes hourly energy prices into three groups—cheap, normal, and expensive. The categorization is based on the total price of each hour, considering a efficiency loss of a battery system. Detailed Description: The system has an algorithm to organize hourly energy prices, providing users with a clear understanding of price dynamics. The algorithm follows these steps: - Sort by Total Price: Sort hourly rates in ascending order based on the total price. - Identify Cheap Hours: Starting with the cheapest hour, include hours in the cheap category if the total price is lower than the total price of the most expensive hour minus a minimum distance (MinDelta). Hereby calculate MinDelta based on the average total price of the cheap hours and a user-defined efficiency loss of a battery system. Collect cheap hours up to a maximum number of maxCheapCount - Determine the Most Expensive Hour Among the Cheap: Identify the hour with the highest total price among the cheap hours. - Classify Normal and Expensive Hours: Hours not classified as cheap are further categorized as follows: Normal Hours: Total price is lower than MinDelta plus the highest total price among the cheap hours. Expensive Hours: Total price is higher than MinDelta plus the highest total price among the cheap hours. User Customization: Allow users to specify the maximum number of cheap hours they want to identify (maxCheapCount) and define the efficiency loss (efficiencyLoss). Output: - Not Active - disable battery charging (OFF-1) and also disable feed into home energy system (OFF-2) - Cheap Hours - enable battery charging (ON-1) and disable feed into home energy system (OFF-2) - Normal Hours - disable battery charging (OFF-1) and also disable feed into home energy system (OFF-2) - Expensive Hours - disable battery charging (OFF-1) and enable feed into home energy system (ON-2) */ //#endregion@ReblausGT said in TibberLink Adapter:
Entladen wird nur in Zeiten wenn der Preis höher ist wie 1 + Wirkungsgradverlust des Stroms den du geladen hast.....
Gelöscht
-
Moin,
ich wollte mich hier ganz herzlich bedanken für den tollen Adapter und auch für die Templates der Charts. Das ist wirklich toll gemacht!
Dank eurer Arbeit habe ich jetzt (mit ein bisschen Hilfe von AI...) für mich auch einen Chart erstellen können, wie ich ihn gerne hätte:
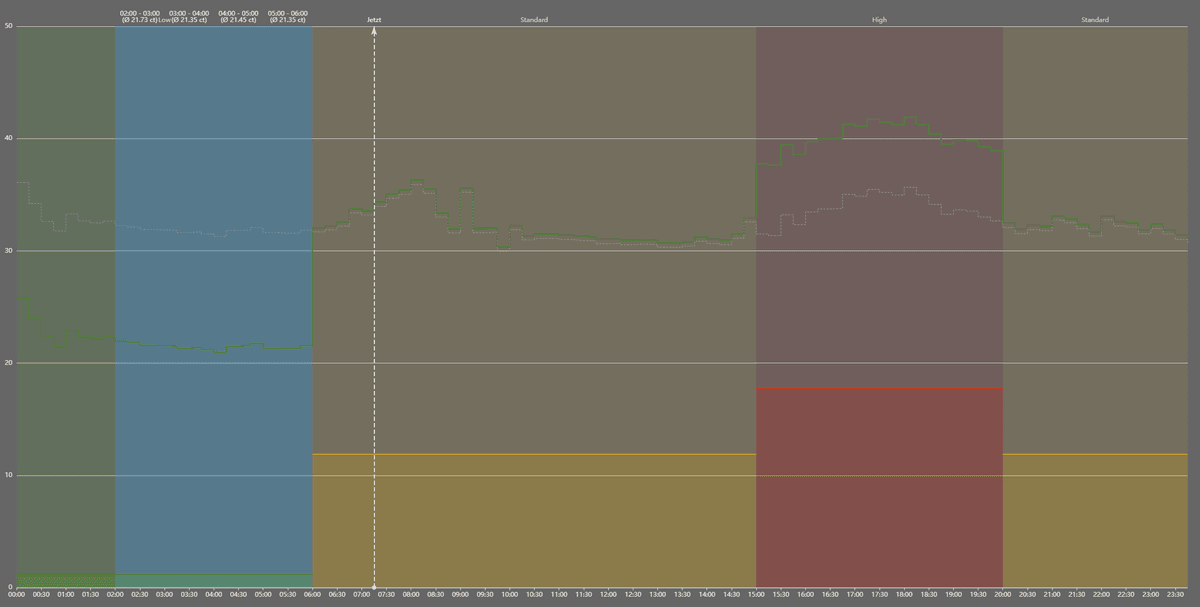
Für den Chart berechne ich den 14a Gesamtpreis selbst, dazu lasse ich mir die Entgelttarife von Westnetz für 14a anzeigen und noch den Normalpreis als gestrichelte Linie.
Dazu werden die besten (einzelnen) 4 Stunden mit Durchschnittspreis markiert.Vielen Dank!
-
Moin,
ich wollte mich hier ganz herzlich bedanken für den tollen Adapter und auch für die Templates der Charts. Das ist wirklich toll gemacht!
Dank eurer Arbeit habe ich jetzt (mit ein bisschen Hilfe von AI...) für mich auch einen Chart erstellen können, wie ich ihn gerne hätte:
Für den Chart berechne ich den 14a Gesamtpreis selbst, dazu lasse ich mir die Entgelttarife von Westnetz für 14a anzeigen und noch den Normalpreis als gestrichelte Linie.
Dazu werden die besten (einzelnen) 4 Stunden mit Durchschnittspreis markiert.Vielen Dank!
-
Bei der Rechnung denke ich schon (ich werde erst diesen Monat umgestellt).
Ich bin mir aber nicht sicher, ob sie das bei der API Abfrage über den Adapter auch schon berücksichtigen.
Wenn es soweit ist, kann ich ja berichten.
Es sei denn, jemand hier kann das schon bestätigen... -
Ich sehe den normalen Preis, und bei der Monatsabrechnung wird dann die Netzentgeltreduzierung abgezogen.
800
Online32.4k
Users81.6k
Topics1.3m
Posts