/************************************************************************************************************************************************************************
Version: 1.0.5
created by Scrounger
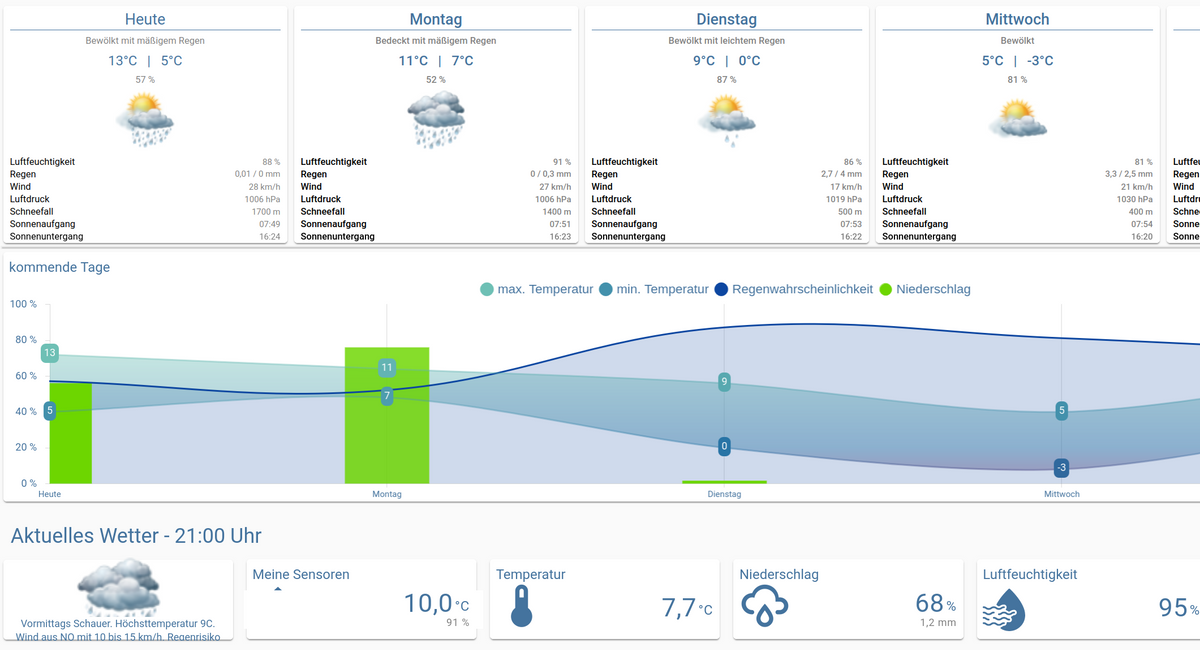
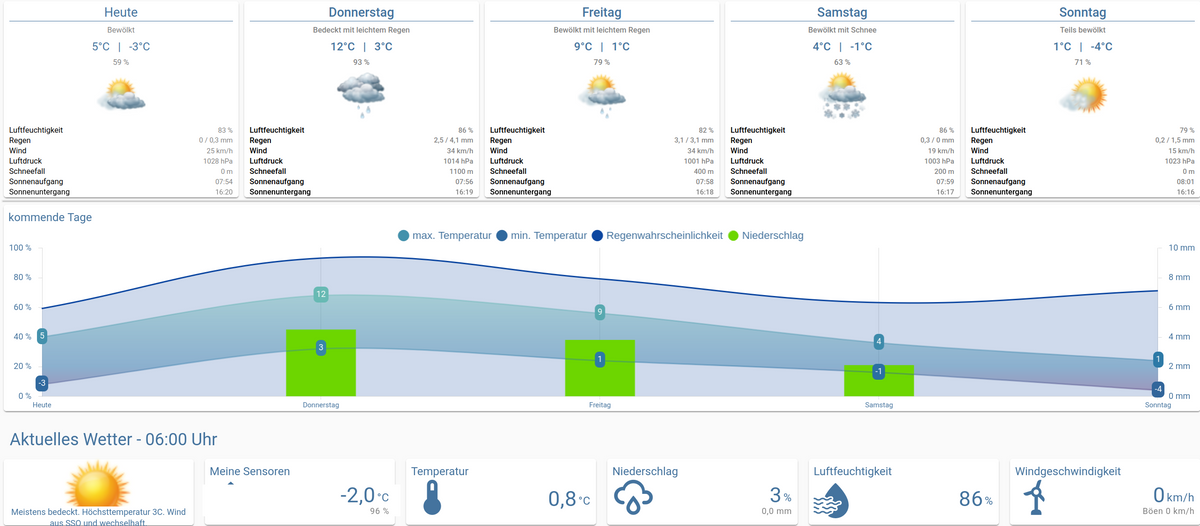
Dieses Skript erzeugt json strings um Wetter Informationen im VIS mit den Material Design Widgets darzustellen
=========================================================================================================================================================================
!!! Voraussetzungen !!!
* Material Design Widgets >= 0.3.6
* DasWetter >= 3.0.1
* weatherunderground >= 3.2.1
* Pollenflug >= 1.0.4 (optional in Skript Einstellung de- / aktivierbar)
* Javascript Adapter >= 4.6.1
* Javascript Adapter NPM Module: moment, moment-timezone, moment-duration-format, chroma-js
=========================================================================================================================================================================
--- Links ---
* Support: https://forum.iobroker.net/topic/32232/material-design-widgets-wetter-view
* Github: https://github.com/Scrounger/ioBroker.vis-materialdesign/tree/master/examples/Weather
=========================================================================================================================================================================
--- Changelog ---
* 1.0.0: Initial release
* 1.0.1: Trigger bug fixes
* 1.0.2: enable / disable option for Pollenflug Adapter added
* 1.0.3: new feature of Material Design Widgets 0.3.6 added: auto show data labels on chart
* 1.0.4: bug fix graphs y-Axis range, Javascript Adapter >= 4.6.1 needed, DasWetter >= 3.0.1 needed
* 1.0.5: bug fix Windrichtung
************************************************************************************************************************************************************************/
/************************************************************************************************************************************************************************
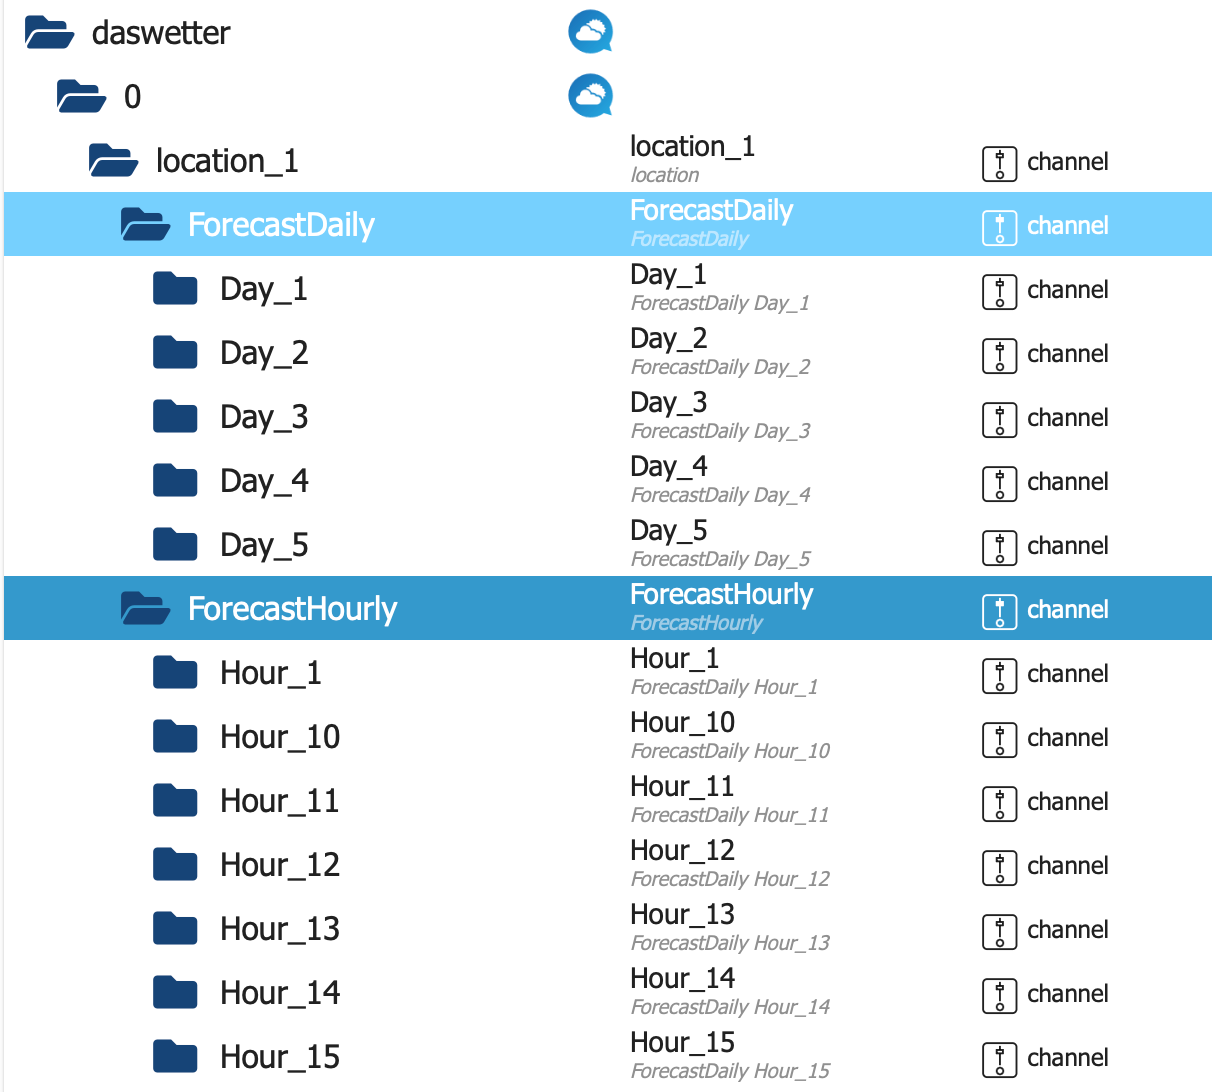
Patched for DasWetter v4+ structure (ForecastDaily + ForecastHourly)
Based on Scrounger Script 1.0.5 (Material Design Widgets Wetter View)
JoJo-Patch 2026-01-26: Works with:
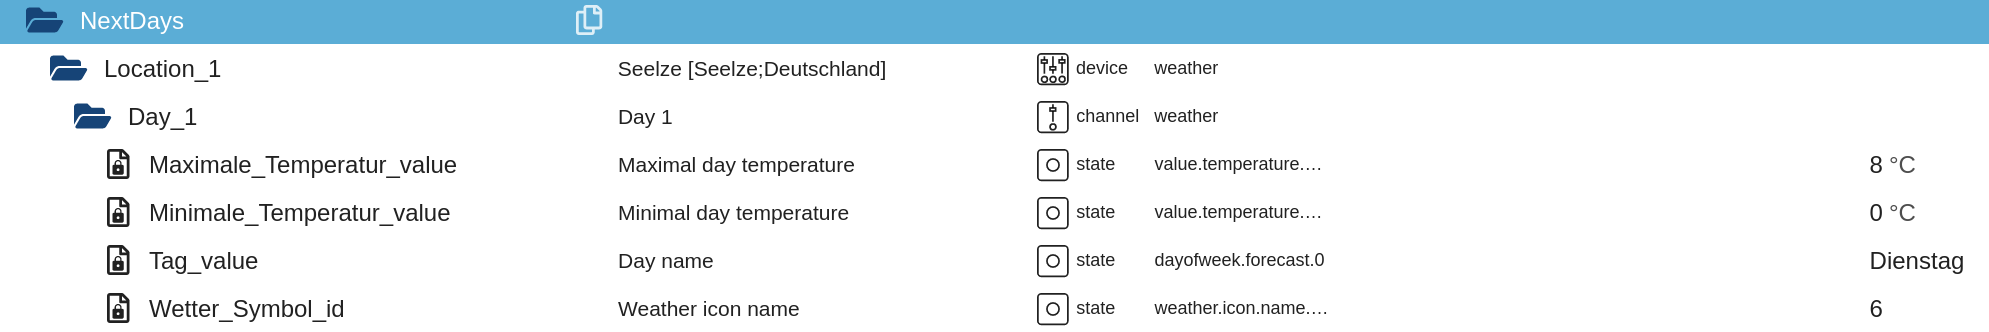
- daswetter.0.location_1.ForecastDaily.Day_1..Day_5.*
- daswetter.0.location_1.ForecastHourly.Current.*
- daswetter.0.location_1.ForecastHourly.Hour_1..Hour_24.*
Notes:
- No dependency on weatherunderground for core functionality anymore.
- 24h Chart uses ForecastHourly.Hour_1..Hour_24 (next 24 hours).
- Daily cards use ForecastDaily fields you posted.
************************************************************************************************************************************************************************/
// ===================== Script Settings =====================
let dasWetter_Tage = 5;
let idDatenpunktPrefix = '0_userdata.0'; // '0_userdata.0' or 'javascript.x'
let idDatenPunktStrukturPrefix = 'vis.MaterialDesignWidgets.Wetter';
// own sensor (optional)
let idSensor_Temperatur = 'hm-rpc.1.000EDF29AF0CB5.1.ACTUAL_TEMPERATURE';
let idSensor_Luftfeuchtigkeit = 'hm-rpc.1.000EDF29AF0CB5.1.HUMIDITY';
// chart colors
let color_graph_temperatur_verlauf = [
{ value: -20, color: '#5b2c6f' },
{ value: 0, color: '#2874a6' },
{ value: 14, color: '#73c6b6' },
{ value: 22, color: '#008000' },
{ value: 27, color: '#FFA500' },
{ value: 35, color: '#FF0000' }
];
// let color_graph_regenwahrscheinlichkeit = '#0d47a1';
let color_graph_regenwahrscheinlichkeit = '#8ae8f9';
let color_graph_niederschlag = '#6dd600';
// Pollen (optional)
let enablePollenFlug = true;
let idPollenFlugRegion = 'pollenflug.0.region#41.summary';
let pollenFlugFarben = ['#57bb8a', '#94bd77', '#d4c86a', '#e9b861', '#e79a69', '#dd776e', 'red'];
let pollenFlugText = ['keine', 'kaum', 'gering', 'mäßig', 'mittel', 'hoch', 'stark'];
// ===================== Derived IDs =====================
let idIconList_Vorschau = `${idDatenpunktPrefix}.${idDatenPunktStrukturPrefix}.Vorschau.IconList`;
let idIconList_Vorschau_Chart = `${idDatenpunktPrefix}.${idDatenPunktStrukturPrefix}.Vorschau.Chart`;
let idDialogSchalter = `${idDatenpunktPrefix}.${idDatenPunktStrukturPrefix}.Dialog.Day_`;
let idDatum = `${idDatenpunktPrefix}.${idDatenPunktStrukturPrefix}.DatumFormat.Day_`;
let idTemperatur = `${idDatenpunktPrefix}.${idDatenPunktStrukturPrefix}.Temperatur.Day_`;
let idNiederschlag = `${idDatenpunktPrefix}.${idDatenPunktStrukturPrefix}.Niederschlag.Day_`;
let idLuftfeuchtigkeit = `${idDatenpunktPrefix}.${idDatenPunktStrukturPrefix}.Luftfeuchtigkeit.Day_`;
let idWindgeschwindigkeit = `${idDatenpunktPrefix}.${idDatenPunktStrukturPrefix}.Windgeschwindigkeit.Day_`;
let idWindrichtung = `${idDatenpunktPrefix}.${idDatenPunktStrukturPrefix}.Windrichtung.Day_`;
let idLuftdruck = `${idDatenpunktPrefix}.${idDatenPunktStrukturPrefix}.Luftdruck.Day_`;
let idSchneefallgrenze = `${idDatenpunktPrefix}.${idDatenPunktStrukturPrefix}.Schneefallgrenze.Day_`;
let idSonne = `${idDatenpunktPrefix}.${idDatenPunktStrukturPrefix}.Sonne.Day_`;
let idMond = `${idDatenpunktPrefix}.${idDatenPunktStrukturPrefix}.Mond.Day_`;
let idBewolkung = `${idDatenpunktPrefix}.${idDatenPunktStrukturPrefix}.Aktuell.Bewolkung`;
let idUvIndex = `${idDatenpunktPrefix}.${idDatenPunktStrukturPrefix}.Aktuell.UV-Index`;
let idSonneneinstrahlung = `${idDatenpunktPrefix}.${idDatenPunktStrukturPrefix}.Aktuell.Sonneneinstrahlung`;
let idMeineSensoren = `${idDatenpunktPrefix}.${idDatenPunktStrukturPrefix}.Aktuell.MeineSensoren`;
let idChart = `${idDatenpunktPrefix}.${idDatenPunktStrukturPrefix}.Chart.Day_`;
let idVisibiltyPollenFlug = `${idDatenpunktPrefix}.${idDatenPunktStrukturPrefix}.Pollenflug.visible`;
let idPollenflug = `${idDatenpunktPrefix}.${idDatenPunktStrukturPrefix}.Pollenflug.Day_`;
// ===================== DasWetter paths =====================
const DW_DAILY = 'daswetter.0.location_1.ForecastDaily.Day_';
const DW_HOURLY = 'daswetter.0.location_1.ForecastHourly';
const DW_CUR = `${DW_HOURLY}.Current`;
function dwDay(day, key) { return `${DW_DAILY}${day}.${key}`; }
function dwHour(h, key) { return `${DW_HOURLY}.Hour_${h}.${key}`; }
// ===================== imports =====================
const chromaJs = require("chroma-js");
const moment = require("moment");
moment.locale("de");
let temperaturGradientColors = getGradientColors(-20, 40, color_graph_temperatur_verlauf);
// ===================== triggers =====================
on({ id: "system.adapter.daswetter.0.alive", val: false }, createData);
on({ id: idSensor_Temperatur }, createData);
// ===================== main =====================
function createData(obj) {
try {
if (obj) console.log(`Material Design Widgets: Wetter Skript triggered by '${obj.id}'`);
else console.log(`Material Design Widgets: Wetter Skript gestartet`);
// sanity check
if (!existsState(dwDay(1, 'NameOfDay')) || !existsState(`${DW_CUR}.time`)) {
console.warn(`DasWetter Datenpunkte nicht vollständig gefunden. Prüfe location_1 / ForecastDaily / ForecastHourly.`);
}
let vorschauIconList = [];
for (let i = 1; i <= dasWetter_Tage; i++) {
if (existsState(dwDay(i, 'NameOfDay'))) {
vorschauIconList.push(createVorschauIconListItem(i));
createDatumFormatierung(i);
createNiederschlag(i);
createLuftfeuchtigkeit(i);
createTemperatur(i);
createWindgeschwindigkeit(i);
createWindrichtung(i);
createLuftdruck(i);
createSchneefallgrenze(i);
createSonne(i);
createMond(i);
createPollenFlug(i);
// 24h Verlauf: aus ForecastHourly.Hour_1..24 (nur sinnvoll für "Tag 1 / nächste 24h")
createCharts(i);
mySetState(`${idDialogSchalter}${i}`, false, 'boolean', `Schalter um Dialog für Tag ${i} anzuzeigen`, true);
} else {
console.warn(`Keine Daten für Tag ${i} vorhanden! (DP: ${dwDay(i, 'NameOfDay')})`);
}
}
// Aktuellwerte aus ForecastHourly.Current
createBewolkung();
createUvIndex();
createSonneneinstrahlung(); // DasWetter liefert hier keinen solarRadiation-DP in Current (bei dir nicht gelistet) -> bleibt Platzhalter
createEigeneSensoren();
// Wochen Vorschau Graph (Daily)
createVorschauGraph(dasWetter_Tage);
// IconList Widget Vorschau
mySetState(idIconList_Vorschau, JSON.stringify(vorschauIconList), 'string', 'Vorschau Wetter für IconList Widget');
} catch (err) {
console.error(`[createData] error: ${err.message}`);
console.error(`[createData] stack: ${err.stack}`);
}
}
// ===================== helpers (safe read) =====================
function getVal(id, def = null) {
if (!existsState(id)) return def;
const s = getState(id);
return (s && s.val !== undefined && s.val !== null) ? s.val : def;
}
function numVal(id, def = 0) {
const v = getVal(id, def);
const n = parseFloat(v);
return isNaN(n) ? def : n;
}
// formatValue as in original script expectations
function formatValue(val, digits) {
if (val === null || val === undefined || val === '-') return '-';
const n = parseFloat(val);
if (isNaN(n)) return '-';
return n.toFixed(digits).toString().replace('.', ',');
}
function getRightText(val1, unitVal1, val2 = undefined, unitVal2 = undefined) {
return `
<div style="display: flex; align-items: flex-end; justify-content: flex-end;">
<div style="color: #44739e; font-size: 30px; font-family: RobotoCondensed-Regular;">${val1}</div>
<div style="color: #44739e; font-size: 16px; font-family: RobotoCondensed-Regular; margin-left: 2px; margin-bottom: 4px;">${unitVal1}</div>
</div>
${(val2 !== undefined) ? `<div style="color: gray; height: 13px; font-size: 12px; font-family: RobotoCondensed-Light; margin-top: 2px;">${val2}${unitVal2}</div>` : ''}`
}
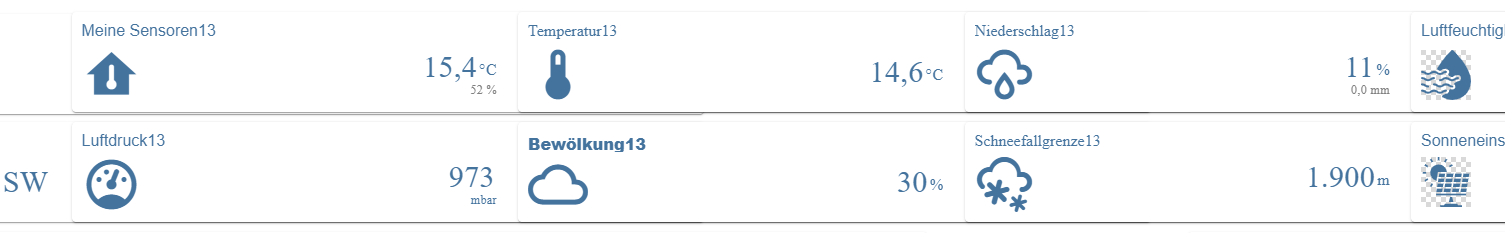
// ===================== widgets: own sensors =====================
function createEigeneSensoren() {
let listForWidget = [];
if (existsState(idSensor_Temperatur)) {
listForWidget.push({
rightText: getRightText(
formatValue(getVal(idSensor_Temperatur, 0), 1), ' °C',
formatValue(getVal(idSensor_Luftfeuchtigkeit, 0), 0), ' %'
)
});
}
mySetState(`${idMeineSensoren}`, JSON.stringify(listForWidget), 'string', `Werte eigener Sensoren aktuell für List Widget`);
}
// ===================== widgets: Current =====================
function createBewolkung() {
const clouds = numVal(`${DW_CUR}.clouds`, null);
let listForWidget = [{
rightText: getRightText(
(clouds === null ? '-' : formatValue(clouds, 0)), (clouds === null ? '' : ' %')
)
}];
mySetState(`${idBewolkung}`, JSON.stringify(listForWidget), 'string', `Bewölkung aktuell für List Widget`);
}
function createUvIndex() {
const uv = getVal(`${DW_CUR}.uv_index_max`, null);
let listForWidget = [{
rightText: getRightText(
(uv === null ? '-' : uv), ''
)
}];
mySetState(`${idUvIndex}`, JSON.stringify(listForWidget), 'string', `UV-Index aktuell für List Widget`);
}
function createSonneneinstrahlung() {
// In deiner Current-Liste gibt es keinen SolarRadiation-DP. Daher Platzhalter.
let listForWidget = [{
rightText: getRightText('-', '')
}];
mySetState(`${idSonneneinstrahlung}`, JSON.stringify(listForWidget), 'string', `Sonneneinstrahlung aktuell für List Widget (nicht verfügbar)`);
}
// ===================== widgets: Daily =====================
function createDatumFormatierung(day) {
const idDasWetter = `daswetter.0.location_1.ForecastDaily.Day_${day}`;
// robust: erst date_full, fallback date
const rawDate =
getVal(`${idDasWetter}.date_full`, null) ||
getVal(`${idDasWetter}.date`, null);
const formatiertesDatum = rawDate
? moment(new Date(rawDate)).format("dddd, D. MMMM YYYY")
: '-';
mySetState(
`${idDatum}${day}`,
formatiertesDatum,
'string',
`Formatiertes Datum Tag ${day}`
);
}
function createTemperatur(day) {
let listForWidget = [];
if (day === 1) {
// aktuelle Temp aus Current
const temp = numVal(`${DW_CUR}.temperature`, null);
const felt = numVal(`${DW_CUR}.temperature_feels_like`, null);
listForWidget.push({
rightText: getRightText(
(temp === null ? '-' : formatValue(temp, 1)), '°C',
(temp !== null && felt !== null && temp !== felt) ? `gefühlt ${formatValue(felt, 1)}` : undefined, '°C'
)
});
} else {
const tMax = numVal(dwDay(day, 'Temperature_Max'), null);
const tMin = numVal(dwDay(day, 'Temperature_Min'), null);
listForWidget.push({
rightText: getRightText(
(tMax === null ? '-' : formatValue(tMax, 1)), '°C',
`Nachts ${(tMin === null ? '-' : formatValue(tMin, 1))}`, '°C'
)
});
}
mySetState(`${idTemperatur}${day}`, JSON.stringify(listForWidget), 'string', `Temperatur Tag ${day} für List Widget`);
}
function createLuftfeuchtigkeit(day) {
let listForWidget = [];
if (day === 1) {
const hum = numVal(`${DW_CUR}.humidity`, null);
listForWidget.push({
rightText: getRightText(
(hum === null ? '-' : formatValue(hum, 0)), (hum === null ? '' : ' %')
)
});
} else {
const hum = numVal(dwDay(day, 'Humidity'), null);
listForWidget.push({
rightText: getRightText(
(hum === null ? '-' : formatValue(hum, 0)), (hum === null ? '' : ' %')
)
});
}
mySetState(`${idLuftfeuchtigkeit}${day}`, JSON.stringify(listForWidget), 'string', `Luftfeuchtigkeit Tag ${day} für List Widget`);
}
function createNiederschlag(day) {
let listForWidget = [];
if (day === 1) {
const prob = numVal(`${DW_CUR}.rain_probability`, null);
const rain = numVal(`${DW_CUR}.rain`, null);
listForWidget.push({
rightText: getRightText(
(prob === null ? '-' : formatValue(prob, 0)), (prob === null ? '' : ' %'),
(rain === null ? '-' : formatValue(rain, 1)), (rain === null ? '' : ' mm')
)
});
} else {
const prob = numVal(dwDay(day, 'Rain_Probability'), null);
const rain = numVal(dwDay(day, 'Rain'), null);
listForWidget.push({
rightText: getRightText(
(prob === null ? '-' : formatValue(prob, 0)), (prob === null ? '' : ' %'),
(rain === null ? '-' : formatValue(rain, 1)), (rain === null ? '' : ' mm')
)
});
}
mySetState(`${idNiederschlag}${day}`, JSON.stringify(listForWidget), 'string', `Niederschlag Tag ${day} für List Widget`);
}
function createWindgeschwindigkeit(day) {
let listForWidget = [];
if (day === 1) {
const wind = numVal(`${DW_CUR}.wind_speed`, null);
const gust = numVal(`${DW_CUR}.wind_gust`, null);
listForWidget.push({
rightText: getRightText(
(wind === null ? '-' : formatValue(wind, 0)), (wind === null ? '' : ' km/h'),
(gust === null ? undefined : `Böen ${formatValue(gust, 0)}`), (gust === null ? '' : ' km/h')
)
});
} else {
const wind = numVal(dwDay(day, 'Wind_Speed'), null);
const gust = numVal(dwDay(day, 'Wind_Gust'), null);
listForWidget.push({
rightText: getRightText(
(wind === null ? '-' : formatValue(wind, 0)), (wind === null ? '' : ' km/h'),
(gust === null ? undefined : `Böen ${formatValue(gust, 0)}`), (gust === null ? '' : ' km/h')
)
});
}
mySetState(`${idWindgeschwindigkeit}${day}`, JSON.stringify(listForWidget), 'string', `Windgeschwindigkeit Tag ${day} für List Widget`);
}
function createWindrichtung(day) {
let listForWidget = [];
if (day === 1) {
const dir = getVal(`${DW_CUR}.wind_direction`, '-');
listForWidget.push({ rightText: getRightText(dir, '') });
} else {
const dir = getVal(dwDay(day, 'Wind_Direction'), '-');
listForWidget.push({ rightText: getRightText(dir, '') });
}
mySetState(`${idWindrichtung}${day}`, JSON.stringify(listForWidget), 'string', `Windrichtung Tag ${day} für List Widget`);
}
function createLuftdruck(day) {
let listForWidget = [];
if (day === 1) {
const p = numVal(`${DW_CUR}.pressure`, null);
listForWidget.push({
rightText: getRightText(
(p === null ? '-' : formatValue(p, 0)), (p === null ? '' : ' mbar')
)
});
} else {
const p = numVal(dwDay(day, 'Pressure'), null);
listForWidget.push({
rightText: getRightText(
(p === null ? '-' : formatValue(p, 0)), (p === null ? '' : ' mbar')
)
});
}
mySetState(`${idLuftdruck}${day}`, JSON.stringify(listForWidget), 'string', `Luftdruck Tag ${day} für List Widget`);
}
function createSchneefallgrenze(day) {
let listForWidget = [];
const grenze = (day === 1) ? numVal(`${DW_CUR}.snowline`, null) : numVal(dwDay(day, 'Snowline'), null);
listForWidget.push({
rightText: getRightText(
(grenze === null || grenze <= 0) ? '-' : formatValue(grenze, 0),
(grenze === null || grenze <= 0) ? '' : ' m'
)
});
mySetState(`${idSchneefallgrenze}${day}`, JSON.stringify(listForWidget), 'string', `Schneefallgrenze Tag ${day} für List Widget`);
}
function createSonne(day) {
let listForWidget = [];
const sunIn = getVal(dwDay(day, 'Sun_in'), '-');
const sunOut = getVal(dwDay(day, 'Sun_out'), '-');
listForWidget.push({
rightText: `
<div style="color: gray; height: 13px; font-size: 10px; font-family: RobotoCondensed-Light; margin-top: 2px;">Aufgang</div>
<div style="display: flex; align-items: flex-end; justify-content: flex-end;">
<div style="color: #44739e; font-size: 24px; font-family: RobotoCondensed-Regular;">${sunIn}</div>
</div>`
});
listForWidget.push({
rightText: `
<div style="color: gray; height: 13px; font-size: 10px; font-family: RobotoCondensed-Light; margin-top: 2px;">Untergang</div>
<div style="display: flex; align-items: flex-end; justify-content: flex-end;">
<div style="color: #44739e; font-size: 24px; font-family: RobotoCondensed-Regular;">${sunOut}</div>
</div>`
});
mySetState(`${idSonne}${day}`, JSON.stringify(listForWidget), 'string', `Sonne Infos Tag ${day} für List Widget`);
}
function createMond(day) {
let listForWidget = [];
const moonIn = getVal(dwDay(day, 'Moon_in'), '-');
const moonOut = getVal(dwDay(day, 'Moon_out'), '-');
const illum = numVal(dwDay(day, 'Moon_illumination'), null);
listForWidget.push({
rightText: `
<div style="color: gray; height: 13px; font-size: 10px; font-family: RobotoCondensed-Light; margin-top: 2px;">Aufgang</div>
<div style="display: flex; align-items: flex-end; justify-content: flex-end;">
<div style="color: #44739e; font-size: 24px; font-family: RobotoCondensed-Regular;">${moonIn}</div>
</div>`
});
listForWidget.push({
rightText: `
<div style="color: gray; height: 13px; font-size: 10px; font-family: RobotoCondensed-Light; margin-top: 2px;">Untergang</div>
<div style="display: flex; align-items: flex-end; justify-content: flex-end;">
<div style="color: #44739e; font-size: 24px; font-family: RobotoCondensed-Regular;">${moonOut}</div>
</div>`
});
mySetState(`${idMond}${day}`, JSON.stringify(listForWidget), 'string', `Mond Infos Tag ${day} für List Widget`);
const moonHtml = (illum !== null)
? `<div><span class="mdi mdi-moon-waxing-crescent materialdesign-icon-image"></span> ${formatValue(illum, 0)} %</div>`
: `<div>-</div>`;
mySetState(`${idMond}${day}_lumi`, moonHtml, 'string', `Mond Beleuchtung Tag ${day} für Html Widget`);
}
// ===================== Pollen =====================
function createPollenFlug(day) {
let barData = [];
if (enablePollenFlug) {
mySetState(`${idVisibiltyPollenFlug}`, true, 'boolean', `Pollenflug Widgets anzeigen / ausblenden`);
if (day === 1) generateData(`${idPollenFlugRegion}.json_index_today`);
if (day === 2) generateData(`${idPollenFlugRegion}.json_index_tomorrow`);
function generateData(idDp) {
if (!existsState(idDp)) return;
let raw = getVal(idDp, null);
if (!raw) return;
let data;
try { data = JSON.parse(raw); } catch (e) { data = null; }
if (data && data.length > 0) {
for (const pollenInfo of data) {
barData.push({
label: pollenInfo.Pollen,
value: pollenInfo.Riskindex + 1,
dataColor: pollenFlugFarben[pollenInfo.Riskindex],
valueText: pollenFlugText[pollenInfo.Riskindex]
});
}
}
mySetState(`${idPollenflug}${day}`, JSON.stringify(barData), 'string', `Pollenflug Tag ${day} für Bar Chart Widget`);
}
} else {
mySetState(`${idVisibiltyPollenFlug}`, false, 'boolean', `Pollenflug Widgets anzeigen / ausblenden`);
}
}
// ===================== Charts =====================
// Build a single 24h chart from ForecastHourly.Hour_1..Hour_24 (next 24 hours).
// To keep your existing VIS bindings (Chart.Day_1..Day_5), we write the same chart for every day,
// but it represents "next 24h". If you want only Day_1 chart, we can do that too.
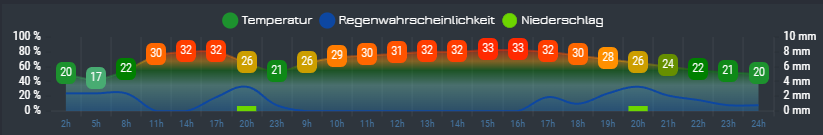
function createCharts(day) {
let axisLabels = [];
let temperatur = [];
let temperaturColors = [];
let regenWahrscheinlichkeit = [];
let niederschlag = [];
let temperaturAxisMax = -100;
let temperaturAxisMin = 100;
let niederschlagMaxVal = 0;
for (let i = 1; i <= 24; i++) {
// time label
let t = getVal(dwHour(i, 'time'), null);
if (t !== null) {
let h = String(t).replace(':00', '');
axisLabels.push(`${h}h`);
} else {
axisLabels.push('');
}
// temperature
let temp = numVal(dwHour(i, 'temperature'), null);
if (temp === null) {
temperatur.push(null);
temperaturColors.push('#888888');
} else {
if (temp > temperaturAxisMax) temperaturAxisMax = temp;
if (temp < temperaturAxisMin) temperaturAxisMin = temp;
temperatur.push(temp);
temperaturColors.push(temperaturGradientColors.getColorByValue(temp));
}
// rain probability
let prob = numVal(dwHour(i, 'rain_probability'), null);
regenWahrscheinlichkeit.push(prob === null ? null : prob);
// rain amount
let rain = numVal(dwHour(i, 'rain'), 0);
if (rain > niederschlagMaxVal) niederschlagMaxVal = rain;
niederschlag.push(rain);
}
let graphs = [];
graphs.push({
data: temperatur,
type: 'line',
color: 'gray',
legendText: 'Temperatur',
line_pointSizeHover: 5,
line_pointSize: 0,
line_Tension: 0.3,
yAxis_show: false,
yAxis_gridLines_show: false,
yAxis_gridLines_ticks_length: 5,
yAxis_min: (temperaturAxisMin < 5) ? Math.ceil((temperaturAxisMin - 5) / 5) * 5 : 0,
yAxis_max: Math.ceil((temperaturAxisMax + 5) / 5) * 5,
yAxis_step: 5,
yAxis_position: 'left',
yAxis_appendix: ' °C',
yAxis_zeroLineWidth: 0.1,
yAxis_zeroLineColor: 'black',
displayOrder: 0,
tooltip_AppendText: ' °C',
datalabel_backgroundColor: temperaturColors,
datalabel_color: 'white',
datalabel_offset: -10,
datalabel_fontFamily: 'RobotoCondensed-Light',
datalabel_fontSize: 12,
datalabel_borderRadius: 6,
datalabel_show: 'auto',
line_PointColor: temperaturColors,
line_PointColorBorder: temperaturColors,
line_PointColorHover: temperaturColors,
line_PointColorBorderHover: temperaturColors,
use_gradient_color: true,
gradient_color: color_graph_temperatur_verlauf,
use_line_gradient_fill_color: true,
line_gradient_fill_color: temperaturGradientColors.getGradientWithOpacity(40)
});
if (regenWahrscheinlichkeit.some(v => v !== null)) {
graphs.push({
data: regenWahrscheinlichkeit,
type: 'line',
color: color_graph_regenwahrscheinlichkeit,
legendText: 'Regenwahrscheinlichkeit',
line_UseFillColor: true,
line_pointSize: 0,
line_pointSizeHover: 5,
yAxis_min: 0,
yAxis_max: 100,
yAxis_maxSteps: 10,
yAxis_position: 'left',
yAxis_gridLines_show: false,
yAxis_gridLines_border_show: false,
yAxis_zeroLineWidth: 0.1,
yAxis_zeroLineColor: 'black',
yAxis_appendix: ' %',
displayOrder: 1,
tooltip_AppendText: ' %',
datalabel_show: false,
});
}
if (niederschlagMaxVal > 0) {
graphs.push({
data: niederschlag,
type: 'bar',
color: color_graph_niederschlag,
legendText: 'Niederschlag',
yAxis_min: 0,
yAxis_max: Math.ceil((niederschlagMaxVal + 5) / 5) * 5,
yAxis_maxSteps: 10,
yAxis_position: 'right',
yAxis_gridLines_show: false,
yAxis_appendix: ' mm',
yAxis_gridLines_border_show: false,
yAxis_zeroLineWidth: 0.1,
yAxis_zeroLineColor: 'black',
displayOrder: 1,
tooltip_AppendText: ' mm',
datalabel_show: false,
});
}
const chart = { axisLabels, graphs };
mySetState(`${idChart}${day}`, JSON.stringify(chart), 'string', `Tag ${day} für Chart Widget (nächste 24h)`);
}
// ===================== Weekly preview graph (Daily) =====================
function createVorschauGraph(maxDays) {
let axisLabels = [];
let temperaturMax = [];
let temperaturMin = [];
let temperaturMaxColors = [];
let temperaturMinColors = [];
let temperaturAxisMax = -100;
let temperaturAxisMin = 100;
let regenWahrscheinlichkeit = [];
let niederschlag = [];
let niederschlagMaxVal = 0;
for (let day = 1; day <= maxDays; day++) {
if (!existsState(dwDay(day, 'NameOfDay'))) continue;
axisLabels.push((day === 1) ? 'Heute' : getVal(dwDay(day, 'NameOfDay'), `Tag ${day}`));
const tMax = numVal(dwDay(day, 'Temperature_Max'), null);
const tMin = numVal(dwDay(day, 'Temperature_Min'), null);
if (tMax !== null) {
if (tMax > temperaturAxisMax) temperaturAxisMax = tMax;
if (tMax < temperaturAxisMin) temperaturAxisMin = tMax;
temperaturMax.push(tMax);
temperaturMaxColors.push(temperaturGradientColors.getColorByValue(tMax));
} else { temperaturMax.push(null); temperaturMaxColors.push('#888888'); }
if (tMin !== null) {
if (tMin > temperaturAxisMax) temperaturAxisMax = tMin;
if (tMin < temperaturAxisMin) temperaturAxisMin = tMin;
temperaturMin.push(tMin);
temperaturMinColors.push(temperaturGradientColors.getColorByValue(tMin));
} else { temperaturMin.push(null); temperaturMinColors.push('#888888'); }
const rain = numVal(dwDay(day, 'Rain'), 0);
if (rain > niederschlagMaxVal) niederschlagMaxVal = rain;
niederschlag.push(rain);
const prob = numVal(dwDay(day, 'Rain_Probability'), 0);
regenWahrscheinlichkeit.push(prob);
}
let graphs = [];
graphs.push({
data: temperaturMax,
type: 'line',
legendText: 'max. Temperatur',
line_pointSizeHover: 5,
line_pointSize: 0,
line_Tension: 0.3,
yAxis_id: 0,
yAxis_show: false,
yAxis_gridLines_show: false,
yAxis_gridLines_ticks_length: 5,
yAxis_min: (temperaturAxisMin < 5) ? Math.ceil((temperaturAxisMin - 5) / 5) * 5 : 0,
yAxis_max: Math.ceil((temperaturAxisMax + 5) / 5) * 5,
yAxis_step: 5,
yAxis_position: 'left',
yAxis_appendix: ' °C',
yAxis_zeroLineWidth: 0.1,
yAxis_zeroLineColor: 'black',
displayOrder: 0,
tooltip_AppendText: ' °C',
datalabel_backgroundColor: temperaturMaxColors,
datalabel_color: 'white',
datalabel_offset: -10,
datalabel_fontFamily: 'RobotoCondensed-Light',
datalabel_fontSize: 12,
datalabel_borderRadius: 6,
line_PointColor: temperaturMaxColors,
line_PointColorBorder: temperaturMaxColors,
line_PointColorHover: temperaturMaxColors,
line_PointColorBorderHover: temperaturMaxColors,
use_gradient_color: true,
line_FillBetweenLines: '+1',
gradient_color: color_graph_temperatur_verlauf,
use_line_gradient_fill_color: true,
line_gradient_fill_color: temperaturGradientColors.getGradientWithOpacity(40)
});
graphs.push({
data: temperaturMin,
type: 'line',
legendText: 'min. Temperatur',
line_pointSizeHover: 5,
line_pointSize: 0,
line_Tension: 0.3,
yAxis_id: 0,
yAxis_show: false,
yAxis_gridLines_show: false,
yAxis_gridLines_ticks_length: 5,
yAxis_min: (temperaturAxisMin < 5) ? Math.ceil((temperaturAxisMin - 5) / 5) * 5 : 0,
yAxis_max: Math.ceil((temperaturAxisMax + 5) / 5) * 5,
yAxis_step: 5,
yAxis_position: 'left',
yAxis_appendix: ' °C',
yAxis_zeroLineWidth: 0.1,
yAxis_zeroLineColor: 'black',
displayOrder: 0,
tooltip_AppendText: ' °C',
datalabel_backgroundColor: temperaturMinColors,
datalabel_color: 'white',
datalabel_offset: -10,
datalabel_fontFamily: 'RobotoCondensed-Light',
datalabel_fontSize: 12,
datalabel_borderRadius: 6,
line_PointColor: temperaturMinColors,
line_PointColorBorder: temperaturMinColors,
line_PointColorHover: temperaturMinColors,
line_PointColorBorderHover: temperaturMinColors,
use_gradient_color: true,
gradient_color: color_graph_temperatur_verlauf
});
graphs.push({
data: regenWahrscheinlichkeit,
type: 'line',
color: color_graph_regenwahrscheinlichkeit,
legendText: 'Regenwahrscheinlichkeit',
line_UseFillColor: true,
line_pointSize: 0,
line_pointSizeHover: 5,
yAxis_min: 0,
yAxis_max: 100,
yAxis_maxSteps: 10,
yAxis_position: 'left',
yAxis_gridLines_show: false,
yAxis_gridLines_border_show: true,
yAxis_distance: 10,
yAxis_zeroLineWidth: 0.1,
yAxis_zeroLineColor: 'black',
yAxis_appendix: ' %',
displayOrder: 1,
tooltip_AppendText: ' %',
datalabel_show: false,
});
if (niederschlagMaxVal > 0) {
graphs.push({
data: niederschlag,
type: 'bar',
color: color_graph_niederschlag,
legendText: 'Niederschlag',
yAxis_min: 0,
yAxis_max: Math.ceil((niederschlagMaxVal + 5) / 5) * 5,
yAxis_maxSteps: 10,
yAxis_position: 'right',
yAxis_gridLines_show: false,
yAxis_appendix: ' mm',
yAxis_gridLines_border_show: false,
yAxis_distance: 10,
yAxis_zeroLineWidth: 0.1,
yAxis_zeroLineColor: 'black',
displayOrder: 1,
tooltip_AppendText: ' mm',
datalabel_show: false,
});
}
const chart = { axisLabels, graphs };
mySetState(`${idIconList_Vorschau_Chart}`, JSON.stringify(chart), 'string', `Vorschau Chart`);
}
// ===================== IconList item (Daily) =====================
function createVorschauIconListItem(day) {
const title = (day === 1) ? 'Heute' : getVal(dwDay(day, 'NameOfDay'), `Tag ${day}`);
const regenWahrscheinlichkeit = `${formatValue(getVal(dwDay(day, 'Rain_Probability'), 0), 0)} %`;
const niederschlag = `${formatValue(getVal(dwDay(day, 'Rain'), 0), 1)} mm`;
return {
text: `
<div style="margin: 0 4px; text-align: center;">${title}
<div style="height: 1px; background: #44739e;"></div>
<div style="color: grey; font-size: 11px; font-family: RobotoCondensed-Light; white-space: break-spaces; margin-top: 5px; text-align: center;">
${getVal(dwDay(day, 'symbol_description'), '')}
</div>
<div style="color: #44739e; font-family: RobotoCondensed-Regular; font-size: 16px; margin-top: 5px; text-align: center;">
${formatValue(getVal(dwDay(day, 'Temperature_Max'), '-'), 1)}°C | ${formatValue(getVal(dwDay(day, 'Temperature_Min'), '-'), 1)}°C
</div>
<div style="color: grey; font-size: 11px; font-family: RobotoCondensed-Light; white-space: break-spaces; margin-top: 5px; text-align: center;">
${regenWahrscheinlichkeit}
</div>
</div>`,
image: getVal(dwDay(day, 'symbol_URL'), ''),
subText: `
<div style="display: flex; align-items: center; margin: 0 4px;">
<div style="flex: 1;text-align: left;font-family: RobotoCondensed-Light; font-size: 11px;">Luftfeuchtigkeit</div>
<div style="color: gray; font-family: RobotoCondensed-LightItalic; font-size: 10px;">${formatValue(getVal(dwDay(day, 'Humidity'), '-'), 0)} %</div>
</div>
<div style="display: flex; align-items: flex-start; margin: 0 4px;">
<div style="flex: 1;text-align: left;font-family: RobotoCondensed-Light; font-size: 11px;">Regen</div>
<div style="color: gray; font-family: RobotoCondensed-LightItalic; font-size: 10px;">${niederschlag}</div>
</div>
<div style="display: flex; align-items: center; margin: 0 4px;">
<div style="flex: 1;text-align: left;font-family: RobotoCondensed-Light; font-size: 11px;">Wind</div>
<div style="color: gray; font-family: RobotoCondensed-LightItalic; font-size: 10px;">${formatValue(getVal(dwDay(day, 'Wind_Speed'), '-'), 0)} km/h</div>
</div>
<div style="display: flex; align-items: center; margin: 0 4px;">
<div style="flex: 1;text-align: left;font-family: RobotoCondensed-Light; font-size: 11px;">Luftdruck</div>
<div style="color: gray; font-family: RobotoCondensed-LightItalic; font-size: 10px;">${formatValue(getVal(dwDay(day, 'Pressure'), '-'), 0)} hPa</div>
</div>
<div style="display: flex; align-items: center; margin: 0 4px;">
<div style="flex: 1;text-align: left;font-family: RobotoCondensed-Light; font-size: 11px;">Schneefall</div>
<div style="color: gray; font-family: RobotoCondensed-LightItalic; font-size: 10px;">${formatValue(getVal(dwDay(day, 'Snowline'), '-'), 0)} m</div>
</div>
<div style="display: flex; align-items: center; margin: 0 4px;">
<div style="flex: 1;text-align: left;font-family: RobotoCondensed-Light; font-size: 11px;">Sonnenaufgang</div>
<div style="color: gray; font-family: RobotoCondensed-LightItalic; font-size: 10px;">${getVal(dwDay(day, 'Sun_in'), '-')}</div>
</div>
<div style="display: flex; align-items: center; margin: 0 4px;">
<div style="flex: 1;text-align: left;font-family: RobotoCondensed-Light; font-size: 11px;">Sonnenuntergang</div>
<div style="color: gray; font-family: RobotoCondensed-LightItalic; font-size: 10px;">${getVal(dwDay(day, 'Sun_out'), '-')}</div>
</div>
`,
listType: (day === 1) ? "text" : "buttonState",
objectId: `${idDialogSchalter}${day}`,
buttonStateValue: "true",
"showValueLabel": "false"
};
}
// ===================== startup =====================
createData();
// ===================== original helper functions =====================
function getGradientColors(min, max, colorValArray) {
let delta = max - min;
let chromaColors = [];
let chromaDomains = [];
for (const item of colorValArray) {
chromaColors.push(item.color);
chromaDomains.push(item.value / delta);
}
let chroma = chromaJs.scale(chromaColors).domain(chromaDomains);
return {
getColorByValue: function (val) {
if (val > max) return chroma(1).hex();
if (val < min) return chroma(0).hex();
return chroma(val / delta).hex();
},
getGradientWithOpacity: function (opacity) {
colorValArray.forEach(item => {
item.color = chromaJs(item.color).alpha(opacity / 100).hex();
});
return colorValArray;
}
};
}
function mySetState(id, val, type, name, write = false) {
if (existsState(id)) {
setState(id, val, true);
} else {
createState(id, {
name: name,
type: type,
read: true,
write: write
}, function () {
setState(id, val, true);
});
}
}