

Material Design Widgets: Wetter View

-
In der letzten Beta vom Javascript erhalte ich auf einmal diesen Fehler:
script.js.common.vis.Material_Wetterview: existsState has been called with id of type "function" but expects a stringMacht nicht so richtig Sinn, wenn ich es überfliege. Die Variablen werden immer mit strings belegt.
// Edit Die Lösung ist in Zeile 858 (bei mir) in der Funktion createVorschauGraph(maxDays)
Hier einfach eine Prüfung auf den Typen ergänzen:if (typeof i === 'string' && existsState(i) && getState(i).val >= 0) { -
Hallo
Wieder mal eine Frage.
Eigentlich sind es zwei fragen
Warum steht bei mir überall Nummer hinter den Texten?
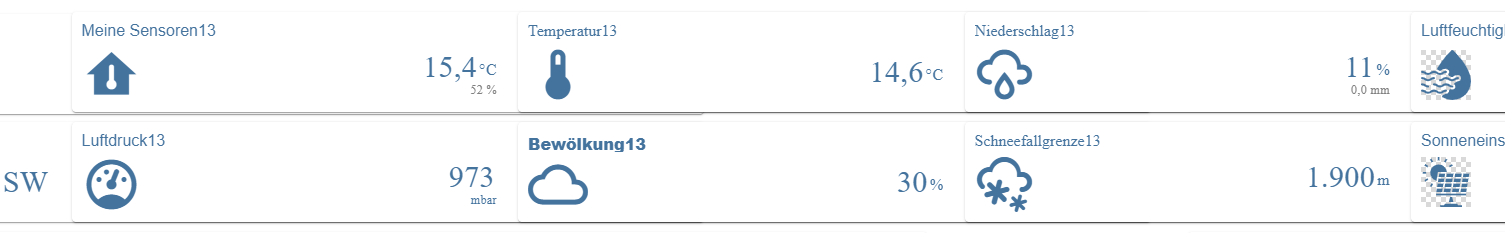
Und wie kann man die Breite variieren, die Widgets überschneiden sich alle seit ich sie in meine VIS übernommen habe?
@dirni sagte in Material Design Widgets: Wetter View:
Hallo
Wieder mal eine Frage.
Eigentlich sind es zwei fragen
Warum steht bei mir überall Nummer hinter den Texten?
Und wie kann man die Breite variieren, die Widgets überschneiden sich alle seit ich sie in meine VIS übernommen habe?
Gibt da schon einen Lösungsansatz, bei mir wird auch bei allem Cards eine 1 dahinter geschrieben
-
@robertm
Das könnte ein Editorproblem sein. Ascii Code 13 ist CR Carriage Return. Einfach mal im Edidor ansehen und löschen. -
Hallo zusammen,
ich habe seit einigen Wochen das Problem, dass mir mein Chart nicht mehr korrekt angezeigt wird.
Ich kann mich leider nicht mehr erinnern, ob es in Zusammenhang mit einem Update eines Adapters kam, da mir das erst später aufgefallen ist.Ich benutze für die Darstellung das Skript von Scrounger (Version: 1.0.5) inklusive "DasWetter"-Adapter und "WeatherUnderground"-Adapter. Die Adapter sind auf dem aktuellesten Stand. Es hat nun jahrelang funktioniert - ich habe im Skript natürlich auch nichts geändert.
Die Werte auf der x-Achse passen leider nicht, wie man im Screenshot sehen kann (es beginnt nicht bei 1h sondern bei 2h mit 3-Stunden-Abständen bis 23h und dann ab 9h erst mit 1-Stunden-Abständen:
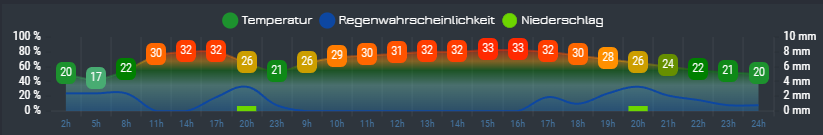
Die Labels der x-Achse bzw. die Beschriftungen werden im Skript verteilt / gesetzt - wie gesagt habe ich hier nichts geändert.
Im Skript werden die x-Axis-Labels hier (falsch) gesetzt:for (var i = 1; i <= maxHours; i++) { let hour = parseFloat(getState(`${idDasWetter}.Hour_${i}.hour_value`).val.replace(':00')); if ((maxHours === 24) || maxHours === 8) { axisLabels.push(`${hour}h`); } else { axisLabels.push(''); } ...Dementsprechend sieht der JSON-Datenpunkt unter Chart/Day_1 auch (falsch) aus:
{
  "axisLabels": [
    "2h",
    "5h",
    "8h",
    "11h",
    "14h",
    "17h",
    "20h",
    "23h",
    "9h",
    "10h",
    "11h",
    "12h",
    "13h",
    "14h",
    "15h",
    "16h",
    "17h",
    "18h",
    "19h",
    "20h",
    "21h",
    "22h",
    "23h",
    "24h"
  ],
...
Mich macht es aber natürlich stutzig, dass sonst keiner dieses Problem hat, oder habe ich etwas nicht mitgekriegt?
Jemand eine Idee? -
Hallo zusammen,
ich habe seit einigen Wochen das Problem, dass mir mein Chart nicht mehr korrekt angezeigt wird.
Ich kann mich leider nicht mehr erinnern, ob es in Zusammenhang mit einem Update eines Adapters kam, da mir das erst später aufgefallen ist.Ich benutze für die Darstellung das Skript von Scrounger (Version: 1.0.5) inklusive "DasWetter"-Adapter und "WeatherUnderground"-Adapter. Die Adapter sind auf dem aktuellesten Stand. Es hat nun jahrelang funktioniert - ich habe im Skript natürlich auch nichts geändert.
Die Werte auf der x-Achse passen leider nicht, wie man im Screenshot sehen kann (es beginnt nicht bei 1h sondern bei 2h mit 3-Stunden-Abständen bis 23h und dann ab 9h erst mit 1-Stunden-Abständen:
Die Labels der x-Achse bzw. die Beschriftungen werden im Skript verteilt / gesetzt - wie gesagt habe ich hier nichts geändert.
Im Skript werden die x-Axis-Labels hier (falsch) gesetzt:for (var i = 1; i <= maxHours; i++) { let hour = parseFloat(getState(`${idDasWetter}.Hour_${i}.hour_value`).val.replace(':00')); if ((maxHours === 24) || maxHours === 8) { axisLabels.push(`${hour}h`); } else { axisLabels.push(''); } ...Dementsprechend sieht der JSON-Datenpunkt unter Chart/Day_1 auch (falsch) aus:
{
  "axisLabels": [
    "2h",
    "5h",
    "8h",
    "11h",
    "14h",
    "17h",
    "20h",
    "23h",
    "9h",
    "10h",
    "11h",
    "12h",
    "13h",
    "14h",
    "15h",
    "16h",
    "17h",
    "18h",
    "19h",
    "20h",
    "21h",
    "22h",
    "23h",
    "24h"
  ],
...
Mich macht es aber natürlich stutzig, dass sonst keiner dieses Problem hat, oder habe ich etwas nicht mitgekriegt?
Jemand eine Idee?@gender sagte in Material Design Widgets: Wetter View:
inklusive "DasWetter"-Adapter und "WeatherUnderground"-Adapter.
Prüfe doch mal, ob Daten vom "DasWetter-Adapter" fehlen. Da gibt es seit Monaten Probleme, da bei DasWetter was geändert wurde (API Zugriff). Falls da Lücken in den Daten sind, musst du ggfs. auf einen anderen Adapter ausweichen.
Ro75.
-
@gender sagte in Material Design Widgets: Wetter View:
inklusive "DasWetter"-Adapter und "WeatherUnderground"-Adapter.
Prüfe doch mal, ob Daten vom "DasWetter-Adapter" fehlen. Da gibt es seit Monaten Probleme, da bei DasWetter was geändert wurde (API Zugriff). Falls da Lücken in den Daten sind, musst du ggfs. auf einen anderen Adapter ausweichen.
Ro75.
Vielen Dank.
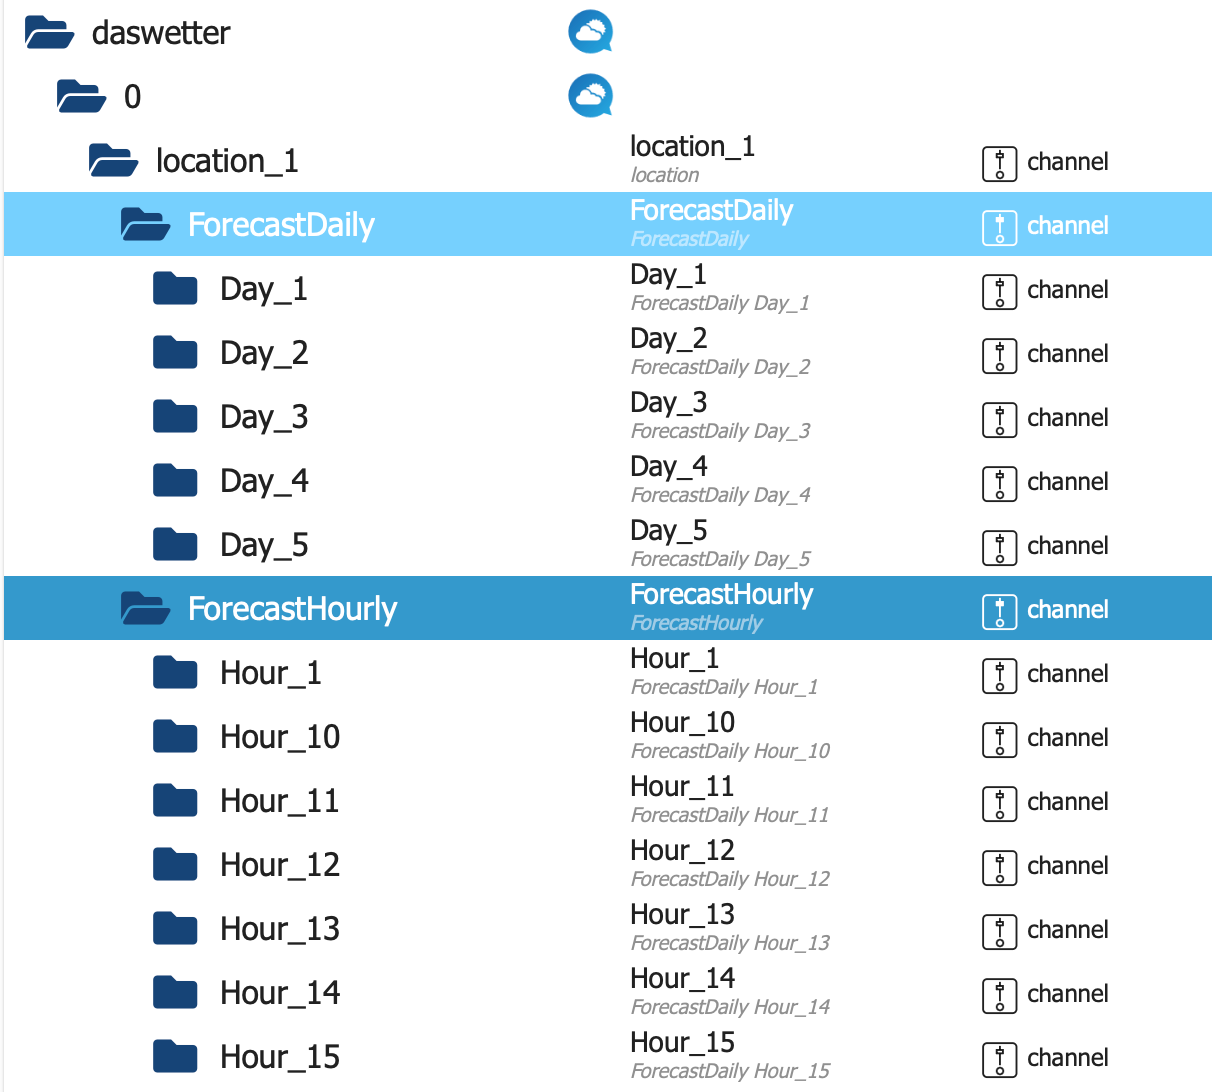
Ja inzwischen habe ich mich auch daran erinnert, dass ich an dem "DasWetter"-Adapter etwas geändert habe - und daran liegt es auch. Ich habe die "3-Stunden-Abfrage" des Adapters zusätzlich drin gehabt - daher auch die komische Anzeige.
Ich hab jetzt wieder ne normale Anzeige von 1h bis 24h.
Allerdings kriege ich jetzt nicht die Objekte von den "NextDaysDetailed".
So richtig eindeutig sind die Einträge in den Einstellungen des Adapters leider auch nicht!EDIT:
Habs jetzt auch mit den Detailed-Objekten:
Hab mich an den Einträgen hier https://forum.iobroker.net/topic/5347/adapter-daswetter/1197 orientiert. -
Hallo. Hat jemand die Lösung „Material Design Wigits - Wetter“ mit dem DasWetter Adapter in der Version 4.x (aktuelle 4.3) am Start? Ich frage, weil mindest eine Abfrage im Skript nicht passt.
10x JA-Solar (380Wp) unter 15° gen Süden und 12x JA-Solar (385Wp) unter 10° gen Westen auf Carport, HUAWEI SUN2000 WR
Daran HUAWEI LUNA2000, 10kWh
Und via Kaskade 8x JA-Solar (385Wp) unter 45° gen Osten und 14x JA-Solar (385Wp) unter 23° gen Westen am 2. HUAWEI SUN2000 WR.
SMARTFOX PRO als EMS, KEBA P30-X Wallbox
-
Hallo. Hat jemand die Lösung „Material Design Wigits - Wetter“ mit dem DasWetter Adapter in der Version 4.x (aktuelle 4.3) am Start? Ich frage, weil mindest eine Abfrage im Skript nicht passt.
Moin, brauchst du das Script noch? Ich habe es mit Hilfe von KI geändert, so das es mit den neuen Datenpunkten funktioniert.
Wenn also noch Interesse besteht, dann kann ich es gerne hier posten.Gruß, JoJo
-
Moin, brauchst du das Script noch? Ich habe es mit Hilfe von KI geändert, so das es mit den neuen Datenpunkten funktioniert.
Wenn also noch Interesse besteht, dann kann ich es gerne hier posten.Gruß, JoJo
Ich habe Interesse an dem Script. Ich hätte auch selber an die liebe KI denken können.
Es wäre schön, wenn du es hier posten könntest.Martin
Gruß
Martin
Intel NUCs mit Proxmox / Iobroker als VM unter Debian
Raspeberry mit USB Leseköpfen für Smartmeter
Homematic und Homematic IP -
Hier war schon jemand so nett und hat nen PR gestellt der auch schon umgesetzt wurde....
https://github.com/Scrounger/ioBroker.vis-materialdesign/issues/263
-
@bommel_030
Da sind noch einige Fehler drin, wirft noch jede Menge Euros aus. -
Ich habe Interesse an dem Script. Ich hätte auch selber an die liebe KI denken können.
Es wäre schön, wenn du es hier posten könntest.Martin
-
Das ist die angepasste Version:
Oder du nimmst die von Github, ich wusste nicht das es da schon eine gibt.
Gruß JoJo
-
@jojo58
Ich habe nun die Datenpunkte durch meine Wetterstation ersetzt und zusätzlich Sonnen Einstrahlung und UV ergänzt.Der o.g. Fehler kommt aber weiter. Welche Version von DasWetter setzt du ein? Ich setze die Version aus Stable (4.2.0) ein.
Hier das angepasste Script:
/************************************************************************************************************************************************************************ Version: 1.0.5 created by Scrounger Dieses Skript erzeugt json strings um Wetter Informationen im VIS mit den Material Design Widgets darzustellen ========================================================================================================================================================================= !!! Voraussetzungen !!! * Material Design Widgets >= 0.3.6 * DasWetter >= 3.0.1 * weatherunderground >= 3.2.1 * Pollenflug >= 1.0.4 (optional in Skript Einstellung de- / aktivierbar) * Javascript Adapter >= 4.6.1 * Javascript Adapter NPM Module: moment, moment-timezone, moment-duration-format, chroma-js ========================================================================================================================================================================= --- Links --- * Support: https://forum.iobroker.net/topic/32232/material-design-widgets-wetter-view * Github: https://github.com/Scrounger/ioBroker.vis-materialdesign/tree/master/examples/Weather ========================================================================================================================================================================= --- Changelog --- * 1.0.0: Initial release * 1.0.1: Trigger bug fixes * 1.0.2: enable / disable option for Pollenflug Adapter added * 1.0.3: new feature of Material Design Widgets 0.3.6 added: auto show data labels on chart * 1.0.4: bug fix graphs y-Axis range, Javascript Adapter >= 4.6.1 needed, DasWetter >= 3.0.1 needed * 1.0.5: bug fix Windrichtung ************************************************************************************************************************************************************************/ /************************************************************************************************************************************************************************ Patched for DasWetter v4+ structure (ForecastDaily + ForecastHourly) Based on Scrounger Script 1.0.5 (Material Design Widgets Wetter View) JoJo-Patch 2026-01-26: Works with: - daswetter.0.location_1.ForecastDaily.Day_1..Day_5.* - daswetter.0.location_1.ForecastHourly.Current.* - daswetter.0.location_1.ForecastHourly.Hour_1..Hour_24.* Notes: - No dependency on weatherunderground for core functionality anymore. - 24h Chart uses ForecastHourly.Hour_1..Hour_24 (next 24 hours). - Daily cards use ForecastDaily fields you posted. ************************************************************************************************************************************************************************/ // ===================== Script Settings ===================== let dasWetter_Tage = 5; let idDatenpunktPrefix = '0_userdata.0'; // '0_userdata.0' or 'javascript.x' let idDatenPunktStrukturPrefix = 'vis.MaterialDesignWidgets.Wetter'; // own sensor (optional) let idSensor_Temperatur = '0_userdata.0.Wetterstation.Aussentemperatur'; let idSensor_Luftfeuchtigkeit = '0_userdata.0.Wetterstation.Aussenfeuchtigkeit'; // chart colors let color_graph_temperatur_verlauf = [ { value: -20, color: '#5b2c6f' }, { value: 0, color: '#2874a6' }, { value: 14, color: '#73c6b6' }, { value: 22, color: '#008000' }, { value: 27, color: '#FFA500' }, { value: 35, color: '#FF0000' } ]; // let color_graph_regenwahrscheinlichkeit = '#0d47a1'; let color_graph_regenwahrscheinlichkeit = '#8ae8f9'; let color_graph_niederschlag = '#6dd600'; // Pollen (optional) let enablePollenFlug = true; let idPollenFlugRegion = 'pollenflug.0.region#41.summary'; let pollenFlugFarben = ['#57bb8a', '#94bd77', '#d4c86a', '#e9b861', '#e79a69', '#dd776e', 'red']; let pollenFlugText = ['keine', 'kaum', 'gering', 'mäßig', 'mittel', 'hoch', 'stark']; // ===================== Derived IDs ===================== let idIconList_Vorschau = `${idDatenpunktPrefix}.${idDatenPunktStrukturPrefix}.Vorschau.IconList`; let idIconList_Vorschau_Chart = `${idDatenpunktPrefix}.${idDatenPunktStrukturPrefix}.Vorschau.Chart`; let idDialogSchalter = `${idDatenpunktPrefix}.${idDatenPunktStrukturPrefix}.Dialog.Day_`; let idDatum = `${idDatenpunktPrefix}.${idDatenPunktStrukturPrefix}.DatumFormat.Day_`; let idTemperatur = `${idDatenpunktPrefix}.${idDatenPunktStrukturPrefix}.Temperatur.Day_`; let idNiederschlag = `${idDatenpunktPrefix}.${idDatenPunktStrukturPrefix}.Niederschlag.Day_`; let idLuftfeuchtigkeit = `${idDatenpunktPrefix}.${idDatenPunktStrukturPrefix}.Luftfeuchtigkeit.Day_`; let idWindgeschwindigkeit = `${idDatenpunktPrefix}.${idDatenPunktStrukturPrefix}.Windgeschwindigkeit.Day_`; let idWindrichtung = `${idDatenpunktPrefix}.${idDatenPunktStrukturPrefix}.Windrichtung.Day_`; let idLuftdruck = `${idDatenpunktPrefix}.${idDatenPunktStrukturPrefix}.Luftdruck.Day_`; let idSchneefallgrenze = `${idDatenpunktPrefix}.${idDatenPunktStrukturPrefix}.Schneefallgrenze.Day_`; let idSonne = `${idDatenpunktPrefix}.${idDatenPunktStrukturPrefix}.Sonne.Day_`; let idMond = `${idDatenpunktPrefix}.${idDatenPunktStrukturPrefix}.Mond.Day_`; let idBewolkung = `${idDatenpunktPrefix}.${idDatenPunktStrukturPrefix}.Aktuell.Bewolkung`; let idUvIndex = `${idDatenpunktPrefix}.${idDatenPunktStrukturPrefix}.Aktuell.UV-Index`; let idSonneneinstrahlung = `${idDatenpunktPrefix}.${idDatenPunktStrukturPrefix}.Aktuell.Sonneneinstrahlung`; let idMeineSensoren = `${idDatenpunktPrefix}.${idDatenPunktStrukturPrefix}.Aktuell.MeineSensoren`; let idChart = `${idDatenpunktPrefix}.${idDatenPunktStrukturPrefix}.Chart.Day_`; let idVisibiltyPollenFlug = `${idDatenpunktPrefix}.${idDatenPunktStrukturPrefix}.Pollenflug.visible`; let idPollenflug = `${idDatenpunktPrefix}.${idDatenPunktStrukturPrefix}.Pollenflug.Day_`; // ===================== DasWetter paths ===================== const DW_DAILY = 'daswetter.0.location_1.ForecastDaily.Day_'; const DW_HOURLY = 'daswetter.0.location_1.ForecastHourly'; const DW_CUR = `${DW_HOURLY}.Current`; function dwDay(day, key) { return `${DW_DAILY}${day}.${key}`; } function dwHour(h, key) { return `${DW_HOURLY}.Hour_${h}.${key}`; } // ===================== imports ===================== const chromaJs = require("chroma-js"); const moment = require("moment"); moment.locale("de"); let temperaturGradientColors = getGradientColors(-20, 40, color_graph_temperatur_verlauf); // ===================== triggers ===================== on({ id: "system.adapter.daswetter.0.alive", val: false }, createData); on({ id: idSensor_Temperatur }, createData); // ===================== main ===================== function createData(obj) { try { if (obj) console.log(`Material Design Widgets: Wetter Skript triggered by '${obj.id}'`); else console.log(`Material Design Widgets: Wetter Skript gestartet`); // sanity check if (!existsState(dwDay(1, 'NameOfDay')) || !existsState(`${DW_CUR}.time`)) { console.warn(`DasWetter Datenpunkte nicht vollständig gefunden. Prüfe location_1 / ForecastDaily / ForecastHourly.`); } let vorschauIconList = []; for (let i = 1; i <= dasWetter_Tage; i++) { if (existsState(dwDay(i, 'NameOfDay'))) { vorschauIconList.push(createVorschauIconListItem(i)); createDatumFormatierung(i); createNiederschlag(i); createLuftfeuchtigkeit(i); createTemperatur(i); createWindgeschwindigkeit(i); createWindrichtung(i); createLuftdruck(i); createSchneefallgrenze(i); createSonne(i); createMond(i); createPollenFlug(i); // 24h Verlauf: aus ForecastHourly.Hour_1..24 (nur sinnvoll für "Tag 1 / nächste 24h") createCharts(i); mySetState(`${idDialogSchalter}${i}`, false, 'boolean', `Schalter um Dialog für Tag ${i} anzuzeigen`, true); } else { console.warn(`Keine Daten für Tag ${i} vorhanden! (DP: ${dwDay(i, 'NameOfDay')})`); } } // Aktuellwerte aus ForecastHourly.Current createBewolkung(); createUvIndex(); createSonneneinstrahlung(); // DasWetter liefert hier keinen solarRadiation-DP in Current (bei dir nicht gelistet) -> bleibt Platzhalter createEigeneSensoren(); // Wochen Vorschau Graph (Daily) createVorschauGraph(dasWetter_Tage); // IconList Widget Vorschau mySetState(idIconList_Vorschau, JSON.stringify(vorschauIconList), 'string', 'Vorschau Wetter für IconList Widget'); } catch (err) { console.error(`[createData] error: ${err.message}`); console.error(`[createData] stack: ${err.stack}`); } } // ===================== helpers (safe read) ===================== function getVal(id, def = null) { if (!existsState(id)) return def; const s = getState(id); return (s && s.val !== undefined && s.val !== null) ? s.val : def; } function numVal(id, def = 0) { const v = getVal(id, def); const n = parseFloat(v); return isNaN(n) ? def : n; } // formatValue as in original script expectations function formatValue(val, digits) { if (val === null || val === undefined || val === '-') return '-'; const n = parseFloat(val); if (isNaN(n)) return '-'; return n.toFixed(digits).toString().replace('.', ','); } function getRightText(val1, unitVal1, val2 = undefined, unitVal2 = undefined) { return ` <div style="display: flex; align-items: flex-end; justify-content: flex-end;"> <div style="color: #44739e; font-size: 30px; font-family: RobotoCondensed-Regular;">${val1}</div> <div style="color: #44739e; font-size: 16px; font-family: RobotoCondensed-Regular; margin-left: 2px; margin-bottom: 4px;">${unitVal1}</div> </div> ${(val2 !== undefined) ? `<div style="color: gray; height: 13px; font-size: 12px; font-family: RobotoCondensed-Light; margin-top: 2px;">${val2}${unitVal2}</div>` : ''}` } // ===================== widgets: own sensors ===================== function createEigeneSensoren() { let listForWidget = []; if (existsState(idSensor_Temperatur)) { listForWidget.push({ rightText: getRightText( formatValue(getVal(idSensor_Temperatur, 0), 1), ' °C', formatValue(getVal(idSensor_Luftfeuchtigkeit, 0), 0), ' %' ) }); } mySetState(`${idMeineSensoren}`, JSON.stringify(listForWidget), 'string', `Werte eigener Sensoren aktuell für List Widget`); } // ===================== widgets: Current ===================== function createBewolkung() { const clouds = numVal(`${DW_CUR}.clouds`, null); let listForWidget = [{ rightText: getRightText( (clouds === null ? '-' : formatValue(clouds, 0)), (clouds === null ? '' : ' %') ) }]; mySetState(`${idBewolkung}`, JSON.stringify(listForWidget), 'string', `Bewölkung aktuell für List Widget`); } function createUvIndex() { let listForWidget = []; listForWidget.push({ rightText: getRightText( formatValue(getState(`0_userdata.0.Wetterstation.UV_Index`).val, 0), '' ) }) mySetState(`${idUvIndex}`, JSON.stringify(listForWidget), 'string', `UV-Index aktuell für List Widget`); } function createSonneneinstrahlung() { let listForWidget = []; listForWidget.push({ rightText: getRightText( formatValue(getState(`0_userdata.0.Wetterstation.Sonnenstrahlung`).val, 0), ' w/m²', ) }) mySetState(`${idSonneneinstrahlung}`, JSON.stringify(listForWidget), 'string', `Sonneneinstrahlung aktuell für List Widget`); } // ===================== widgets: Daily ===================== function createDatumFormatierung(day) { const idDasWetter = `daswetter.0.location_1.ForecastDaily.Day_${day}`; // robust: erst date_full, fallback date const rawDate = getVal(`${idDasWetter}.date_full`, null) || getVal(`${idDasWetter}.date`, null); const formatiertesDatum = rawDate ? moment(new Date(rawDate)).format("dddd, D. MMMM YYYY") : '-'; mySetState( `${idDatum}${day}`, formatiertesDatum, 'string', `Formatiertes Datum Tag ${day}` ); } function createTemperatur(day) { let listForWidget = []; if (day === 1) { // aktuelle Temp aus Current const temp = numVal(`${DW_CUR}.temperature`, null); const felt = numVal(`${DW_CUR}.temperature_feels_like`, null); listForWidget.push({ rightText: getRightText( (temp === null ? '-' : formatValue(temp, 1)), '°C', (temp !== null && felt !== null && temp !== felt) ? `gefühlt ${formatValue(felt, 1)}` : undefined, '°C' ) }); } else { const tMax = numVal(dwDay(day, 'Temperature_Max'), null); const tMin = numVal(dwDay(day, 'Temperature_Min'), null); listForWidget.push({ rightText: getRightText( (tMax === null ? '-' : formatValue(tMax, 1)), '°C', `Nachts ${(tMin === null ? '-' : formatValue(tMin, 1))}`, '°C' ) }); } mySetState(`${idTemperatur}${day}`, JSON.stringify(listForWidget), 'string', `Temperatur Tag ${day} für List Widget`); } function createLuftfeuchtigkeit(day) { let listForWidget = []; if (day === 1) { const hum = numVal(`${DW_CUR}.humidity`, null); listForWidget.push({ rightText: getRightText( (hum === null ? '-' : formatValue(hum, 0)), (hum === null ? '' : ' %') ) }); } else { const hum = numVal(dwDay(day, 'Humidity'), null); listForWidget.push({ rightText: getRightText( (hum === null ? '-' : formatValue(hum, 0)), (hum === null ? '' : ' %') ) }); } mySetState(`${idLuftfeuchtigkeit}${day}`, JSON.stringify(listForWidget), 'string', `Luftfeuchtigkeit Tag ${day} für List Widget`); } function createNiederschlag(day) { let listForWidget = []; if (day === 1) { const prob = numVal(`${DW_CUR}.rain_probability`, null); const rain = numVal(`${DW_CUR}.rain`, null); listForWidget.push({ rightText: getRightText( (prob === null ? '-' : formatValue(prob, 0)), (prob === null ? '' : ' %'), (rain === null ? '-' : formatValue(rain, 1)), (rain === null ? '' : ' mm') ) }); } else { const prob = numVal(dwDay(day, 'Rain_Probability'), null); const rain = numVal(dwDay(day, 'Rain'), null); listForWidget.push({ rightText: getRightText( (prob === null ? '-' : formatValue(prob, 0)), (prob === null ? '' : ' %'), (rain === null ? '-' : formatValue(rain, 1)), (rain === null ? '' : ' mm') ) }); } mySetState(`${idNiederschlag}${day}`, JSON.stringify(listForWidget), 'string', `Niederschlag Tag ${day} für List Widget`); } function createWindgeschwindigkeit(day) { let listForWidget = []; if (day === 1) { const wind = numVal(`${DW_CUR}.wind_speed`, null); const gust = numVal(`${DW_CUR}.wind_gust`, null); listForWidget.push({ rightText: getRightText( (wind === null ? '-' : formatValue(wind, 0)), (wind === null ? '' : ' km/h'), (gust === null ? undefined : `Böen ${formatValue(gust, 0)}`), (gust === null ? '' : ' km/h') ) }); } else { const wind = numVal(dwDay(day, 'Wind_Speed'), null); const gust = numVal(dwDay(day, 'Wind_Gust'), null); listForWidget.push({ rightText: getRightText( (wind === null ? '-' : formatValue(wind, 0)), (wind === null ? '' : ' km/h'), (gust === null ? undefined : `Böen ${formatValue(gust, 0)}`), (gust === null ? '' : ' km/h') ) }); } mySetState(`${idWindgeschwindigkeit}${day}`, JSON.stringify(listForWidget), 'string', `Windgeschwindigkeit Tag ${day} für List Widget`); } function createWindrichtung(day) { let listForWidget = []; if (day === 1) { const dir = getVal(`${DW_CUR}.wind_direction`, '-'); listForWidget.push({ rightText: getRightText(dir, '') }); } else { const dir = getVal(dwDay(day, 'Wind_Direction'), '-'); listForWidget.push({ rightText: getRightText(dir, '') }); } mySetState(`${idWindrichtung}${day}`, JSON.stringify(listForWidget), 'string', `Windrichtung Tag ${day} für List Widget`); } function createLuftdruck(day) { let listForWidget = []; if (day === 1) { const p = numVal(`${DW_CUR}.pressure`, null); listForWidget.push({ rightText: getRightText( (p === null ? '-' : formatValue(p, 0)), (p === null ? '' : ' mbar') ) }); } else { const p = numVal(dwDay(day, 'Pressure'), null); listForWidget.push({ rightText: getRightText( (p === null ? '-' : formatValue(p, 0)), (p === null ? '' : ' mbar') ) }); } mySetState(`${idLuftdruck}${day}`, JSON.stringify(listForWidget), 'string', `Luftdruck Tag ${day} für List Widget`); } function createSchneefallgrenze(day) { let listForWidget = []; const grenze = (day === 1) ? numVal(`${DW_CUR}.snowline`, null) : numVal(dwDay(day, 'Snowline'), null); listForWidget.push({ rightText: getRightText( (grenze === null || grenze <= 0) ? '-' : formatValue(grenze, 0), (grenze === null || grenze <= 0) ? '' : ' m' ) }); mySetState(`${idSchneefallgrenze}${day}`, JSON.stringify(listForWidget), 'string', `Schneefallgrenze Tag ${day} für List Widget`); } function createSonne(day) { let listForWidget = []; const sunIn = getVal(dwDay(day, 'Sun_in'), '-'); const sunOut = getVal(dwDay(day, 'Sun_out'), '-'); listForWidget.push({ rightText: ` <div style="color: gray; height: 13px; font-size: 10px; font-family: RobotoCondensed-Light; margin-top: 2px;">Aufgang</div> <div style="display: flex; align-items: flex-end; justify-content: flex-end;"> <div style="color: #44739e; font-size: 24px; font-family: RobotoCondensed-Regular;">${sunIn}</div> </div>` }); listForWidget.push({ rightText: ` <div style="color: gray; height: 13px; font-size: 10px; font-family: RobotoCondensed-Light; margin-top: 2px;">Untergang</div> <div style="display: flex; align-items: flex-end; justify-content: flex-end;"> <div style="color: #44739e; font-size: 24px; font-family: RobotoCondensed-Regular;">${sunOut}</div> </div>` }); mySetState(`${idSonne}${day}`, JSON.stringify(listForWidget), 'string', `Sonne Infos Tag ${day} für List Widget`); } function createMond(day) { let listForWidget = []; const moonIn = getVal(dwDay(day, 'Moon_in'), '-'); const moonOut = getVal(dwDay(day, 'Moon_out'), '-'); const illum = numVal(dwDay(day, 'Moon_illumination'), null); listForWidget.push({ rightText: ` <div style="color: gray; height: 13px; font-size: 10px; font-family: RobotoCondensed-Light; margin-top: 2px;">Aufgang</div> <div style="display: flex; align-items: flex-end; justify-content: flex-end;"> <div style="color: #44739e; font-size: 24px; font-family: RobotoCondensed-Regular;">${moonIn}</div> </div>` }); listForWidget.push({ rightText: ` <div style="color: gray; height: 13px; font-size: 10px; font-family: RobotoCondensed-Light; margin-top: 2px;">Untergang</div> <div style="display: flex; align-items: flex-end; justify-content: flex-end;"> <div style="color: #44739e; font-size: 24px; font-family: RobotoCondensed-Regular;">${moonOut}</div> </div>` }); mySetState(`${idMond}${day}`, JSON.stringify(listForWidget), 'string', `Mond Infos Tag ${day} für List Widget`); const moonHtml = (illum !== null) ? `<div><span class="mdi mdi-moon-waxing-crescent materialdesign-icon-image"></span> ${formatValue(illum, 0)} %</div>` : `<div>-</div>`; mySetState(`${idMond}${day}_lumi`, moonHtml, 'string', `Mond Beleuchtung Tag ${day} für Html Widget`); } // ===================== Pollen ===================== function createPollenFlug(day) { let barData = []; if (enablePollenFlug) { mySetState(`${idVisibiltyPollenFlug}`, true, 'boolean', `Pollenflug Widgets anzeigen / ausblenden`); if (day === 1) generateData(`${idPollenFlugRegion}.json_index_today`); if (day === 2) generateData(`${idPollenFlugRegion}.json_index_tomorrow`); function generateData(idDp) { if (!existsState(idDp)) return; let raw = getVal(idDp, null); if (!raw) return; let data; try { data = JSON.parse(raw); } catch (e) { data = null; } if (data && data.length > 0) { for (const pollenInfo of data) { barData.push({ label: pollenInfo.Pollen, value: pollenInfo.Riskindex + 1, dataColor: pollenFlugFarben[pollenInfo.Riskindex], valueText: pollenFlugText[pollenInfo.Riskindex] }); } } mySetState(`${idPollenflug}${day}`, JSON.stringify(barData), 'string', `Pollenflug Tag ${day} für Bar Chart Widget`); } } else { mySetState(`${idVisibiltyPollenFlug}`, false, 'boolean', `Pollenflug Widgets anzeigen / ausblenden`); } } // ===================== Charts ===================== // Build a single 24h chart from ForecastHourly.Hour_1..Hour_24 (next 24 hours). // To keep your existing VIS bindings (Chart.Day_1..Day_5), we write the same chart for every day, // but it represents "next 24h". If you want only Day_1 chart, we can do that too. function createCharts(day) { let axisLabels = []; let temperatur = []; let temperaturColors = []; let regenWahrscheinlichkeit = []; let niederschlag = []; let temperaturAxisMax = -100; let temperaturAxisMin = 100; let niederschlagMaxVal = 0; for (let i = 1; i <= 24; i++) { // time label let t = getVal(dwHour(i, 'time'), null); if (t !== null) { let h = String(t).replace(':00', ''); axisLabels.push(`${h}h`); } else { axisLabels.push(''); } // temperature let temp = numVal(dwHour(i, 'temperature'), null); if (temp === null) { temperatur.push(null); temperaturColors.push('#888888'); } else { if (temp > temperaturAxisMax) temperaturAxisMax = temp; if (temp < temperaturAxisMin) temperaturAxisMin = temp; temperatur.push(temp); temperaturColors.push(temperaturGradientColors.getColorByValue(temp)); } // rain probability let prob = numVal(dwHour(i, 'rain_probability'), null); regenWahrscheinlichkeit.push(prob === null ? null : prob); // rain amount let rain = numVal(dwHour(i, 'rain'), 0); if (rain > niederschlagMaxVal) niederschlagMaxVal = rain; niederschlag.push(rain); } let graphs = []; graphs.push({ data: temperatur, type: 'line', color: 'gray', legendText: 'Temperatur', line_pointSizeHover: 5, line_pointSize: 0, line_Tension: 0.3, yAxis_show: false, yAxis_gridLines_show: false, yAxis_gridLines_ticks_length: 5, yAxis_min: (temperaturAxisMin < 5) ? Math.ceil((temperaturAxisMin - 5) / 5) * 5 : 0, yAxis_max: Math.ceil((temperaturAxisMax + 5) / 5) * 5, yAxis_step: 5, yAxis_position: 'left', yAxis_appendix: ' °C', yAxis_zeroLineWidth: 0.1, yAxis_zeroLineColor: 'black', displayOrder: 0, tooltip_AppendText: ' °C', datalabel_backgroundColor: temperaturColors, datalabel_color: 'white', datalabel_offset: -10, datalabel_fontFamily: 'RobotoCondensed-Light', datalabel_fontSize: 12, datalabel_borderRadius: 6, datalabel_show: 'auto', line_PointColor: temperaturColors, line_PointColorBorder: temperaturColors, line_PointColorHover: temperaturColors, line_PointColorBorderHover: temperaturColors, use_gradient_color: true, gradient_color: color_graph_temperatur_verlauf, use_line_gradient_fill_color: true, line_gradient_fill_color: temperaturGradientColors.getGradientWithOpacity(40) }); if (regenWahrscheinlichkeit.some(v => v !== null)) { graphs.push({ data: regenWahrscheinlichkeit, type: 'line', color: color_graph_regenwahrscheinlichkeit, legendText: 'Regenwahrscheinlichkeit', line_UseFillColor: true, line_pointSize: 0, line_pointSizeHover: 5, yAxis_min: 0, yAxis_max: 100, yAxis_maxSteps: 10, yAxis_position: 'left', yAxis_gridLines_show: false, yAxis_gridLines_border_show: false, yAxis_zeroLineWidth: 0.1, yAxis_zeroLineColor: 'black', yAxis_appendix: ' %', displayOrder: 1, tooltip_AppendText: ' %', datalabel_show: false, }); } if (niederschlagMaxVal > 0) { graphs.push({ data: niederschlag, type: 'bar', color: color_graph_niederschlag, legendText: 'Niederschlag', yAxis_min: 0, yAxis_max: Math.ceil((niederschlagMaxVal + 5) / 5) * 5, yAxis_maxSteps: 10, yAxis_position: 'right', yAxis_gridLines_show: false, yAxis_appendix: ' mm', yAxis_gridLines_border_show: false, yAxis_zeroLineWidth: 0.1, yAxis_zeroLineColor: 'black', displayOrder: 1, tooltip_AppendText: ' mm', datalabel_show: false, }); } const chart = { axisLabels, graphs }; mySetState(`${idChart}${day}`, JSON.stringify(chart), 'string', `Tag ${day} für Chart Widget (nächste 24h)`); } // ===================== Weekly preview graph (Daily) ===================== function createVorschauGraph(maxDays) { let axisLabels = []; let temperaturMax = []; let temperaturMin = []; let temperaturMaxColors = []; let temperaturMinColors = []; let temperaturAxisMax = -100; let temperaturAxisMin = 100; let regenWahrscheinlichkeit = []; let niederschlag = []; let niederschlagMaxVal = 0; for (let day = 1; day <= maxDays; day++) { if (!existsState(dwDay(day, 'NameOfDay'))) continue; axisLabels.push((day === 1) ? 'Heute' : getVal(dwDay(day, 'NameOfDay'), `Tag ${day}`)); const tMax = numVal(dwDay(day, 'Temperature_Max'), null); const tMin = numVal(dwDay(day, 'Temperature_Min'), null); if (tMax !== null) { if (tMax > temperaturAxisMax) temperaturAxisMax = tMax; if (tMax < temperaturAxisMin) temperaturAxisMin = tMax; temperaturMax.push(tMax); temperaturMaxColors.push(temperaturGradientColors.getColorByValue(tMax)); } else { temperaturMax.push(null); temperaturMaxColors.push('#888888'); } if (tMin !== null) { if (tMin > temperaturAxisMax) temperaturAxisMax = tMin; if (tMin < temperaturAxisMin) temperaturAxisMin = tMin; temperaturMin.push(tMin); temperaturMinColors.push(temperaturGradientColors.getColorByValue(tMin)); } else { temperaturMin.push(null); temperaturMinColors.push('#888888'); } const rain = numVal(dwDay(day, 'Rain'), 0); if (rain > niederschlagMaxVal) niederschlagMaxVal = rain; niederschlag.push(rain); const prob = numVal(dwDay(day, 'Rain_Probability'), 0); regenWahrscheinlichkeit.push(prob); } let graphs = []; graphs.push({ data: temperaturMax, type: 'line', legendText: 'max. Temperatur', line_pointSizeHover: 5, line_pointSize: 0, line_Tension: 0.3, yAxis_id: 0, yAxis_show: false, yAxis_gridLines_show: false, yAxis_gridLines_ticks_length: 5, yAxis_min: (temperaturAxisMin < 5) ? Math.ceil((temperaturAxisMin - 5) / 5) * 5 : 0, yAxis_max: Math.ceil((temperaturAxisMax + 5) / 5) * 5, yAxis_step: 5, yAxis_position: 'left', yAxis_appendix: ' °C', yAxis_zeroLineWidth: 0.1, yAxis_zeroLineColor: 'black', displayOrder: 0, tooltip_AppendText: ' °C', datalabel_backgroundColor: temperaturMaxColors, datalabel_color: 'white', datalabel_offset: -10, datalabel_fontFamily: 'RobotoCondensed-Light', datalabel_fontSize: 12, datalabel_borderRadius: 6, line_PointColor: temperaturMaxColors, line_PointColorBorder: temperaturMaxColors, line_PointColorHover: temperaturMaxColors, line_PointColorBorderHover: temperaturMaxColors, use_gradient_color: true, line_FillBetweenLines: '+1', gradient_color: color_graph_temperatur_verlauf, use_line_gradient_fill_color: true, line_gradient_fill_color: temperaturGradientColors.getGradientWithOpacity(40) }); graphs.push({ data: temperaturMin, type: 'line', legendText: 'min. Temperatur', line_pointSizeHover: 5, line_pointSize: 0, line_Tension: 0.3, yAxis_id: 0, yAxis_show: false, yAxis_gridLines_show: false, yAxis_gridLines_ticks_length: 5, yAxis_min: (temperaturAxisMin < 5) ? Math.ceil((temperaturAxisMin - 5) / 5) * 5 : 0, yAxis_max: Math.ceil((temperaturAxisMax + 5) / 5) * 5, yAxis_step: 5, yAxis_position: 'left', yAxis_appendix: ' °C', yAxis_zeroLineWidth: 0.1, yAxis_zeroLineColor: 'black', displayOrder: 0, tooltip_AppendText: ' °C', datalabel_backgroundColor: temperaturMinColors, datalabel_color: 'white', datalabel_offset: -10, datalabel_fontFamily: 'RobotoCondensed-Light', datalabel_fontSize: 12, datalabel_borderRadius: 6, line_PointColor: temperaturMinColors, line_PointColorBorder: temperaturMinColors, line_PointColorHover: temperaturMinColors, line_PointColorBorderHover: temperaturMinColors, use_gradient_color: true, gradient_color: color_graph_temperatur_verlauf }); graphs.push({ data: regenWahrscheinlichkeit, type: 'line', color: color_graph_regenwahrscheinlichkeit, legendText: 'Regenwahrscheinlichkeit', line_UseFillColor: true, line_pointSize: 0, line_pointSizeHover: 5, yAxis_min: 0, yAxis_max: 100, yAxis_maxSteps: 10, yAxis_position: 'left', yAxis_gridLines_show: false, yAxis_gridLines_border_show: true, yAxis_distance: 10, yAxis_zeroLineWidth: 0.1, yAxis_zeroLineColor: 'black', yAxis_appendix: ' %', displayOrder: 1, tooltip_AppendText: ' %', datalabel_show: false, }); if (niederschlagMaxVal > 0) { graphs.push({ data: niederschlag, type: 'bar', color: color_graph_niederschlag, legendText: 'Niederschlag', yAxis_min: 0, yAxis_max: Math.ceil((niederschlagMaxVal + 5) / 5) * 5, yAxis_maxSteps: 10, yAxis_position: 'right', yAxis_gridLines_show: false, yAxis_appendix: ' mm', yAxis_gridLines_border_show: false, yAxis_distance: 10, yAxis_zeroLineWidth: 0.1, yAxis_zeroLineColor: 'black', displayOrder: 1, tooltip_AppendText: ' mm', datalabel_show: false, }); } const chart = { axisLabels, graphs }; mySetState(`${idIconList_Vorschau_Chart}`, JSON.stringify(chart), 'string', `Vorschau Chart`); } // ===================== IconList item (Daily) ===================== function createVorschauIconListItem(day) { const title = (day === 1) ? 'Heute' : getVal(dwDay(day, 'NameOfDay'), `Tag ${day}`); const regenWahrscheinlichkeit = `${formatValue(getVal(dwDay(day, 'Rain_Probability'), 0), 0)} %`; const niederschlag = `${formatValue(getVal(dwDay(day, 'Rain'), 0), 1)} mm`; return { text: ` <div style="margin: 0 4px; text-align: center;">${title} <div style="height: 1px; background: #44739e;"></div> <div style="color: grey; font-size: 11px; font-family: RobotoCondensed-Light; white-space: break-spaces; margin-top: 5px; text-align: center;"> ${getVal(dwDay(day, 'symbol_description'), '')} </div> <div style="color: #44739e; font-family: RobotoCondensed-Regular; font-size: 16px; margin-top: 5px; text-align: center;"> ${formatValue(getVal(dwDay(day, 'Temperature_Max'), '-'), 1)}°C | ${formatValue(getVal(dwDay(day, 'Temperature_Min'), '-'), 1)}°C </div> <div style="color: grey; font-size: 11px; font-family: RobotoCondensed-Light; white-space: break-spaces; margin-top: 5px; text-align: center;"> ${regenWahrscheinlichkeit} </div> </div>`, image: getVal(dwDay(day, 'symbol_URL'), ''), subText: ` <div style="display: flex; align-items: center; margin: 0 4px;"> <div style="flex: 1;text-align: left;font-family: RobotoCondensed-Light; font-size: 11px;">Luftfeuchtigkeit</div> <div style="color: gray; font-family: RobotoCondensed-LightItalic; font-size: 10px;">${formatValue(getVal(dwDay(day, 'Humidity'), '-'), 0)} %</div> </div> <div style="display: flex; align-items: flex-start; margin: 0 4px;"> <div style="flex: 1;text-align: left;font-family: RobotoCondensed-Light; font-size: 11px;">Regen</div> <div style="color: gray; font-family: RobotoCondensed-LightItalic; font-size: 10px;">${niederschlag}</div> </div> <div style="display: flex; align-items: center; margin: 0 4px;"> <div style="flex: 1;text-align: left;font-family: RobotoCondensed-Light; font-size: 11px;">Wind</div> <div style="color: gray; font-family: RobotoCondensed-LightItalic; font-size: 10px;">${formatValue(getVal(dwDay(day, 'Wind_Speed'), '-'), 0)} km/h</div> </div> <div style="display: flex; align-items: center; margin: 0 4px;"> <div style="flex: 1;text-align: left;font-family: RobotoCondensed-Light; font-size: 11px;">Luftdruck</div> <div style="color: gray; font-family: RobotoCondensed-LightItalic; font-size: 10px;">${formatValue(getVal(dwDay(day, 'Pressure'), '-'), 0)} hPa</div> </div> <div style="display: flex; align-items: center; margin: 0 4px;"> <div style="flex: 1;text-align: left;font-family: RobotoCondensed-Light; font-size: 11px;">Schneefall</div> <div style="color: gray; font-family: RobotoCondensed-LightItalic; font-size: 10px;">${formatValue(getVal(dwDay(day, 'Snowline'), '-'), 0)} m</div> </div> <div style="display: flex; align-items: center; margin: 0 4px;"> <div style="flex: 1;text-align: left;font-family: RobotoCondensed-Light; font-size: 11px;">Sonnenaufgang</div> <div style="color: gray; font-family: RobotoCondensed-LightItalic; font-size: 10px;">${getVal(dwDay(day, 'Sun_in'), '-')}</div> </div> <div style="display: flex; align-items: center; margin: 0 4px;"> <div style="flex: 1;text-align: left;font-family: RobotoCondensed-Light; font-size: 11px;">Sonnenuntergang</div> <div style="color: gray; font-family: RobotoCondensed-LightItalic; font-size: 10px;">${getVal(dwDay(day, 'Sun_out'), '-')}</div> </div> `, listType: (day === 1) ? "text" : "buttonState", objectId: `${idDialogSchalter}${day}`, buttonStateValue: "true", "showValueLabel": "false" }; } // ===================== startup ===================== createData(); // ===================== original helper functions ===================== function getGradientColors(min, max, colorValArray) { let delta = max - min; let chromaColors = []; let chromaDomains = []; for (const item of colorValArray) { chromaColors.push(item.color); chromaDomains.push(item.value / delta); } let chroma = chromaJs.scale(chromaColors).domain(chromaDomains); return { getColorByValue: function (val) { if (val > max) return chroma(1).hex(); if (val < min) return chroma(0).hex(); return chroma(val / delta).hex(); }, getGradientWithOpacity: function (opacity) { colorValArray.forEach(item => { item.color = chromaJs(item.color).alpha(opacity / 100).hex(); }); return colorValArray; } }; } function mySetState(id, val, type, name, write = false) { if (existsState(id)) { setState(id, val, true); } else { createState(id, { name: name, type: type, read: true, write: write }, function () { setState(id, val, true); }); } }Gruß
Martin
Intel NUCs mit Proxmox / Iobroker als VM unter Debian
Raspeberry mit USB Leseköpfen für Smartmeter
Homematic und Homematic IP -
@jojo58
Ich habe nun die Datenpunkte durch meine Wetterstation ersetzt und zusätzlich Sonnen Einstrahlung und UV ergänzt.Der o.g. Fehler kommt aber weiter. Welche Version von DasWetter setzt du ein? Ich setze die Version aus Stable (4.2.0) ein.
Hier das angepasste Script:
/************************************************************************************************************************************************************************ Version: 1.0.5 created by Scrounger Dieses Skript erzeugt json strings um Wetter Informationen im VIS mit den Material Design Widgets darzustellen ========================================================================================================================================================================= !!! Voraussetzungen !!! * Material Design Widgets >= 0.3.6 * DasWetter >= 3.0.1 * weatherunderground >= 3.2.1 * Pollenflug >= 1.0.4 (optional in Skript Einstellung de- / aktivierbar) * Javascript Adapter >= 4.6.1 * Javascript Adapter NPM Module: moment, moment-timezone, moment-duration-format, chroma-js ========================================================================================================================================================================= --- Links --- * Support: https://forum.iobroker.net/topic/32232/material-design-widgets-wetter-view * Github: https://github.com/Scrounger/ioBroker.vis-materialdesign/tree/master/examples/Weather ========================================================================================================================================================================= --- Changelog --- * 1.0.0: Initial release * 1.0.1: Trigger bug fixes * 1.0.2: enable / disable option for Pollenflug Adapter added * 1.0.3: new feature of Material Design Widgets 0.3.6 added: auto show data labels on chart * 1.0.4: bug fix graphs y-Axis range, Javascript Adapter >= 4.6.1 needed, DasWetter >= 3.0.1 needed * 1.0.5: bug fix Windrichtung ************************************************************************************************************************************************************************/ /************************************************************************************************************************************************************************ Patched for DasWetter v4+ structure (ForecastDaily + ForecastHourly) Based on Scrounger Script 1.0.5 (Material Design Widgets Wetter View) JoJo-Patch 2026-01-26: Works with: - daswetter.0.location_1.ForecastDaily.Day_1..Day_5.* - daswetter.0.location_1.ForecastHourly.Current.* - daswetter.0.location_1.ForecastHourly.Hour_1..Hour_24.* Notes: - No dependency on weatherunderground for core functionality anymore. - 24h Chart uses ForecastHourly.Hour_1..Hour_24 (next 24 hours). - Daily cards use ForecastDaily fields you posted. ************************************************************************************************************************************************************************/ // ===================== Script Settings ===================== let dasWetter_Tage = 5; let idDatenpunktPrefix = '0_userdata.0'; // '0_userdata.0' or 'javascript.x' let idDatenPunktStrukturPrefix = 'vis.MaterialDesignWidgets.Wetter'; // own sensor (optional) let idSensor_Temperatur = '0_userdata.0.Wetterstation.Aussentemperatur'; let idSensor_Luftfeuchtigkeit = '0_userdata.0.Wetterstation.Aussenfeuchtigkeit'; // chart colors let color_graph_temperatur_verlauf = [ { value: -20, color: '#5b2c6f' }, { value: 0, color: '#2874a6' }, { value: 14, color: '#73c6b6' }, { value: 22, color: '#008000' }, { value: 27, color: '#FFA500' }, { value: 35, color: '#FF0000' } ]; // let color_graph_regenwahrscheinlichkeit = '#0d47a1'; let color_graph_regenwahrscheinlichkeit = '#8ae8f9'; let color_graph_niederschlag = '#6dd600'; // Pollen (optional) let enablePollenFlug = true; let idPollenFlugRegion = 'pollenflug.0.region#41.summary'; let pollenFlugFarben = ['#57bb8a', '#94bd77', '#d4c86a', '#e9b861', '#e79a69', '#dd776e', 'red']; let pollenFlugText = ['keine', 'kaum', 'gering', 'mäßig', 'mittel', 'hoch', 'stark']; // ===================== Derived IDs ===================== let idIconList_Vorschau = `${idDatenpunktPrefix}.${idDatenPunktStrukturPrefix}.Vorschau.IconList`; let idIconList_Vorschau_Chart = `${idDatenpunktPrefix}.${idDatenPunktStrukturPrefix}.Vorschau.Chart`; let idDialogSchalter = `${idDatenpunktPrefix}.${idDatenPunktStrukturPrefix}.Dialog.Day_`; let idDatum = `${idDatenpunktPrefix}.${idDatenPunktStrukturPrefix}.DatumFormat.Day_`; let idTemperatur = `${idDatenpunktPrefix}.${idDatenPunktStrukturPrefix}.Temperatur.Day_`; let idNiederschlag = `${idDatenpunktPrefix}.${idDatenPunktStrukturPrefix}.Niederschlag.Day_`; let idLuftfeuchtigkeit = `${idDatenpunktPrefix}.${idDatenPunktStrukturPrefix}.Luftfeuchtigkeit.Day_`; let idWindgeschwindigkeit = `${idDatenpunktPrefix}.${idDatenPunktStrukturPrefix}.Windgeschwindigkeit.Day_`; let idWindrichtung = `${idDatenpunktPrefix}.${idDatenPunktStrukturPrefix}.Windrichtung.Day_`; let idLuftdruck = `${idDatenpunktPrefix}.${idDatenPunktStrukturPrefix}.Luftdruck.Day_`; let idSchneefallgrenze = `${idDatenpunktPrefix}.${idDatenPunktStrukturPrefix}.Schneefallgrenze.Day_`; let idSonne = `${idDatenpunktPrefix}.${idDatenPunktStrukturPrefix}.Sonne.Day_`; let idMond = `${idDatenpunktPrefix}.${idDatenPunktStrukturPrefix}.Mond.Day_`; let idBewolkung = `${idDatenpunktPrefix}.${idDatenPunktStrukturPrefix}.Aktuell.Bewolkung`; let idUvIndex = `${idDatenpunktPrefix}.${idDatenPunktStrukturPrefix}.Aktuell.UV-Index`; let idSonneneinstrahlung = `${idDatenpunktPrefix}.${idDatenPunktStrukturPrefix}.Aktuell.Sonneneinstrahlung`; let idMeineSensoren = `${idDatenpunktPrefix}.${idDatenPunktStrukturPrefix}.Aktuell.MeineSensoren`; let idChart = `${idDatenpunktPrefix}.${idDatenPunktStrukturPrefix}.Chart.Day_`; let idVisibiltyPollenFlug = `${idDatenpunktPrefix}.${idDatenPunktStrukturPrefix}.Pollenflug.visible`; let idPollenflug = `${idDatenpunktPrefix}.${idDatenPunktStrukturPrefix}.Pollenflug.Day_`; // ===================== DasWetter paths ===================== const DW_DAILY = 'daswetter.0.location_1.ForecastDaily.Day_'; const DW_HOURLY = 'daswetter.0.location_1.ForecastHourly'; const DW_CUR = `${DW_HOURLY}.Current`; function dwDay(day, key) { return `${DW_DAILY}${day}.${key}`; } function dwHour(h, key) { return `${DW_HOURLY}.Hour_${h}.${key}`; } // ===================== imports ===================== const chromaJs = require("chroma-js"); const moment = require("moment"); moment.locale("de"); let temperaturGradientColors = getGradientColors(-20, 40, color_graph_temperatur_verlauf); // ===================== triggers ===================== on({ id: "system.adapter.daswetter.0.alive", val: false }, createData); on({ id: idSensor_Temperatur }, createData); // ===================== main ===================== function createData(obj) { try { if (obj) console.log(`Material Design Widgets: Wetter Skript triggered by '${obj.id}'`); else console.log(`Material Design Widgets: Wetter Skript gestartet`); // sanity check if (!existsState(dwDay(1, 'NameOfDay')) || !existsState(`${DW_CUR}.time`)) { console.warn(`DasWetter Datenpunkte nicht vollständig gefunden. Prüfe location_1 / ForecastDaily / ForecastHourly.`); } let vorschauIconList = []; for (let i = 1; i <= dasWetter_Tage; i++) { if (existsState(dwDay(i, 'NameOfDay'))) { vorschauIconList.push(createVorschauIconListItem(i)); createDatumFormatierung(i); createNiederschlag(i); createLuftfeuchtigkeit(i); createTemperatur(i); createWindgeschwindigkeit(i); createWindrichtung(i); createLuftdruck(i); createSchneefallgrenze(i); createSonne(i); createMond(i); createPollenFlug(i); // 24h Verlauf: aus ForecastHourly.Hour_1..24 (nur sinnvoll für "Tag 1 / nächste 24h") createCharts(i); mySetState(`${idDialogSchalter}${i}`, false, 'boolean', `Schalter um Dialog für Tag ${i} anzuzeigen`, true); } else { console.warn(`Keine Daten für Tag ${i} vorhanden! (DP: ${dwDay(i, 'NameOfDay')})`); } } // Aktuellwerte aus ForecastHourly.Current createBewolkung(); createUvIndex(); createSonneneinstrahlung(); // DasWetter liefert hier keinen solarRadiation-DP in Current (bei dir nicht gelistet) -> bleibt Platzhalter createEigeneSensoren(); // Wochen Vorschau Graph (Daily) createVorschauGraph(dasWetter_Tage); // IconList Widget Vorschau mySetState(idIconList_Vorschau, JSON.stringify(vorschauIconList), 'string', 'Vorschau Wetter für IconList Widget'); } catch (err) { console.error(`[createData] error: ${err.message}`); console.error(`[createData] stack: ${err.stack}`); } } // ===================== helpers (safe read) ===================== function getVal(id, def = null) { if (!existsState(id)) return def; const s = getState(id); return (s && s.val !== undefined && s.val !== null) ? s.val : def; } function numVal(id, def = 0) { const v = getVal(id, def); const n = parseFloat(v); return isNaN(n) ? def : n; } // formatValue as in original script expectations function formatValue(val, digits) { if (val === null || val === undefined || val === '-') return '-'; const n = parseFloat(val); if (isNaN(n)) return '-'; return n.toFixed(digits).toString().replace('.', ','); } function getRightText(val1, unitVal1, val2 = undefined, unitVal2 = undefined) { return ` <div style="display: flex; align-items: flex-end; justify-content: flex-end;"> <div style="color: #44739e; font-size: 30px; font-family: RobotoCondensed-Regular;">${val1}</div> <div style="color: #44739e; font-size: 16px; font-family: RobotoCondensed-Regular; margin-left: 2px; margin-bottom: 4px;">${unitVal1}</div> </div> ${(val2 !== undefined) ? `<div style="color: gray; height: 13px; font-size: 12px; font-family: RobotoCondensed-Light; margin-top: 2px;">${val2}${unitVal2}</div>` : ''}` } // ===================== widgets: own sensors ===================== function createEigeneSensoren() { let listForWidget = []; if (existsState(idSensor_Temperatur)) { listForWidget.push({ rightText: getRightText( formatValue(getVal(idSensor_Temperatur, 0), 1), ' °C', formatValue(getVal(idSensor_Luftfeuchtigkeit, 0), 0), ' %' ) }); } mySetState(`${idMeineSensoren}`, JSON.stringify(listForWidget), 'string', `Werte eigener Sensoren aktuell für List Widget`); } // ===================== widgets: Current ===================== function createBewolkung() { const clouds = numVal(`${DW_CUR}.clouds`, null); let listForWidget = [{ rightText: getRightText( (clouds === null ? '-' : formatValue(clouds, 0)), (clouds === null ? '' : ' %') ) }]; mySetState(`${idBewolkung}`, JSON.stringify(listForWidget), 'string', `Bewölkung aktuell für List Widget`); } function createUvIndex() { let listForWidget = []; listForWidget.push({ rightText: getRightText( formatValue(getState(`0_userdata.0.Wetterstation.UV_Index`).val, 0), '' ) }) mySetState(`${idUvIndex}`, JSON.stringify(listForWidget), 'string', `UV-Index aktuell für List Widget`); } function createSonneneinstrahlung() { let listForWidget = []; listForWidget.push({ rightText: getRightText( formatValue(getState(`0_userdata.0.Wetterstation.Sonnenstrahlung`).val, 0), ' w/m²', ) }) mySetState(`${idSonneneinstrahlung}`, JSON.stringify(listForWidget), 'string', `Sonneneinstrahlung aktuell für List Widget`); } // ===================== widgets: Daily ===================== function createDatumFormatierung(day) { const idDasWetter = `daswetter.0.location_1.ForecastDaily.Day_${day}`; // robust: erst date_full, fallback date const rawDate = getVal(`${idDasWetter}.date_full`, null) || getVal(`${idDasWetter}.date`, null); const formatiertesDatum = rawDate ? moment(new Date(rawDate)).format("dddd, D. MMMM YYYY") : '-'; mySetState( `${idDatum}${day}`, formatiertesDatum, 'string', `Formatiertes Datum Tag ${day}` ); } function createTemperatur(day) { let listForWidget = []; if (day === 1) { // aktuelle Temp aus Current const temp = numVal(`${DW_CUR}.temperature`, null); const felt = numVal(`${DW_CUR}.temperature_feels_like`, null); listForWidget.push({ rightText: getRightText( (temp === null ? '-' : formatValue(temp, 1)), '°C', (temp !== null && felt !== null && temp !== felt) ? `gefühlt ${formatValue(felt, 1)}` : undefined, '°C' ) }); } else { const tMax = numVal(dwDay(day, 'Temperature_Max'), null); const tMin = numVal(dwDay(day, 'Temperature_Min'), null); listForWidget.push({ rightText: getRightText( (tMax === null ? '-' : formatValue(tMax, 1)), '°C', `Nachts ${(tMin === null ? '-' : formatValue(tMin, 1))}`, '°C' ) }); } mySetState(`${idTemperatur}${day}`, JSON.stringify(listForWidget), 'string', `Temperatur Tag ${day} für List Widget`); } function createLuftfeuchtigkeit(day) { let listForWidget = []; if (day === 1) { const hum = numVal(`${DW_CUR}.humidity`, null); listForWidget.push({ rightText: getRightText( (hum === null ? '-' : formatValue(hum, 0)), (hum === null ? '' : ' %') ) }); } else { const hum = numVal(dwDay(day, 'Humidity'), null); listForWidget.push({ rightText: getRightText( (hum === null ? '-' : formatValue(hum, 0)), (hum === null ? '' : ' %') ) }); } mySetState(`${idLuftfeuchtigkeit}${day}`, JSON.stringify(listForWidget), 'string', `Luftfeuchtigkeit Tag ${day} für List Widget`); } function createNiederschlag(day) { let listForWidget = []; if (day === 1) { const prob = numVal(`${DW_CUR}.rain_probability`, null); const rain = numVal(`${DW_CUR}.rain`, null); listForWidget.push({ rightText: getRightText( (prob === null ? '-' : formatValue(prob, 0)), (prob === null ? '' : ' %'), (rain === null ? '-' : formatValue(rain, 1)), (rain === null ? '' : ' mm') ) }); } else { const prob = numVal(dwDay(day, 'Rain_Probability'), null); const rain = numVal(dwDay(day, 'Rain'), null); listForWidget.push({ rightText: getRightText( (prob === null ? '-' : formatValue(prob, 0)), (prob === null ? '' : ' %'), (rain === null ? '-' : formatValue(rain, 1)), (rain === null ? '' : ' mm') ) }); } mySetState(`${idNiederschlag}${day}`, JSON.stringify(listForWidget), 'string', `Niederschlag Tag ${day} für List Widget`); } function createWindgeschwindigkeit(day) { let listForWidget = []; if (day === 1) { const wind = numVal(`${DW_CUR}.wind_speed`, null); const gust = numVal(`${DW_CUR}.wind_gust`, null); listForWidget.push({ rightText: getRightText( (wind === null ? '-' : formatValue(wind, 0)), (wind === null ? '' : ' km/h'), (gust === null ? undefined : `Böen ${formatValue(gust, 0)}`), (gust === null ? '' : ' km/h') ) }); } else { const wind = numVal(dwDay(day, 'Wind_Speed'), null); const gust = numVal(dwDay(day, 'Wind_Gust'), null); listForWidget.push({ rightText: getRightText( (wind === null ? '-' : formatValue(wind, 0)), (wind === null ? '' : ' km/h'), (gust === null ? undefined : `Böen ${formatValue(gust, 0)}`), (gust === null ? '' : ' km/h') ) }); } mySetState(`${idWindgeschwindigkeit}${day}`, JSON.stringify(listForWidget), 'string', `Windgeschwindigkeit Tag ${day} für List Widget`); } function createWindrichtung(day) { let listForWidget = []; if (day === 1) { const dir = getVal(`${DW_CUR}.wind_direction`, '-'); listForWidget.push({ rightText: getRightText(dir, '') }); } else { const dir = getVal(dwDay(day, 'Wind_Direction'), '-'); listForWidget.push({ rightText: getRightText(dir, '') }); } mySetState(`${idWindrichtung}${day}`, JSON.stringify(listForWidget), 'string', `Windrichtung Tag ${day} für List Widget`); } function createLuftdruck(day) { let listForWidget = []; if (day === 1) { const p = numVal(`${DW_CUR}.pressure`, null); listForWidget.push({ rightText: getRightText( (p === null ? '-' : formatValue(p, 0)), (p === null ? '' : ' mbar') ) }); } else { const p = numVal(dwDay(day, 'Pressure'), null); listForWidget.push({ rightText: getRightText( (p === null ? '-' : formatValue(p, 0)), (p === null ? '' : ' mbar') ) }); } mySetState(`${idLuftdruck}${day}`, JSON.stringify(listForWidget), 'string', `Luftdruck Tag ${day} für List Widget`); } function createSchneefallgrenze(day) { let listForWidget = []; const grenze = (day === 1) ? numVal(`${DW_CUR}.snowline`, null) : numVal(dwDay(day, 'Snowline'), null); listForWidget.push({ rightText: getRightText( (grenze === null || grenze <= 0) ? '-' : formatValue(grenze, 0), (grenze === null || grenze <= 0) ? '' : ' m' ) }); mySetState(`${idSchneefallgrenze}${day}`, JSON.stringify(listForWidget), 'string', `Schneefallgrenze Tag ${day} für List Widget`); } function createSonne(day) { let listForWidget = []; const sunIn = getVal(dwDay(day, 'Sun_in'), '-'); const sunOut = getVal(dwDay(day, 'Sun_out'), '-'); listForWidget.push({ rightText: ` <div style="color: gray; height: 13px; font-size: 10px; font-family: RobotoCondensed-Light; margin-top: 2px;">Aufgang</div> <div style="display: flex; align-items: flex-end; justify-content: flex-end;"> <div style="color: #44739e; font-size: 24px; font-family: RobotoCondensed-Regular;">${sunIn}</div> </div>` }); listForWidget.push({ rightText: ` <div style="color: gray; height: 13px; font-size: 10px; font-family: RobotoCondensed-Light; margin-top: 2px;">Untergang</div> <div style="display: flex; align-items: flex-end; justify-content: flex-end;"> <div style="color: #44739e; font-size: 24px; font-family: RobotoCondensed-Regular;">${sunOut}</div> </div>` }); mySetState(`${idSonne}${day}`, JSON.stringify(listForWidget), 'string', `Sonne Infos Tag ${day} für List Widget`); } function createMond(day) { let listForWidget = []; const moonIn = getVal(dwDay(day, 'Moon_in'), '-'); const moonOut = getVal(dwDay(day, 'Moon_out'), '-'); const illum = numVal(dwDay(day, 'Moon_illumination'), null); listForWidget.push({ rightText: ` <div style="color: gray; height: 13px; font-size: 10px; font-family: RobotoCondensed-Light; margin-top: 2px;">Aufgang</div> <div style="display: flex; align-items: flex-end; justify-content: flex-end;"> <div style="color: #44739e; font-size: 24px; font-family: RobotoCondensed-Regular;">${moonIn}</div> </div>` }); listForWidget.push({ rightText: ` <div style="color: gray; height: 13px; font-size: 10px; font-family: RobotoCondensed-Light; margin-top: 2px;">Untergang</div> <div style="display: flex; align-items: flex-end; justify-content: flex-end;"> <div style="color: #44739e; font-size: 24px; font-family: RobotoCondensed-Regular;">${moonOut}</div> </div>` }); mySetState(`${idMond}${day}`, JSON.stringify(listForWidget), 'string', `Mond Infos Tag ${day} für List Widget`); const moonHtml = (illum !== null) ? `<div><span class="mdi mdi-moon-waxing-crescent materialdesign-icon-image"></span> ${formatValue(illum, 0)} %</div>` : `<div>-</div>`; mySetState(`${idMond}${day}_lumi`, moonHtml, 'string', `Mond Beleuchtung Tag ${day} für Html Widget`); } // ===================== Pollen ===================== function createPollenFlug(day) { let barData = []; if (enablePollenFlug) { mySetState(`${idVisibiltyPollenFlug}`, true, 'boolean', `Pollenflug Widgets anzeigen / ausblenden`); if (day === 1) generateData(`${idPollenFlugRegion}.json_index_today`); if (day === 2) generateData(`${idPollenFlugRegion}.json_index_tomorrow`); function generateData(idDp) { if (!existsState(idDp)) return; let raw = getVal(idDp, null); if (!raw) return; let data; try { data = JSON.parse(raw); } catch (e) { data = null; } if (data && data.length > 0) { for (const pollenInfo of data) { barData.push({ label: pollenInfo.Pollen, value: pollenInfo.Riskindex + 1, dataColor: pollenFlugFarben[pollenInfo.Riskindex], valueText: pollenFlugText[pollenInfo.Riskindex] }); } } mySetState(`${idPollenflug}${day}`, JSON.stringify(barData), 'string', `Pollenflug Tag ${day} für Bar Chart Widget`); } } else { mySetState(`${idVisibiltyPollenFlug}`, false, 'boolean', `Pollenflug Widgets anzeigen / ausblenden`); } } // ===================== Charts ===================== // Build a single 24h chart from ForecastHourly.Hour_1..Hour_24 (next 24 hours). // To keep your existing VIS bindings (Chart.Day_1..Day_5), we write the same chart for every day, // but it represents "next 24h". If you want only Day_1 chart, we can do that too. function createCharts(day) { let axisLabels = []; let temperatur = []; let temperaturColors = []; let regenWahrscheinlichkeit = []; let niederschlag = []; let temperaturAxisMax = -100; let temperaturAxisMin = 100; let niederschlagMaxVal = 0; for (let i = 1; i <= 24; i++) { // time label let t = getVal(dwHour(i, 'time'), null); if (t !== null) { let h = String(t).replace(':00', ''); axisLabels.push(`${h}h`); } else { axisLabels.push(''); } // temperature let temp = numVal(dwHour(i, 'temperature'), null); if (temp === null) { temperatur.push(null); temperaturColors.push('#888888'); } else { if (temp > temperaturAxisMax) temperaturAxisMax = temp; if (temp < temperaturAxisMin) temperaturAxisMin = temp; temperatur.push(temp); temperaturColors.push(temperaturGradientColors.getColorByValue(temp)); } // rain probability let prob = numVal(dwHour(i, 'rain_probability'), null); regenWahrscheinlichkeit.push(prob === null ? null : prob); // rain amount let rain = numVal(dwHour(i, 'rain'), 0); if (rain > niederschlagMaxVal) niederschlagMaxVal = rain; niederschlag.push(rain); } let graphs = []; graphs.push({ data: temperatur, type: 'line', color: 'gray', legendText: 'Temperatur', line_pointSizeHover: 5, line_pointSize: 0, line_Tension: 0.3, yAxis_show: false, yAxis_gridLines_show: false, yAxis_gridLines_ticks_length: 5, yAxis_min: (temperaturAxisMin < 5) ? Math.ceil((temperaturAxisMin - 5) / 5) * 5 : 0, yAxis_max: Math.ceil((temperaturAxisMax + 5) / 5) * 5, yAxis_step: 5, yAxis_position: 'left', yAxis_appendix: ' °C', yAxis_zeroLineWidth: 0.1, yAxis_zeroLineColor: 'black', displayOrder: 0, tooltip_AppendText: ' °C', datalabel_backgroundColor: temperaturColors, datalabel_color: 'white', datalabel_offset: -10, datalabel_fontFamily: 'RobotoCondensed-Light', datalabel_fontSize: 12, datalabel_borderRadius: 6, datalabel_show: 'auto', line_PointColor: temperaturColors, line_PointColorBorder: temperaturColors, line_PointColorHover: temperaturColors, line_PointColorBorderHover: temperaturColors, use_gradient_color: true, gradient_color: color_graph_temperatur_verlauf, use_line_gradient_fill_color: true, line_gradient_fill_color: temperaturGradientColors.getGradientWithOpacity(40) }); if (regenWahrscheinlichkeit.some(v => v !== null)) { graphs.push({ data: regenWahrscheinlichkeit, type: 'line', color: color_graph_regenwahrscheinlichkeit, legendText: 'Regenwahrscheinlichkeit', line_UseFillColor: true, line_pointSize: 0, line_pointSizeHover: 5, yAxis_min: 0, yAxis_max: 100, yAxis_maxSteps: 10, yAxis_position: 'left', yAxis_gridLines_show: false, yAxis_gridLines_border_show: false, yAxis_zeroLineWidth: 0.1, yAxis_zeroLineColor: 'black', yAxis_appendix: ' %', displayOrder: 1, tooltip_AppendText: ' %', datalabel_show: false, }); } if (niederschlagMaxVal > 0) { graphs.push({ data: niederschlag, type: 'bar', color: color_graph_niederschlag, legendText: 'Niederschlag', yAxis_min: 0, yAxis_max: Math.ceil((niederschlagMaxVal + 5) / 5) * 5, yAxis_maxSteps: 10, yAxis_position: 'right', yAxis_gridLines_show: false, yAxis_appendix: ' mm', yAxis_gridLines_border_show: false, yAxis_zeroLineWidth: 0.1, yAxis_zeroLineColor: 'black', displayOrder: 1, tooltip_AppendText: ' mm', datalabel_show: false, }); } const chart = { axisLabels, graphs }; mySetState(`${idChart}${day}`, JSON.stringify(chart), 'string', `Tag ${day} für Chart Widget (nächste 24h)`); } // ===================== Weekly preview graph (Daily) ===================== function createVorschauGraph(maxDays) { let axisLabels = []; let temperaturMax = []; let temperaturMin = []; let temperaturMaxColors = []; let temperaturMinColors = []; let temperaturAxisMax = -100; let temperaturAxisMin = 100; let regenWahrscheinlichkeit = []; let niederschlag = []; let niederschlagMaxVal = 0; for (let day = 1; day <= maxDays; day++) { if (!existsState(dwDay(day, 'NameOfDay'))) continue; axisLabels.push((day === 1) ? 'Heute' : getVal(dwDay(day, 'NameOfDay'), `Tag ${day}`)); const tMax = numVal(dwDay(day, 'Temperature_Max'), null); const tMin = numVal(dwDay(day, 'Temperature_Min'), null); if (tMax !== null) { if (tMax > temperaturAxisMax) temperaturAxisMax = tMax; if (tMax < temperaturAxisMin) temperaturAxisMin = tMax; temperaturMax.push(tMax); temperaturMaxColors.push(temperaturGradientColors.getColorByValue(tMax)); } else { temperaturMax.push(null); temperaturMaxColors.push('#888888'); } if (tMin !== null) { if (tMin > temperaturAxisMax) temperaturAxisMax = tMin; if (tMin < temperaturAxisMin) temperaturAxisMin = tMin; temperaturMin.push(tMin); temperaturMinColors.push(temperaturGradientColors.getColorByValue(tMin)); } else { temperaturMin.push(null); temperaturMinColors.push('#888888'); } const rain = numVal(dwDay(day, 'Rain'), 0); if (rain > niederschlagMaxVal) niederschlagMaxVal = rain; niederschlag.push(rain); const prob = numVal(dwDay(day, 'Rain_Probability'), 0); regenWahrscheinlichkeit.push(prob); } let graphs = []; graphs.push({ data: temperaturMax, type: 'line', legendText: 'max. Temperatur', line_pointSizeHover: 5, line_pointSize: 0, line_Tension: 0.3, yAxis_id: 0, yAxis_show: false, yAxis_gridLines_show: false, yAxis_gridLines_ticks_length: 5, yAxis_min: (temperaturAxisMin < 5) ? Math.ceil((temperaturAxisMin - 5) / 5) * 5 : 0, yAxis_max: Math.ceil((temperaturAxisMax + 5) / 5) * 5, yAxis_step: 5, yAxis_position: 'left', yAxis_appendix: ' °C', yAxis_zeroLineWidth: 0.1, yAxis_zeroLineColor: 'black', displayOrder: 0, tooltip_AppendText: ' °C', datalabel_backgroundColor: temperaturMaxColors, datalabel_color: 'white', datalabel_offset: -10, datalabel_fontFamily: 'RobotoCondensed-Light', datalabel_fontSize: 12, datalabel_borderRadius: 6, line_PointColor: temperaturMaxColors, line_PointColorBorder: temperaturMaxColors, line_PointColorHover: temperaturMaxColors, line_PointColorBorderHover: temperaturMaxColors, use_gradient_color: true, line_FillBetweenLines: '+1', gradient_color: color_graph_temperatur_verlauf, use_line_gradient_fill_color: true, line_gradient_fill_color: temperaturGradientColors.getGradientWithOpacity(40) }); graphs.push({ data: temperaturMin, type: 'line', legendText: 'min. Temperatur', line_pointSizeHover: 5, line_pointSize: 0, line_Tension: 0.3, yAxis_id: 0, yAxis_show: false, yAxis_gridLines_show: false, yAxis_gridLines_ticks_length: 5, yAxis_min: (temperaturAxisMin < 5) ? Math.ceil((temperaturAxisMin - 5) / 5) * 5 : 0, yAxis_max: Math.ceil((temperaturAxisMax + 5) / 5) * 5, yAxis_step: 5, yAxis_position: 'left', yAxis_appendix: ' °C', yAxis_zeroLineWidth: 0.1, yAxis_zeroLineColor: 'black', displayOrder: 0, tooltip_AppendText: ' °C', datalabel_backgroundColor: temperaturMinColors, datalabel_color: 'white', datalabel_offset: -10, datalabel_fontFamily: 'RobotoCondensed-Light', datalabel_fontSize: 12, datalabel_borderRadius: 6, line_PointColor: temperaturMinColors, line_PointColorBorder: temperaturMinColors, line_PointColorHover: temperaturMinColors, line_PointColorBorderHover: temperaturMinColors, use_gradient_color: true, gradient_color: color_graph_temperatur_verlauf }); graphs.push({ data: regenWahrscheinlichkeit, type: 'line', color: color_graph_regenwahrscheinlichkeit, legendText: 'Regenwahrscheinlichkeit', line_UseFillColor: true, line_pointSize: 0, line_pointSizeHover: 5, yAxis_min: 0, yAxis_max: 100, yAxis_maxSteps: 10, yAxis_position: 'left', yAxis_gridLines_show: false, yAxis_gridLines_border_show: true, yAxis_distance: 10, yAxis_zeroLineWidth: 0.1, yAxis_zeroLineColor: 'black', yAxis_appendix: ' %', displayOrder: 1, tooltip_AppendText: ' %', datalabel_show: false, }); if (niederschlagMaxVal > 0) { graphs.push({ data: niederschlag, type: 'bar', color: color_graph_niederschlag, legendText: 'Niederschlag', yAxis_min: 0, yAxis_max: Math.ceil((niederschlagMaxVal + 5) / 5) * 5, yAxis_maxSteps: 10, yAxis_position: 'right', yAxis_gridLines_show: false, yAxis_appendix: ' mm', yAxis_gridLines_border_show: false, yAxis_distance: 10, yAxis_zeroLineWidth: 0.1, yAxis_zeroLineColor: 'black', displayOrder: 1, tooltip_AppendText: ' mm', datalabel_show: false, }); } const chart = { axisLabels, graphs }; mySetState(`${idIconList_Vorschau_Chart}`, JSON.stringify(chart), 'string', `Vorschau Chart`); } // ===================== IconList item (Daily) ===================== function createVorschauIconListItem(day) { const title = (day === 1) ? 'Heute' : getVal(dwDay(day, 'NameOfDay'), `Tag ${day}`); const regenWahrscheinlichkeit = `${formatValue(getVal(dwDay(day, 'Rain_Probability'), 0), 0)} %`; const niederschlag = `${formatValue(getVal(dwDay(day, 'Rain'), 0), 1)} mm`; return { text: ` <div style="margin: 0 4px; text-align: center;">${title} <div style="height: 1px; background: #44739e;"></div> <div style="color: grey; font-size: 11px; font-family: RobotoCondensed-Light; white-space: break-spaces; margin-top: 5px; text-align: center;"> ${getVal(dwDay(day, 'symbol_description'), '')} </div> <div style="color: #44739e; font-family: RobotoCondensed-Regular; font-size: 16px; margin-top: 5px; text-align: center;"> ${formatValue(getVal(dwDay(day, 'Temperature_Max'), '-'), 1)}°C | ${formatValue(getVal(dwDay(day, 'Temperature_Min'), '-'), 1)}°C </div> <div style="color: grey; font-size: 11px; font-family: RobotoCondensed-Light; white-space: break-spaces; margin-top: 5px; text-align: center;"> ${regenWahrscheinlichkeit} </div> </div>`, image: getVal(dwDay(day, 'symbol_URL'), ''), subText: ` <div style="display: flex; align-items: center; margin: 0 4px;"> <div style="flex: 1;text-align: left;font-family: RobotoCondensed-Light; font-size: 11px;">Luftfeuchtigkeit</div> <div style="color: gray; font-family: RobotoCondensed-LightItalic; font-size: 10px;">${formatValue(getVal(dwDay(day, 'Humidity'), '-'), 0)} %</div> </div> <div style="display: flex; align-items: flex-start; margin: 0 4px;"> <div style="flex: 1;text-align: left;font-family: RobotoCondensed-Light; font-size: 11px;">Regen</div> <div style="color: gray; font-family: RobotoCondensed-LightItalic; font-size: 10px;">${niederschlag}</div> </div> <div style="display: flex; align-items: center; margin: 0 4px;"> <div style="flex: 1;text-align: left;font-family: RobotoCondensed-Light; font-size: 11px;">Wind</div> <div style="color: gray; font-family: RobotoCondensed-LightItalic; font-size: 10px;">${formatValue(getVal(dwDay(day, 'Wind_Speed'), '-'), 0)} km/h</div> </div> <div style="display: flex; align-items: center; margin: 0 4px;"> <div style="flex: 1;text-align: left;font-family: RobotoCondensed-Light; font-size: 11px;">Luftdruck</div> <div style="color: gray; font-family: RobotoCondensed-LightItalic; font-size: 10px;">${formatValue(getVal(dwDay(day, 'Pressure'), '-'), 0)} hPa</div> </div> <div style="display: flex; align-items: center; margin: 0 4px;"> <div style="flex: 1;text-align: left;font-family: RobotoCondensed-Light; font-size: 11px;">Schneefall</div> <div style="color: gray; font-family: RobotoCondensed-LightItalic; font-size: 10px;">${formatValue(getVal(dwDay(day, 'Snowline'), '-'), 0)} m</div> </div> <div style="display: flex; align-items: center; margin: 0 4px;"> <div style="flex: 1;text-align: left;font-family: RobotoCondensed-Light; font-size: 11px;">Sonnenaufgang</div> <div style="color: gray; font-family: RobotoCondensed-LightItalic; font-size: 10px;">${getVal(dwDay(day, 'Sun_in'), '-')}</div> </div> <div style="display: flex; align-items: center; margin: 0 4px;"> <div style="flex: 1;text-align: left;font-family: RobotoCondensed-Light; font-size: 11px;">Sonnenuntergang</div> <div style="color: gray; font-family: RobotoCondensed-LightItalic; font-size: 10px;">${getVal(dwDay(day, 'Sun_out'), '-')}</div> </div> `, listType: (day === 1) ? "text" : "buttonState", objectId: `${idDialogSchalter}${day}`, buttonStateValue: "true", "showValueLabel": "false" }; } // ===================== startup ===================== createData(); // ===================== original helper functions ===================== function getGradientColors(min, max, colorValArray) { let delta = max - min; let chromaColors = []; let chromaDomains = []; for (const item of colorValArray) { chromaColors.push(item.color); chromaDomains.push(item.value / delta); } let chroma = chromaJs.scale(chromaColors).domain(chromaDomains); return { getColorByValue: function (val) { if (val > max) return chroma(1).hex(); if (val < min) return chroma(0).hex(); return chroma(val / delta).hex(); }, getGradientWithOpacity: function (opacity) { colorValArray.forEach(item => { item.color = chromaJs(item.color).alpha(opacity / 100).hex(); }); return colorValArray; } }; } function mySetState(id, val, type, name, write = false) { if (existsState(id)) { setState(id, val, true); } else { createState(id, { name: name, type: type, read: true, write: write }, function () { setState(id, val, true); }); } } -
Ich habe die Version 4.4.1 im Einsatz, gestern installiert und dann das Script und VIS umgestellt.
Hey! Du scheinst an dieser Unterhaltung interessiert zu sein, hast aber noch kein Konto.
Hast du es satt, bei jedem Besuch durch die gleichen Beiträge zu scrollen? Wenn du dich für ein Konto anmeldest, kommst du immer genau dorthin zurück, wo du zuvor warst, und kannst dich über neue Antworten benachrichtigen lassen (entweder per E-Mail oder Push-Benachrichtigung). Du kannst auch Lesezeichen speichern und Beiträge positiv bewerten, um anderen Community-Mitgliedern deine Wertschätzung zu zeigen.
Mit deinem Input könnte dieser Beitrag noch besser werden 💗
Registrieren AnmeldenSupport us
464
Online33.0k
Benutzer83.4k
Themen1.3m
Beiträge