NEWS


Grafana Tagesverbrauch
-
@crunchip sagte in Grafana Tagesverbrauch:
ich nehme den Wert aus meinem Pulscounter, also den Gesamtzählerwert, den Rest macht ja Grafana.
Monatsverbrauch hätt ich noch als DP dieser Dose.
Wird aber auch nicht viel bringen?@Negalein du müsstest dann
sourceanalytix.0.xyz.Meter_Readings.Current_Readingfür deinen Grafana Datenpunkt nehmen -
@Negalein musst du ja nicht, du startest mit dem jetzigen Wert, ab Montag startet die Berechnung für die neue Woche automatisch
@crunchip sagte in Grafana Tagesverbrauch:
musst du ja nicht, du startest mit dem jetzigen Wert, ab Montag startet die Berechnung für die neue Woche automatisch
Ok, ich dachte du meinst ich muss den Wert überall eintragen.
@crunchip sagte in Grafana Tagesverbrauch:
du müsstest dann sourceanalytix.0.xyz.Meter_Readings.Current_Reading für deinen Grafana Datenpunkt nehmen
Und so die Formel dann verwenden?
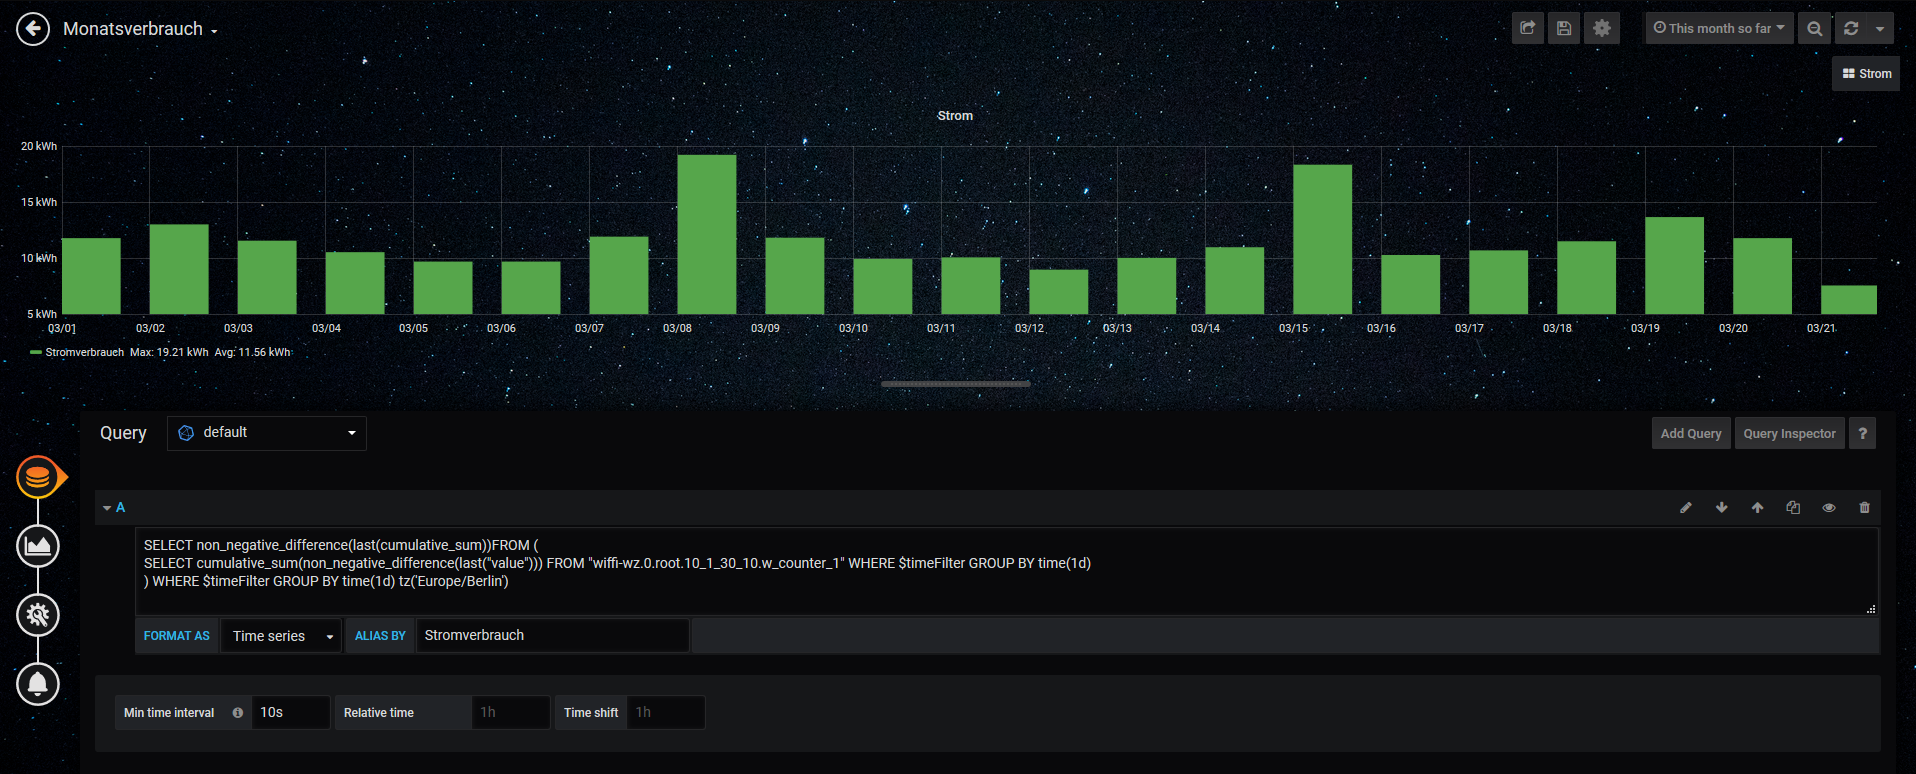
SELECT non_negative_difference(last(cumulative_sum))FROM ( SELECT cumulative_sum(non_negative_difference(last("value"))) FROM "sourceanalytix.0.hs100__0__10_0_1_80__power.Meter_Readings.Current_Reading" WHERE $timeFilter GROUP BY time(1d) ) WHERE $timeFilter GROUP BY time(1d) tz('Europe/Berlin')Dann bekomm ich für jeden Tag einen eigenen Balken?
° Node.js & System Update ---> sudo apt update, iob stop, sudo apt full-upgrade
° Node.js Fixer ---> iob nodejs-update
° Fixer ---> iob fix -
@crunchip sagte in Grafana Tagesverbrauch:
musst du ja nicht, du startest mit dem jetzigen Wert, ab Montag startet die Berechnung für die neue Woche automatisch
Ok, ich dachte du meinst ich muss den Wert überall eintragen.
@crunchip sagte in Grafana Tagesverbrauch:
du müsstest dann sourceanalytix.0.xyz.Meter_Readings.Current_Reading für deinen Grafana Datenpunkt nehmen
Und so die Formel dann verwenden?
SELECT non_negative_difference(last(cumulative_sum))FROM ( SELECT cumulative_sum(non_negative_difference(last("value"))) FROM "sourceanalytix.0.hs100__0__10_0_1_80__power.Meter_Readings.Current_Reading" WHERE $timeFilter GROUP BY time(1d) ) WHERE $timeFilter GROUP BY time(1d) tz('Europe/Berlin')Dann bekomm ich für jeden Tag einen eigenen Balken?
@Negalein sagte in Grafana Tagesverbrauch:
Dann bekomm ich für jeden Tag einen eigenen Balken
ja
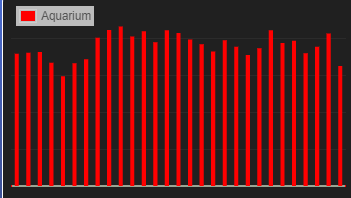
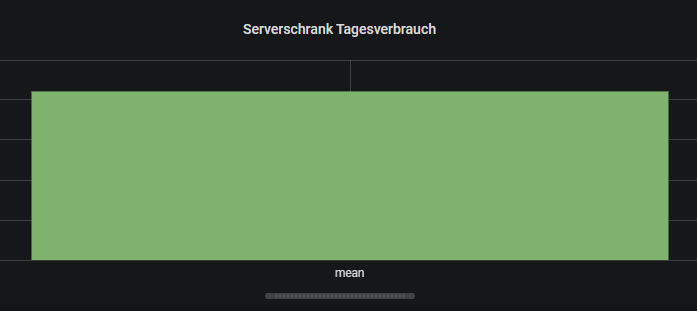
hier ein Beispiel,
jeden Tag kommt ein Balken dazu...am Monatsanfang beginnt es wieder mit einem Balken
umgestiegen von Proxmox auf Unraid
-
@Negalein sagte in Grafana Tagesverbrauch:
Dann bekomm ich für jeden Tag einen eigenen Balken
ja
hier ein Beispiel,
jeden Tag kommt ein Balken dazu...am Monatsanfang beginnt es wieder mit einem Balken
° Node.js & System Update ---> sudo apt update, iob stop, sudo apt full-upgrade
° Node.js Fixer ---> iob nodejs-update
° Fixer ---> iob fix -
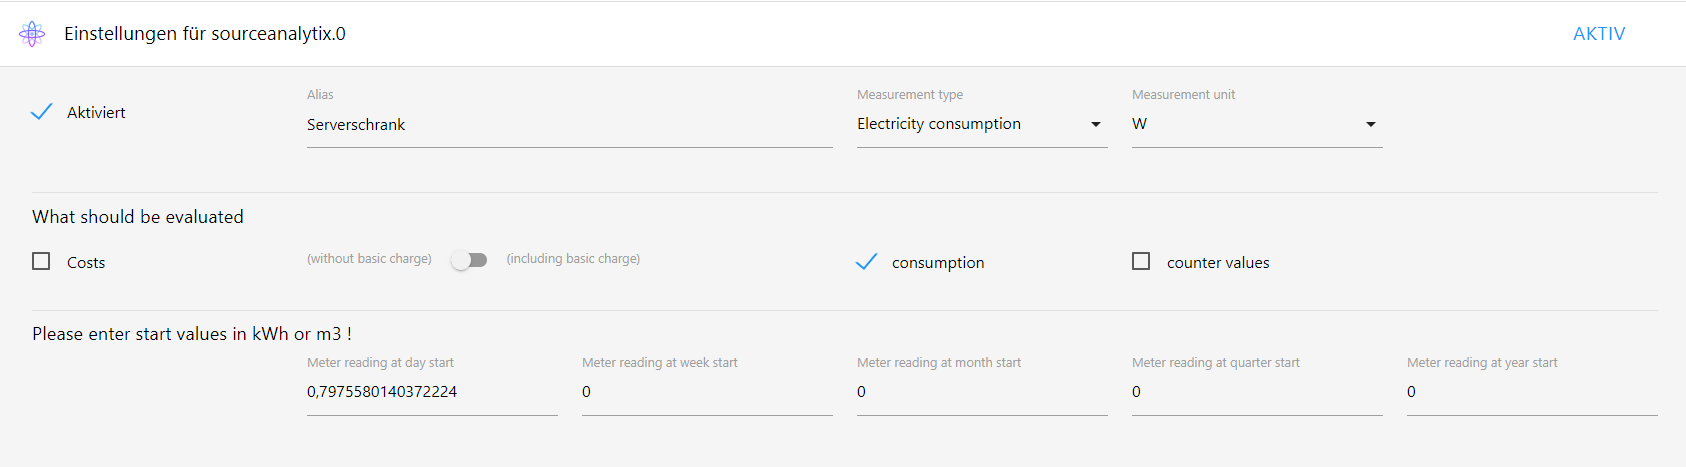
@Negalein einzelne Geräte oder auch über sourceanalytix kannst du dann so einstellen
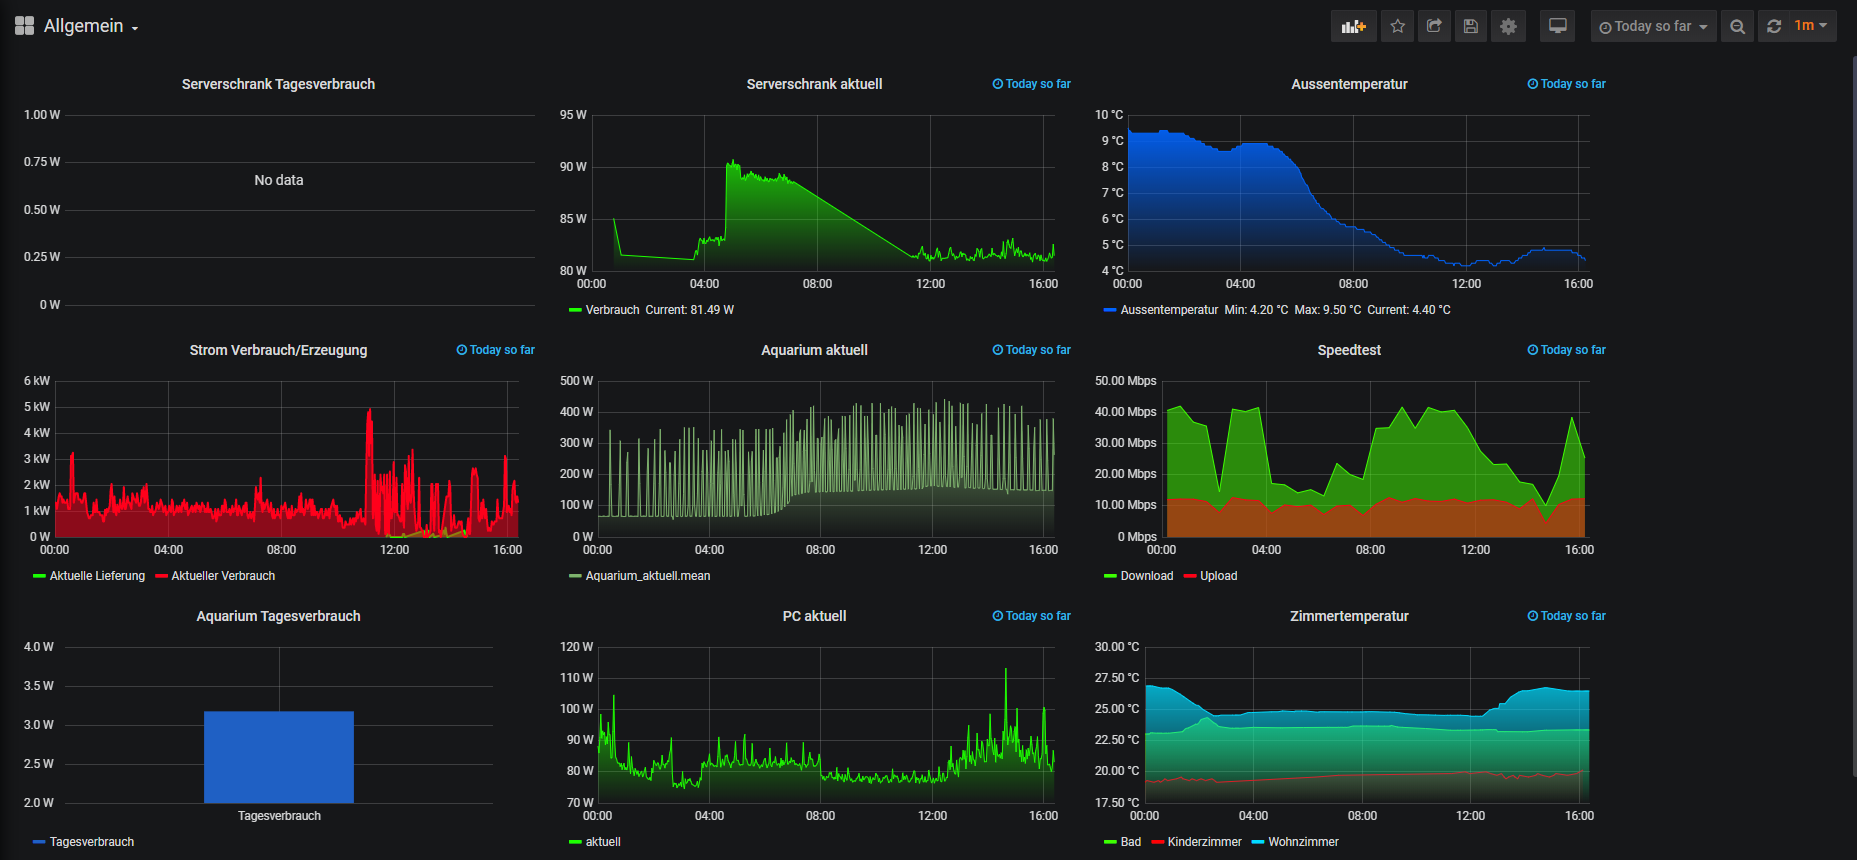
Beispiel
umgestiegen von Proxmox auf Unraid
-
@Negalein einzelne Geräte oder auch über sourceanalytix kannst du dann so einstellen
Beispiel
@crunchip sagte in Grafana Tagesverbrauch:
einzelne Geräte oder auch über sourceanalytix kannst du dann so einstellen
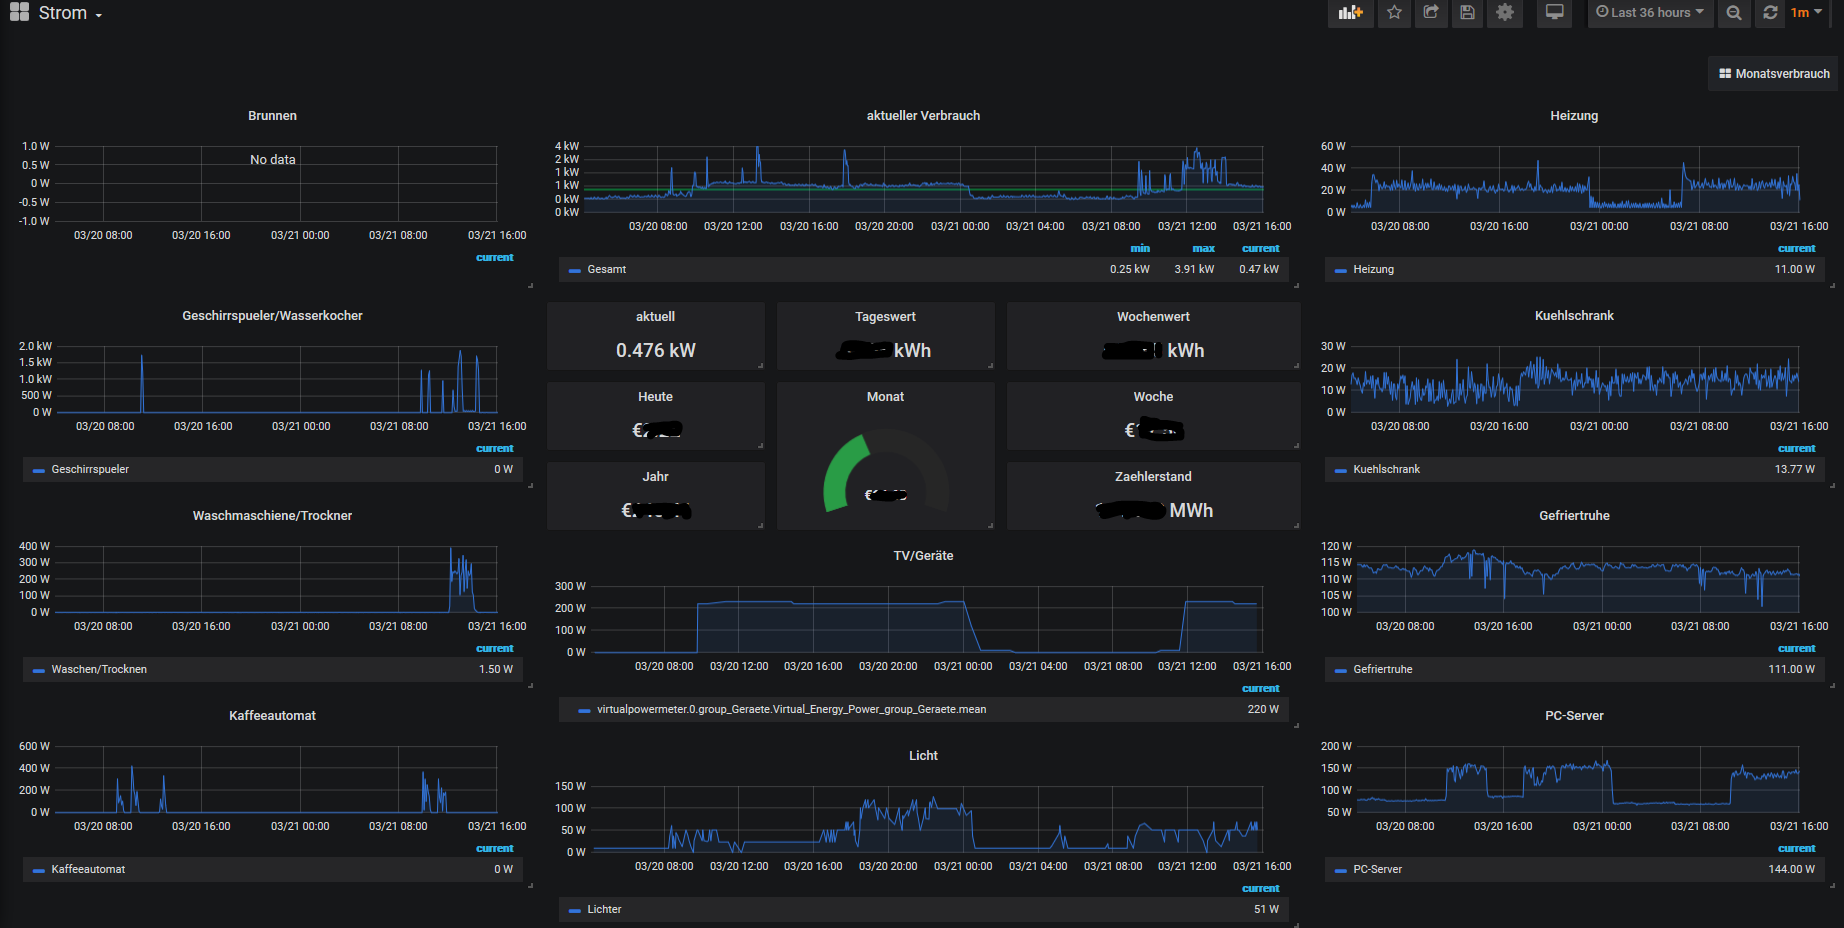
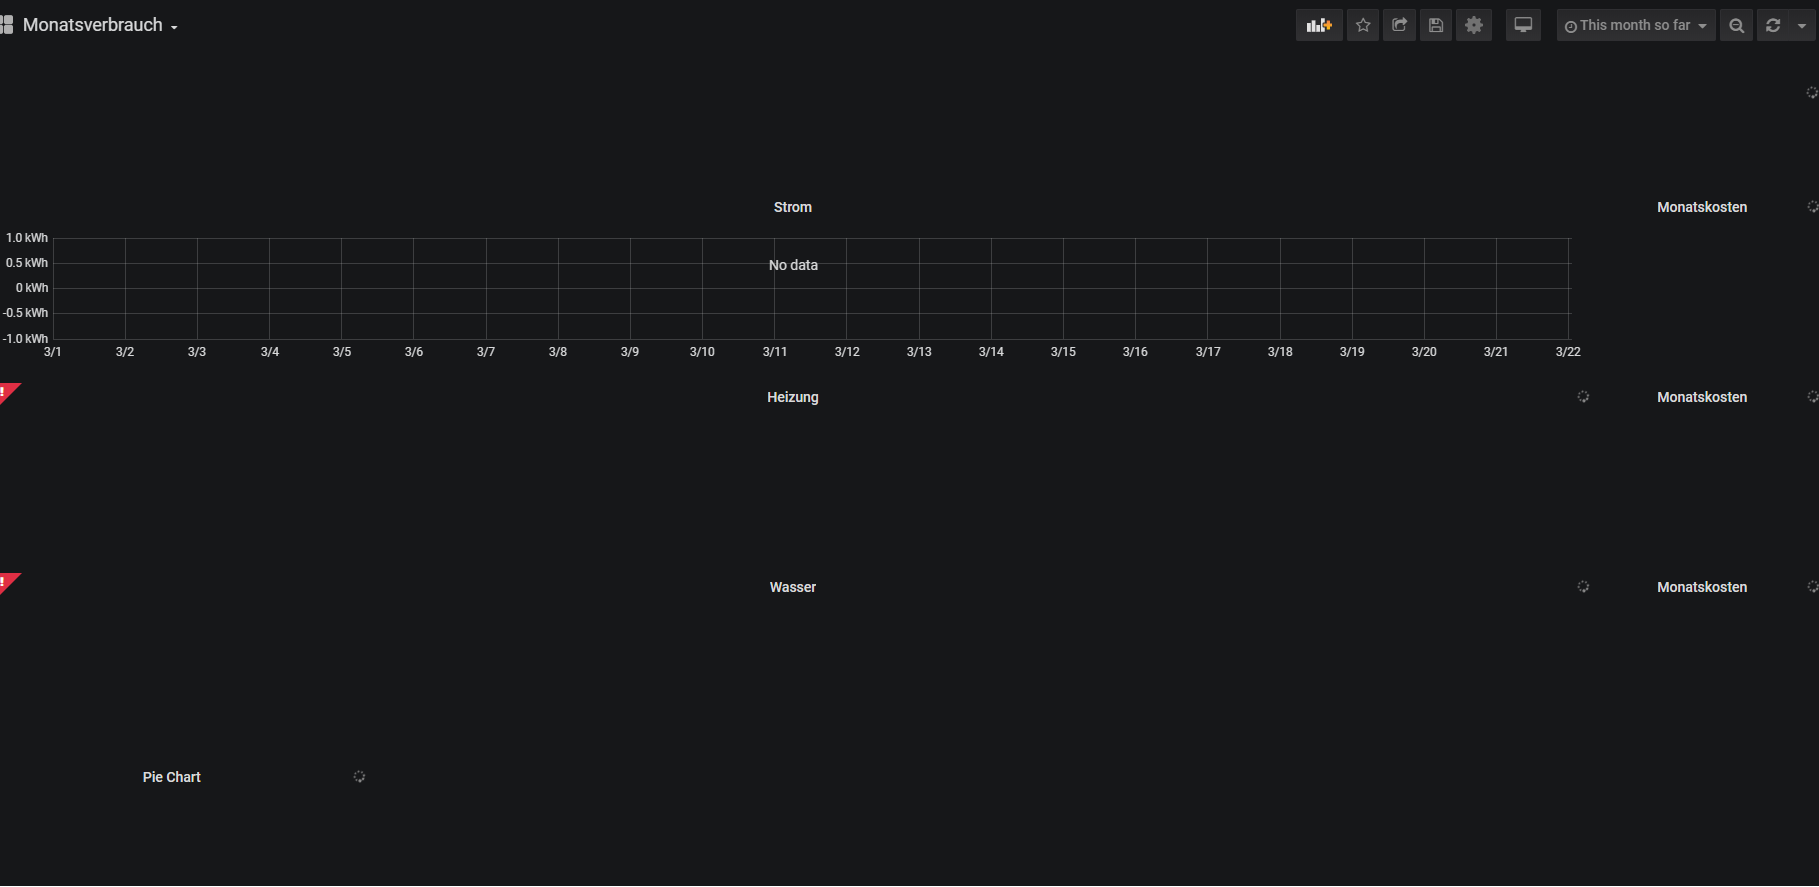
so schaut derzeit mein Dashboard aus
-
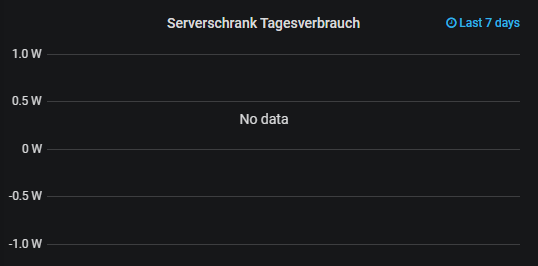
Kannst du nochmal schauen?
Diese DP werden jetzt befüllt.
Seit Mitternacht auch im positiven Bereich für Sonntag.
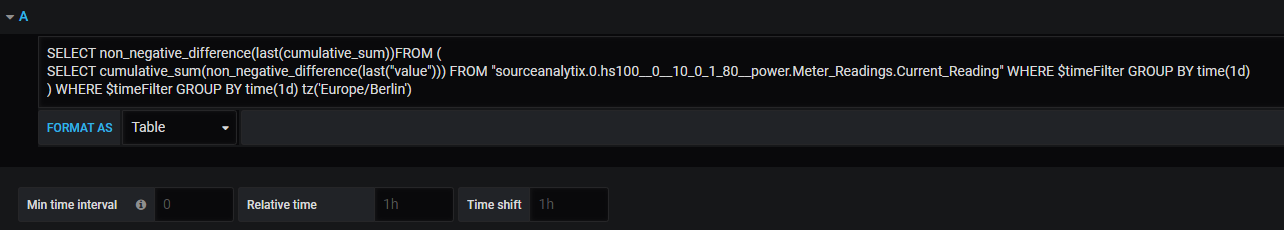
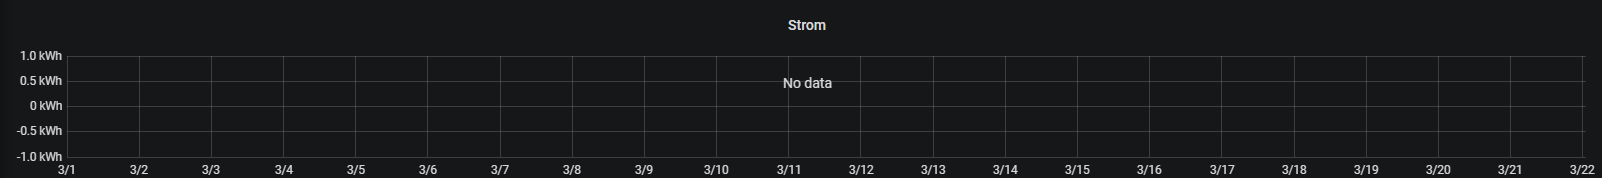
In Grafana hab ich es so eingetragen.
Trotzdem steht "no Data".
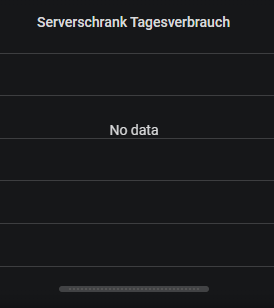
Trag ich als Query direkt den DP ein, kommt ein Balken.
Was mach ich da falsch?
Danke
° Node.js & System Update ---> sudo apt update, iob stop, sudo apt full-upgrade
° Node.js Fixer ---> iob nodejs-update
° Fixer ---> iob fix -
Kannst du nochmal schauen?
Diese DP werden jetzt befüllt.
Seit Mitternacht auch im positiven Bereich für Sonntag.
In Grafana hab ich es so eingetragen.
Trotzdem steht "no Data".
Trag ich als Query direkt den DP ein, kommt ein Balken.
Was mach ich da falsch?
Danke
@Negalein bist du sicher das die Bezeichnung richtig geschrieben ist? kommt mir irgendwie etwas komisch vor mit dem...hs100__0__10....(die doppelten unterstriche)
umgestiegen von Proxmox auf Unraid
-
@Negalein bist du sicher das die Bezeichnung richtig geschrieben ist? kommt mir irgendwie etwas komisch vor mit dem...hs100__0__10....(die doppelten unterstriche)
@crunchip sagte in Grafana Tagesverbrauch:
bist du sicher das die Bezeichnung richtig geschrieben ist? kommt mir irgendwie etwas komisch vor mit dem...hs100__0__10....(die doppelten unterstriche)
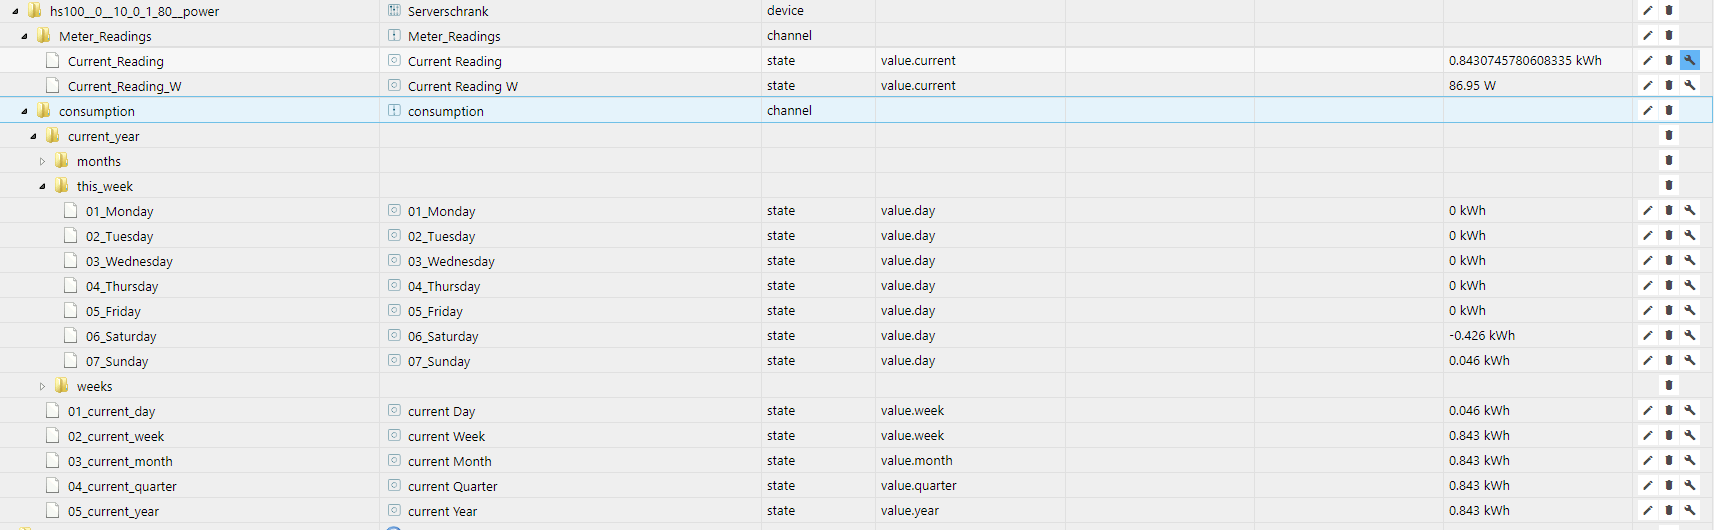
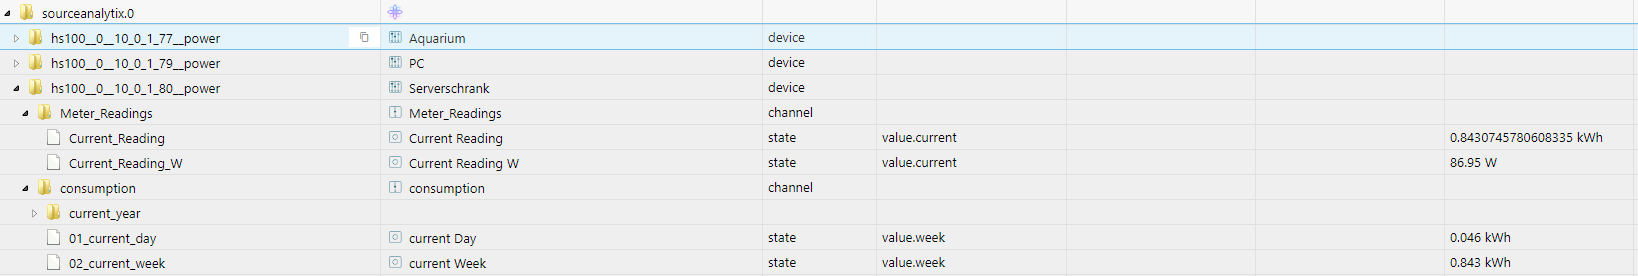
Ja, gerade nochmal geschaut.
So siehts in Source aus:
Und so die DP:
zB dersourceanalytix.0.hs100__0__10_0_1_80__power.Meter_Readings.Current_Reading
° Node.js & System Update ---> sudo apt update, iob stop, sudo apt full-upgrade
° Node.js Fixer ---> iob nodejs-update
° Fixer ---> iob fix -
@crunchip sagte in Grafana Tagesverbrauch:
bist du sicher das die Bezeichnung richtig geschrieben ist? kommt mir irgendwie etwas komisch vor mit dem...hs100__0__10....(die doppelten unterstriche)
Ja, gerade nochmal geschaut.
So siehts in Source aus:
Und so die DP:
zB dersourceanalytix.0.hs100__0__10_0_1_80__power.Meter_Readings.Current_Reading
@Negalein mach mal ein neues dasboard füge die json ein...und natürlich deinen Datenpunkt anpassen
umgestiegen von Proxmox auf Unraid
-
@Negalein mach mal ein neues dasboard füge die json ein...und natürlich deinen Datenpunkt anpassen
@crunchip sagte in Grafana Tagesverbrauch:
mach mal ein neues dasboard füge die json ein...und natürlich deinen Datenpunkt anpassen
kommt auch "no Data"
° Node.js & System Update ---> sudo apt update, iob stop, sudo apt full-upgrade
° Node.js Fixer ---> iob nodejs-update
° Fixer ---> iob fix -
@crunchip sagte in Grafana Tagesverbrauch:
mach mal ein neues dasboard füge die json ein...und natürlich deinen Datenpunkt anpassen
kommt auch "no Data"
@Negalein auch die richtige Datenbank ausgewählt? oder hast du nur eine
umgestiegen von Proxmox auf Unraid
-
@crunchip sagte in Grafana Tagesverbrauch:
auch die richtige Datenbank ausgewählt? oder hast du nur eine
Ja, hab nur eine
-
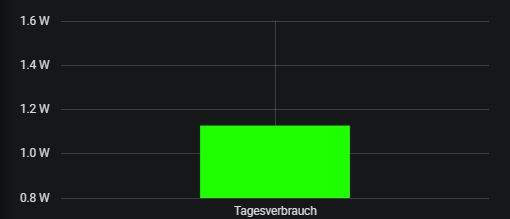
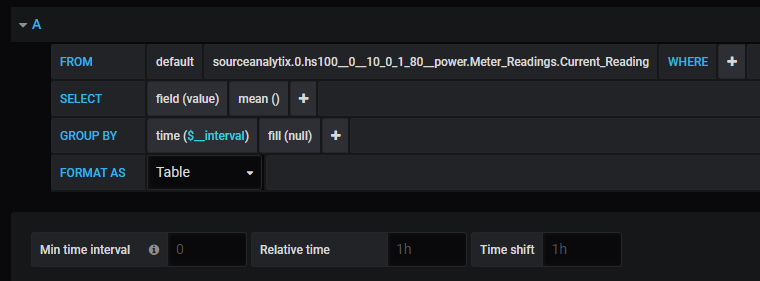
wähle ich "nur" den DP als Query aus, kommen Daten.
Verwende ich aber
SELECT non_negative_difference(last(cumulative_sum))FROM ( SELECT cumulative_sum(non_negative_difference(last("value"))) FROM "sourceanalytix.0.hs100__0__10_0_1_80__power.Meter_Readings.Current_Reading" WHERE $timeFilter GROUP BY time(1d) ) WHERE $timeFilter GROUP BY time(1d) tz('Europe/Berlin')
kommt "no Data".° Node.js & System Update ---> sudo apt update, iob stop, sudo apt full-upgrade
° Node.js Fixer ---> iob nodejs-update
° Fixer ---> iob fix -
wähle ich "nur" den DP als Query aus, kommen Daten.
Verwende ich aber
SELECT non_negative_difference(last(cumulative_sum))FROM ( SELECT cumulative_sum(non_negative_difference(last("value"))) FROM "sourceanalytix.0.hs100__0__10_0_1_80__power.Meter_Readings.Current_Reading" WHERE $timeFilter GROUP BY time(1d) ) WHERE $timeFilter GROUP BY time(1d) tz('Europe/Berlin')
kommt "no Data".@Negalein klick mal rechts auf Query Inspector >>Expand All
vllt kann man da etwas erkennen

umgestiegen von Proxmox auf Unraid
-
@Negalein klick mal rechts auf Query Inspector >>Expand All
vllt kann man da etwas erkennen
@crunchip sagte in Grafana Tagesverbrauch:
klick mal rechts auf Query Inspector >>Expand All
Object
xhrStatus:"complete"
request:Object
method:"GET"
url:"api/datasources/proxy/1/query"
params:Object
db:"iobroker"
q:"SELECT non_negative_difference(last(cumulative_sum))FROM ( SELECT cumulative_sum(non_negative_difference(last("value"))) FROM "sourceanalytix.0.hs100__0__10_0_1_80__power.Meter_Readings.Current_Reading" WHERE time >= 1583017200000ms GROUP BY time(1d) ) WHERE time >= 1583017200000ms GROUP BY time(1d) tz('Europe/Berlin')"
epoch:"ms"
data:null
precision:"ms"
response:Object
results:Array[1]
0:Object
statement_id:0
° Node.js & System Update ---> sudo apt update, iob stop, sudo apt full-upgrade
° Node.js Fixer ---> iob nodejs-update
° Fixer ---> iob fix -
@crunchip sagte in Grafana Tagesverbrauch:
klick mal rechts auf Query Inspector >>Expand All
Object xhrStatus:"complete" request:Object method:"GET" url:"api/datasources/proxy/1/query" params:Object db:"iobroker" q:"SELECT non_negative_difference(last(cumulative_sum))FROM ( SELECT cumulative_sum(non_negative_difference(last("value"))) FROM "sourceanalytix.0.hs100__0__10_0_1_80__power.Meter_Readings.Current_Reading" WHERE time >= 1583017200000ms GROUP BY time(1d) ) WHERE time >= 1583017200000ms GROUP BY time(1d) tz('Europe/Berlin')" epoch:"ms" data:null precision:"ms" response:Object results:Array[1] 0:Object statement_id:0 -
-
@crunchip sagte in Grafana Tagesverbrauch:
mehr kommt da nicht?
verwende ich nur den DP im Query kommt viel mehr.
new 11.txt -
@Negalein ich würde mal sagen du musst noch nen Tag warten :woman-facepalming:
was soll denn auch berechnet werden, wenn erst ein 1 Wert vorhanden ist...wenn ma es logisch betrachtetdieser Part kann ja erst am folgeTag errechnet werden GROUP BY time(1d)
SELECT non_negative_difference(last(cumulative_sum))FROM (
SELECT cumulative_sum(non_negative_difference(last("value")))
umgestiegen von Proxmox auf Unraid
Support us
703
Online32.6k
Users82.3k
Topics1.3m
Posts