

Grafana iFrame in VIS
-
@saeft_2003
so sieht er bei mir aus<iframe src="http://192.168.1.11:3000/d-solo/kpol2807k/test-copy?orgId=1&from=1641409054004&to=1641495454006&panelId=2" width="450" height="200" frameborder="0"></iframe>Füg mal nur das ein in das iframe:
http://192.168.1.11:3000/d-solo/kpol2807k/test-copy?orgId=1&from=1641409054004&to=1641495454006&panelId=2" width="450" height="200" frameborder="0" -
Füg mal nur das ein in das iframe:
http://192.168.1.11:3000/d-solo/kpol2807k/test-copy?orgId=1&from=1641409054004&to=1641495454006&panelId=2" width="450" height="200" frameborder="0" -
Zeig mal bitte die ganze Datei grafana.ini am besten als txt hier hochladen.
-
@saeft_2003 ```
Das hier habe ich verändert[security] allow_embedding = true [auth.anonymous] enabled = true org_name = Main Org. org_role = Viewer [users] allow_sign_up = false -
Zeig mal bitte die ganze Datei grafana.ini am besten als txt hier hochladen.
##################### Grafana Configuration Example #####################
#
# Everything has defaults so you only need to uncomment things you want to
# change

# possible values : production, development
;app_mode = production

# instance name, defaults to HOSTNAME environment variable value or hostname if HOSTNAME var is empty
;instance_name = ${HOSTNAME}

#################################### Paths ####################################
[paths]
# Path to where grafana can store temp files, sessions, and the sqlite3 db (if that is used)
;data = /var/lib/grafana

# Temporary files in `data` directory older than given duration will be removed
;temp_data_lifetime = 24h

# Directory where grafana can store logs
;logs = /var/log/grafana

# Directory where grafana will automatically scan and look for plugins
;plugins = /var/lib/grafana/plugins

# folder that contains provisioning config files that grafana will apply on startup and while running.
;provisioning = conf/provisioning

#################################### Server ####################################
[server]
# Protocol (http, https, h2, socket)
;protocol = http

# The ip address to bind to, empty will bind to all interfaces
;http_addr =

# The http port  to use
;http_port = 3000

# The public facing domain name used to access grafana from a browser
;domain = localhost

# Redirect to correct domain if host header does not match domain
# Prevents DNS rebinding attacks
;enforce_domain = false

# The full public facing url you use in browser, used for redirects and emails
# If you use reverse proxy and sub path specify full url (with sub path)
;root_url = %(protocol)s://%(domain)s:%(http_port)s/

# Serve Grafana from subpath specified in `root_url` setting. By default it is set to `false` for compatibility reasons.
;serve_from_sub_path = false

# Log web requests
;router_logging = false

# the path relative working path
;static_root_path = public

# enable gzip
;enable_gzip = false

# https certs & key file
;cert_file =
;cert_key =

# Unix socket path
;socket =

# CDN Url
;cdn_url =

# Sets the maximum time using a duration format (5s/5m/5ms) before timing out read of an incoming request and closing idle connections.
# `0` means there is no timeout for reading the request.
;read_timeout = 0

#################################### Database ####################################
[database]
# You can configure the database connection by specifying type, host, name, user and password
# as separate properties or as on string using the url properties.

# Either "mysql", "postgres" or "sqlite3", it's your choice
;type = sqlite3
;host = 127.0.0.1:3306
;name = grafana
;user = root
# If the password contains # or ; you have to wrap it with triple quotes. Ex """#password;"""
;password =

# Use either URL or the previous fields to configure the database
# Example: mysql://user:secret@host:port/database
;url =

# For "postgres" only, either "disable", "require" or "verify-full"
;ssl_mode = disable
# Database drivers may support different transaction isolation levels.
# Currently, only "mysql" driver supports isolation levels.
# If the value is empty - driver's default isolation level is applied.
# For "mysql" use "READ-UNCOMMITTED", "READ-COMMITTED", "REPEATABLE-READ" or "SERIALIZABLE".
;isolation_level =

;ca_cert_path =
;client_key_path =
;client_cert_path =
;server_cert_name =

# For "sqlite3" only, path relative to data_path setting
;path = grafana.db

# Max idle conn setting default is 2
;max_idle_conn = 2

# Max conn setting default is 0 (mean not set)
;max_open_conn =

# Connection Max Lifetime default is 14400 (means 14400 seconds or 4 hours)
;conn_max_lifetime = 14400

# Set to true to log the sql calls and execution times.
;log_queries =

# For "sqlite3" only. cache mode setting used for connecting to the database. (private, shared)
;cache_mode = private

################################### Data sources #########################
[datasources]
# Upper limit of data sources that Grafana will return. This limit is a temporary configuration and it will be deprecated when pagination will be introduced on the list data sources API.
;datasource_limit = 5000

#################################### Cache server #############################
[remote_cache]
# Either "redis", "memcached" or "database" default is "database"
;type = database

# cache connectionstring options
# database: will use Grafana primary database.
# redis: config like redis server e.g. `addr=127.0.0.1:6379,pool_size=100,db=0,ssl=false`. Only addr is required. ssl may be 'true', 'false', or 'insecure'.
# memcache: 127.0.0.1:11211
;connstr =

#################################### Data proxy ###########################
[dataproxy]
# This enables data proxy logging, default is false
;logging = false

# How long the data proxy waits to read the headers of the response before timing out, default is 30 seconds.
# This setting also applies to core backend HTTP data sources where query requests use an HTTP client with timeout set.
;timeout = 30

# How long the data proxy waits to establish a TCP connection before timing out, default is 10 seconds.
;dialTimeout = 10

# How many seconds the data proxy waits before sending a keepalive probe request.
;keep_alive_seconds = 30

# How many seconds the data proxy waits for a successful TLS Handshake before timing out.
;tls_handshake_timeout_seconds = 10

# How many seconds the data proxy will wait for a server's first response headers after
# fully writing the request headers if the request has an "Expect: 100-continue"
# header. A value of 0 will result in the body being sent immediately, without
# waiting for the server to approve.
;expect_continue_timeout_seconds = 1

# Optionally limits the total number of connections per host, including connections in the dialing,
# active, and idle states. On limit violation, dials will block.
# A value of zero (0) means no limit.
;max_conns_per_host = 0

# The maximum number of idle connections that Grafana will keep alive.
;max_idle_connections = 100

# How many seconds the data proxy keeps an idle connection open before timing out.
;idle_conn_timeout_seconds = 90

# If enabled and user is not anonymous, data proxy will add X-Grafana-User header with username into the request, default is false.
;send_user_header = false

# Limit the amount of bytes that will be read/accepted from responses of outgoing HTTP requests.
;response_limit = 0

# Limits the number of rows that Grafana will process from SQL data sources.
;row_limit = 1000000

#################################### Analytics ####################################
[analytics]
# Server reporting, sends usage counters to stats.grafana.org every 24 hours.
# No ip addresses are being tracked, only simple counters to track
# running instances, dashboard and error counts. It is very helpful to us.
# Change this option to false to disable reporting.
;reporting_enabled = true

# The name of the distributor of the Grafana instance. Ex hosted-grafana, grafana-labs
;reporting_distributor = grafana-labs

# Set to false to disable all checks to https://grafana.net
# for new versions (grafana itself and plugins), check is used
# in some UI views to notify that grafana or plugin update exists
# This option does not cause any auto updates, nor send any information
# only a GET request to http://grafana.com to get latest versions
;check_for_updates = true

# Google Analytics universal tracking code, only enabled if you specify an id here
;google_analytics_ua_id =

# Google Tag Manager ID, only enabled if you specify an id here
;google_tag_manager_id =

#################################### Security ####################################
[security]
# disable creation of admin user on first start of grafana
;disable_initial_admin_creation = false

# default admin user, created on startup
;admin_user = admin

# default admin password, can be changed before first start of grafana,  or in profile settings
;admin_password = admin

# used for signing
;secret_key = SW2YcwTIb9zpOOhoPsMm

# current key provider used for envelope encryption, default to static value specified by secret_key
;encryption_provider = secretKey

# list of configured key providers, space separated (Enterprise only): e.g., awskms.v1 azurekv.v1
;available_encryption_providers =

# disable gravatar profile images
;disable_gravatar = false

# data source proxy whitelist (ip_or_domain:port separated by spaces)
;data_source_proxy_whitelist =

# disable protection against brute force login attempts
;disable_brute_force_login_protection = false
# set to true if you host Grafana behind HTTPS. default is false.
;cookie_secure = false

# set cookie SameSite attribute. defaults to `lax`. can be set to "lax", "strict", "none" and "disabled"
;cookie_samesite = lax

# set to true if you want to allow browsers to render Grafana in a <frame>, <iframe>, <embed> or <object>. default is false.
;allow_embedding = true

# Set to true if you want to enable http strict transport security (HSTS) response header.
# This is only sent when HTTPS is enabled in this configuration.
# HSTS tells browsers that the site should only be accessed using HTTPS.
;strict_transport_security = false

# Sets how long a browser should cache HSTS. Only applied if strict_transport_security is enabled.
;strict_transport_security_max_age_seconds = 86400

# Set to true if to enable HSTS preloading option. Only applied if strict_transport_security is enabled.
;strict_transport_security_preload = false

# Set to true if to enable the HSTS includeSubDomains option. Only applied if strict_transport_security is enabled.
;strict_transport_security_subdomains = false

# Set to true to enable the X-Content-Type-Options response header.
# The X-Content-Type-Options response HTTP header is a marker used by the server to indicate that the MIME types advertised
# in the Content-Type headers should not be changed and be followed.
;x_content_type_options = true

# Set to true to enable the X-XSS-Protection header, which tells browsers to stop pages from loading
# when they detect reflected cross-site scripting (XSS) attacks.
;x_xss_protection = true

# Enable adding the Content-Security-Policy header to your requests.
# CSP allows to control resources the user agent is allowed to load and helps prevent XSS attacks.
;content_security_policy = false

# Set Content Security Policy template used when adding the Content-Security-Policy header to your requests.
# $NONCE in the template includes a random nonce.
# $ROOT_PATH is server.root_url without the protocol.
;content_security_policy_template = """script-src 'self' 'unsafe-eval' 'unsafe-inline' 'strict-dynamic' $NONCE;object-src 'none';font-src 'self';style-src 'self' 'unsafe-inline' blob:;img-src * da>

#################################### Snapshots ###########################
[snapshots]
# snapshot sharing options
;external_enabled = true
;external_snapshot_url = https://snapshots-origin.raintank.io
;external_snapshot_name = Publish to snapshot.raintank.io
# Set to true to enable this Grafana instance act as an external snapshot server and allow unauthenticated requests for
# creating and deleting snapshots.
;public_mode = false

# remove expired snapshot
;snapshot_remove_expired = true

#################################### Dashboards History ##################
[dashboards]
# Number dashboard versions to keep (per dashboard). Default: 20, Minimum: 1
;versions_to_keep = 20

# Minimum dashboard refresh interval. When set, this will restrict users to set the refresh interval of a dashboard lower than given interval. Per default this is 5 seconds.
# The interval string is a possibly signed sequence of decimal numbers, followed by a unit suffix (ms, s, m, h, d), e.g. 30s or 1m.
;min_refresh_interval = 5s

# Path to the default home dashboard. If this value is empty, then Grafana uses StaticRootPath + "dashboards/home.json"
;default_home_dashboard_path =

#################################### Users ###############################
[users]
# disable user signup / registration
allow_sign_up = false

# Allow non admin users to create organizations
;allow_org_create = true

# Set to true to automatically assign new users to the default organization (id 1)
;auto_assign_org = true

# Set this value to automatically add new users to the provided organization (if auto_assign_org above is set to true)
;auto_assign_org_id = 1

# Default role new users will be automatically assigned (if disabled above is set to true)
;auto_assign_org_role = Viewer

# Require email validation before sign up completes
;verify_email_enabled = false

# Background text for the user field on the login page
;login_hint = email or username
;password_hint = password

# Default UI theme ("dark" or "light")
;default_theme = dark

# Path to a custom home page. Users are only redirected to this if the default home dashboard is used. It should match a frontend route and contain a leading slash.
; home_page =

# External user management, these options affect the organization users view
;external_manage_link_url =
;external_manage_link_name =
;external_manage_info =

# Viewers can edit/inspect dashboard settings in the browser. But not save the dashboard.
;viewers_can_edit = false

# Editors can administrate dashboard, folders and teams they create
;editors_can_admin = false

# The duration in time a user invitation remains valid before expiring. This setting should be expressed as a duration. Examples: 6h (hours), 2d (days), 1w (week). Default is 24h (24 hours). The m>
;user_invite_max_lifetime_duration = 24h

# Enter a comma-separated list of users login to hide them in the Grafana UI. These users are shown to Grafana admins and themselves.
; hidden_users =

[auth]
# Login cookie name
;login_cookie_name = grafana_session

# The maximum lifetime (duration) an authenticated user can be inactive before being required to login at next visit. Default is 7 days (7d). This setting should be expressed as a duration, e.g. 5>
;login_maximum_inactive_lifetime_duration =

# The maximum lifetime (duration) an authenticated user can be logged in since login time before being required to login. Default is 30 days (30d). This setting should be expressed as a duration, >
;login_maximum_lifetime_duration =

# How often should auth tokens be rotated for authenticated users when being active. The default is each 10 minutes.
;token_rotation_interval_minutes = 10

# Set to true to disable (hide) the login form, useful if you use OAuth, defaults to false
;disable_login_form = false

# Set to true to disable the sign out link in the side menu. Useful if you use auth.proxy or auth.jwt, defaults to false
;disable_signout_menu = false

# URL to redirect the user to after sign out
;signout_redirect_url =

# Set to true to attempt login with OAuth automatically, skipping the login screen.
# This setting is ignored if multiple OAuth providers are configured.
;oauth_auto_login = false

# OAuth state max age cookie duration in seconds. Defaults to 600 seconds.

# limit of api_key seconds to live before expiration
;api_key_max_seconds_to_live = -1

# Set to true to enable SigV4 authentication option for HTTP-based datasources.
;sigv4_auth_enabled = false

#################################### Anonymous Auth ######################
[auth.anonymous]
# enable anonymous access
enabled = true

# specify organization name that should be used for unauthenticated users
org_name = Main Org.

# specify role for unauthenticated users
org_role = Viewer

# mask the Grafana version number for unauthenticated users
;hide_version = false

#################################### GitHub Auth ##########################
[auth.github]
;enabled = false
;allow_sign_up = true
;client_id = some_id
;client_secret = some_secret
;scopes = user:email,read:org
;auth_url = https://github.com/login/oauth/authorize
;token_url = https://github.com/login/oauth/access_token
;api_url = https://api.github.com/user
;allowed_domains =
;team_ids =
;allowed_organizations =

#################################### GitLab Auth #########################
[auth.gitlab]
;enabled = false
;allow_sign_up = true
;client_id = some_id
;client_secret = some_secret
;scopes = api
;auth_url = https://gitlab.com/oauth/authorize
;token_url = https://gitlab.com/oauth/token
;api_url = https://gitlab.com/api/v4
;allowed_domains =
;allowed_groups =
#################################### Google Auth ##########################
[auth.google]
;enabled = false
;allow_sign_up = true
;client_id = some_client_id
;client_secret = some_client_secret
;scopes = https://www.googleapis.com/auth/userinfo.profile https://www.googleapis.com/auth/userinfo.email
;auth_url = https://accounts.google.com/o/oauth2/auth
;token_url = https://accounts.google.com/o/oauth2/token
;api_url = https://www.googleapis.com/oauth2/v1/userinfo
;allowed_domains =
;hosted_domain =

#################################### Grafana.com Auth ####################
[auth.grafana_com]
;enabled = false
;allow_sign_up = true
;client_id = some_id
;client_secret = some_secret
;scopes = user:email
;allowed_organizations =

#################################### Azure AD OAuth #######################
[auth.azuread]
;name = Azure AD
;enabled = false
;allow_sign_up = true
;client_id = some_client_id
;client_secret = some_client_secret
;scopes = openid email profile
;auth_url = https://login.microsoftonline.com/<tenant-id>/oauth2/v2.0/authorize
;token_url = https://login.microsoftonline.com/<tenant-id>/oauth2/v2.0/token
;allowed_domains =
;allowed_groups =

#################################### Okta OAuth #######################
[auth.okta]
;name = Okta
;enabled = false
;allow_sign_up = true
;client_id = some_id
;client_secret = some_secret
;scopes = openid profile email groups
;auth_url = https://<tenant-id>.okta.com/oauth2/v1/authorize
;token_url = https://<tenant-id>.okta.com/oauth2/v1/token
;api_url = https://<tenant-id>.okta.com/oauth2/v1/userinfo
;allowed_domains =
;allowed_groups =
;role_attribute_path =
;role_attribute_strict = false

#################################### Generic OAuth ##########################
[auth.generic_oauth]
;enabled = false
;name = OAuth
;allow_sign_up = true
;client_id = some_id
;client_secret = some_secret
;scopes = user:email,read:org
;empty_scopes = false
;email_attribute_name = email:primary
;email_attribute_path =
;login_attribute_path =
;name_attribute_path =
;id_token_attribute_name =
;auth_url = https://foo.bar/login/oauth/authorize
;token_url = https://foo.bar/login/oauth/access_token
;api_url = https://foo.bar/user
;teams_url =
;allowed_domains =
;team_ids =
;allowed_organizations =
;role_attribute_path =
;role_attribute_strict = false
;groups_attribute_path =
;team_ids_attribute_path =
;tls_skip_verify_insecure = false
;tls_client_cert =
;tls_client_key =
;tls_client_ca =
;use_pkce = false

#################################### Basic Auth ##########################
[auth.basic]
;enabled = true

#################################### Auth Proxy ##########################
[auth.proxy]
;enabled = false
;header_name = X-WEBAUTH-USER
;header_property = username
;auto_sign_up = true
;sync_ttl = 60
;whitelist = 192.168.1.1, 192.168.2.1
;headers = Email:X-User-Email, Name:X-User-Name
# Read the auth proxy docs for details on what the setting below enables
;enable_login_token = false

#################################### Auth JWT ##########################
[auth.jwt]
;enabled = true
;header_name = X-JWT-Assertion
;email_claim = sub
;username_claim = sub
;jwk_set_url = https://foo.bar/.well-known/jwks.json
;jwk_set_file = /path/to/jwks.json
;cache_ttl = 60m
;expected_claims = {"aud": ["foo", "bar"]}
;key_file = /path/to/key/file

#################################### Auth LDAP ##########################
[auth.ldap]
;enabled = false
;config_file = /etc/grafana/ldap.toml
;allow_sign_up = true

# LDAP background sync (Enterprise only)
# At 1 am every day
;sync_cron = "0 0 1 * * *"
;active_sync_enabled = true

#################################### AWS ###########################
[aws]
# Enter a comma-separated list of allowed AWS authentication providers.
# Options are: default (AWS SDK Default), keys (Access && secret key), credentials (Credentials field), ec2_iam_role (EC2 IAM Role)
; allowed_auth_providers = default,keys,credentials

# Allow AWS users to assume a role using temporary security credentials.
# If true, assume role will be enabled for all AWS authentication providers that are specified in aws_auth_providers
; assume_role_enabled = true

#################################### Azure ###############################
[azure]
# Azure cloud environment where Grafana is hosted
# Possible values are AzureCloud, AzureChinaCloud, AzureUSGovernment and AzureGermanCloud
# Default value is AzureCloud (i.e. public cloud)
;cloud = AzureCloud
# Specifies whether Grafana hosted in Azure service with Managed Identity configured (e.g. Azure Virtual Machines instance)
# If enabled, the managed identity can be used for authentication of Grafana in Azure services
# Disabled by default, needs to be explicitly enabled
;managed_identity_enabled = false

# Client ID to use for user-assigned managed identity
# Should be set for user-assigned identity and should be empty for system-assigned identity
;managed_identity_client_id =

#################################### SMTP / Emailing ##########################
[smtp]
;enabled = false
;host = localhost:25
;user =
# If the password contains # or ; you have to wrap it with triple quotes. Ex """#password;"""
;password =
;cert_file =
;key_file =
;skip_verify = false
;from_address = admin@grafana.localhost
;from_name = Grafana
# EHLO identity in SMTP dialog (defaults to instance_name)
;ehlo_identity = dashboard.example.com
# SMTP startTLS policy (defaults to 'OpportunisticStartTLS')
;startTLS_policy = NoStartTLS

[emails]
;welcome_email_on_sign_up = false
;templates_pattern = emails/*.html, emails/*.txt
;content_types = text/html

#################################### Logging ##########################
[log]
# Either "console", "file", "syslog". Default is console and  file
# Use space to separate multiple modes, e.g. "console file"
;mode = console file

# Either "debug", "info", "warn", "error", "critical", default is "info"
;level = info

# optional settings to set different levels for specific loggers. Ex filters = sqlstore:debug
;filters =

# For "console" mode only
[log.console]
;level =
# log line format, valid options are text, console and json
;format = console

# For "file" mode only
[log.file]
;level =

# log line format, valid options are text, console and json
;format = text

# This enables automated log rotate(switch of following options), default is true
;log_rotate = true

# Max line number of single file, default is 1000000
;max_lines = 1000000

# Max size shift of single file, default is 28 means 1 << 28, 256MB
;max_size_shift = 28

# Segment log daily, default is true
;daily_rotate = true

# Expired days of log file(delete after max days), default is 7
;max_days = 7

[log.syslog]
;level =

# log line format, valid options are text, console and json
;format = text

# Syslog network type and address. This can be udp, tcp, or unix. If left blank, the default unix endpoints will be used.
;network =
;address =

# Syslog facility. user, daemon and local0 through local7 are valid.
;facility =

# Syslog tag. By default, the process' argv[0] is used.
;tag =

[log.frontend]
# Should Sentry javascript agent be initialized
;enabled = false

# Sentry DSN if you want to send events to Sentry.
;sentry_dsn =
# Sentry DSN if you want to send events to Sentry.
;sentry_dsn =

# Custom HTTP endpoint to send events captured by the Sentry agent to. Default will log the events to stdout.
;custom_endpoint = /log

# Rate of events to be reported between 0 (none) and 1 (all), float
;sample_rate = 1.0

# Requests per second limit enforced an extended period, for Grafana backend log ingestion endpoint (/log).
;log_endpoint_requests_per_second_limit = 3

# Max requests accepted per short interval of time for Grafana backend log ingestion endpoint (/log).
;log_endpoint_burst_limit = 15

#################################### Usage Quotas ########################
[quota]
; enabled = false

#### set quotas to -1 to make unlimited. ####
# limit number of users per Org.
; org_user = 10

# limit number of dashboards per Org.
; org_dashboard = 100

# limit number of data_sources per Org.
; org_data_source = 10

# limit number of api_keys per Org.
; org_api_key = 10

# limit number of alerts per Org.
;org_alert_rule = 100

# limit number of orgs a user can create.
; user_org = 10

# Global limit of users.
; global_user = -1

# global limit of orgs.
; global_org = -1

# global limit of dashboards
; global_dashboard = -1
# global limit of api_keys
; global_api_key = -1

# global limit on number of logged in users.
; global_session = -1

# global limit of alerts
;global_alert_rule = -1

#################################### Unified Alerting ####################
[unified_alerting]
#Enable the Unified Alerting sub-system and interface. When enabled we'll migrate all of your alert rules and notification channels to the new system. New alert rules will be created and your noti>
;enabled = true

# Comma-separated list of organization IDs for which to disable unified alerting. Only supported if unified alerting is enabled.
;disabled_orgs =

# Specify the frequency of polling for admin config changes.
# The interval string is a possibly signed sequence of decimal numbers, followed by a unit suffix (ms, s, m, h, d), e.g. 30s or 1m.
;admin_config_poll_interval = 60s

# Specify the frequency of polling for Alertmanager config changes.
# The interval string is a possibly signed sequence of decimal numbers, followed by a unit suffix (ms, s, m, h, d), e.g. 30s or 1m.
;alertmanager_config_poll_interval = 60s

# Listen address/hostname and port to receive unified alerting messages for other Grafana instances. The port is used for both TCP and UDP. It is assumed other Grafana instances are also running o>
;ha_listen_address = "0.0.0.0:9094"

# Listen address/hostname and port to receive unified alerting messages for other Grafana instances. The port is used for both TCP and UDP. It is assumed other Grafana instances are also running o>
;ha_advertise_address = ""

# Comma-separated list of initial instances (in a format of host:port) that will form the HA cluster. Configuring this setting will enable High Availability mode for alerting.
;ha_peers = ""

# Time to wait for an instance to send a notification via the Alertmanager. In HA, each Grafana instance will
# be assigned a position (e.g. 0, 1). We then multiply this position with the timeout to indicate how long should
# each instance wait before sending the notification to take into account replication lag.
# The interval string is a possibly signed sequence of decimal numbers, followed by a unit suffix (ms, s, m, h, d), e.g. 30s or 1m.
;ha_peer_timeout = "15s"

# The interval between sending gossip messages. By lowering this value (more frequent) gossip messages are propagated
# across cluster more quickly at the expense of increased bandwidth usage.
# The interval string is a possibly signed sequence of decimal numbers, followed by a unit suffix (ms, s, m, h, d), e.g. 30s or 1m.
;ha_gossip_interval = "200ms"

# The interval between gossip full state syncs. Setting this interval lower (more frequent) will increase convergence speeds
# across larger clusters at the expense of increased bandwidth usage.
# The interval string is a possibly signed sequence of decimal numbers, followed by a unit suffix (ms, s, m, h, d), e.g. 30s or 1m.;ha_push_pull_interval = "60s"

# Enable or disable alerting rule execution. The alerting UI remains visible. This option has a legacy version in the `[alerting]` section that takes precedence.
;execute_alerts = true

# Alert evaluation timeout when fetching data from the datasource. This option has a legacy version in the `[alerting]` section that takes precedence.
# The timeout string is a possibly signed sequence of decimal numbers, followed by a unit suffix (ms, s, m, h, d), e.g. 30s or 1m.
;evaluation_timeout = 30s

# Number of times we'll attempt to evaluate an alert rule before giving up on that evaluation. This option has a legacy version in the `[alerting]` section that takes precedence.
;max_attempts = 3

# Minimum interval to enforce between rule evaluations. Rules will be adjusted if they are less than this value  or if they are not multiple of the scheduler interval (10s). Higher values can help>
# The interval string is a possibly signed sequence of decimal numbers, followed by a unit suffix (ms, s, m, h, d), e.g. 30s or 1m.
;min_interval = 10s

#################################### Alerting ############################
[alerting]
# Disable legacy alerting engine & UI features
;enabled = false

# Makes it possible to turn off alert execution but alerting UI is visible
;execute_alerts = true

# Default setting for new alert rules. Defaults to categorize error and timeouts as alerting. (alerting, keep_state)
;error_or_timeout = alerting

# Default setting for how Grafana handles nodata or null values in alerting. (alerting, no_data, keep_state, ok)
;nodata_or_nullvalues = no_data

# Alert notifications can include images, but rendering many images at the same time can overload the server
# This limit will protect the server from render overloading and make sure notifications are sent out quickly
;concurrent_render_limit = 5

# Default setting for alert calculation timeout. Default value is 30
;evaluation_timeout_seconds = 30

# Default setting for alert notification timeout. Default value is 30
;notification_timeout_seconds = 30

# Default setting for max attempts to sending alert notifications. Default value is 3
;max_attempts = 3

# Makes it possible to enforce a minimal interval between evaluations, to reduce load on the backend
;min_interval_seconds = 1
# Configures for how long alert annotations are stored. Default is 0, which keeps them forever.
# This setting should be expressed as a duration. Examples: 6h (hours), 10d (days), 2w (weeks), 1M (month).
;max_annotation_age =

# Configures max number of alert annotations that Grafana stores. Default value is 0, which keeps all alert annotations.
;max_annotations_to_keep =

#################################### Annotations #########################
[annotations]
# Configures the batch size for the annotation clean-up job. This setting is used for dashboard, API, and alert annotations.
;cleanupjob_batchsize = 100

[annotations.dashboard]
# Dashboard annotations means that annotations are associated with the dashboard they are created on.

# Configures how long dashboard annotations are stored. Default is 0, which keeps them forever.
# This setting should be expressed as a duration. Examples: 6h (hours), 10d (days), 2w (weeks), 1M (month).
;max_age =

# Configures max number of dashboard annotations that Grafana stores. Default value is 0, which keeps all dashboard annotations.
;max_annotations_to_keep =

[annotations.api]
# API annotations means that the annotations have been created using the API without any
# association with a dashboard.

# Configures how long Grafana stores API annotations. Default is 0, which keeps them forever.
# This setting should be expressed as a duration. Examples: 6h (hours), 10d (days), 2w (weeks), 1M (month).
;max_age =

# Configures max number of API annotations that Grafana keeps. Default value is 0, which keeps all API annotations.
;max_annotations_to_keep =

#################################### Explore #############################
[explore]
# Enable the Explore section
;enabled = true

#################################### Internal Grafana Metrics ##########################
# Metrics available at HTTP API Url /metrics
[metrics]
# Disable / Enable internal metrics
;enabled           = true
# Graphite Publish interval
;interval_seconds  = 10
# Disable total stats (stat_totals_*) metrics to be generated
;disable_total_stats = false
#If both are set, basic auth will be required for the metrics endpoint.
; basic_auth_username =
; basic_auth_password =

# Metrics environment info adds dimensions to the `grafana_environment_info` metric, which
# can expose more information about the Grafana instance.
[metrics.environment_info]
#exampleLabel1 = exampleValue1
#exampleLabel2 = exampleValue2

# Send internal metrics to Graphite
[metrics.graphite]
# Enable by setting the address setting (ex localhost:2003)
;address =
;prefix = prod.grafana.%(instance_name)s.

#################################### Grafana.com integration  ##########################
# Url used to import dashboards directly from Grafana.com
[grafana_com]
;url = https://grafana.com

#################################### Distributed tracing ############
[tracing.jaeger]
# Enable by setting the address sending traces to jaeger (ex localhost:6831)
;address = localhost:6831
# Tag that will always be included in when creating new spans. ex (tag1:value1,tag2:value2)
;always_included_tag = tag1:value1
# Type specifies the type of the sampler: const, probabilistic, rateLimiting, or remote
;sampler_type = const
# jaeger samplerconfig param
# for "const" sampler, 0 or 1 for always false/true respectively
# for "probabilistic" sampler, a probability between 0 and 1
# for "rateLimiting" sampler, the number of spans per second
# for "remote" sampler, param is the same as for "probabilistic"
# and indicates the initial sampling rate before the actual one
# is received from the mothership
;sampler_param = 1
# sampling_server_url is the URL of a sampling manager providing a sampling strategy.
;sampling_server_url =
# Whether or not to use Zipkin propagation (x-b3- HTTP headers).
;zipkin_propagation = false
# Setting this to true disables shared RPC spans.
# Not disabling is the most common setting when using Zipkin elsewhere in your infrastructure.
;disable_shared_zipkin_spans = false

#################################### External image storage ##########################
[external_image_storage]
# Used for uploading images to public servers so they can be included in slack/email messages.
# you can choose between (s3, webdav, gcs, azure_blob, local)
;provider =

[external_image_storage.s3]
;endpoint =
;path_style_access =
;bucket =
;region =
;path =
;access_key =
;secret_key =

[external_image_storage.webdav]
;url =
;public_url =
;username =
;password =

[external_image_storage.gcs]
;key_file =
;bucket =
;path =

[external_image_storage.azure_blob]
;account_name =
;account_key =
;container_name =

[external_image_storage.local]
# does not require any configuration

[rendering]
# Options to configure a remote HTTP image rendering service, e.g. using https://github.com/grafana/grafana-image-renderer.
# URL to a remote HTTP image renderer service, e.g. http://localhost:8081/render, will enable Grafana to render panels and dashboards to PNG-images using HTTP requests to an external service.
;server_url =
# If the remote HTTP image renderer service runs on a different server than the Grafana server you may have to configure this to a URL where Grafana is reachable, e.g. http://grafana.domain/.
;callback_url =
# Concurrent render request limit affects when the /render HTTP endpoint is used. Rendering many images at the same time can overload the server,
# which this setting can help protect against by only allowing a certain amount of concurrent requests.
;concurrent_render_request_limit = 30

[panels]
# If set to true Grafana will allow script tags in text panels. Not recommended as it enable XSS vulnerabilities.
;disable_sanitize_html = false

[plugins]
;enable_alpha = false
;app_tls_skip_verify_insecure = false
# Enter a comma-separated list of plugin identifiers to identify plugins to load even if they are unsigned. Plugins with modified signatures are never loaded.
;allow_loading_unsigned_plugins =
# Enable or disable installing / uninstalling / updating plugins directly from within Grafana.
;plugin_admin_enabled = false
;plugin_admin_external_manage_enabled = false
;plugin_catalog_url = https://grafana.com/grafana/plugins/
# Enter a comma-separated list of plugin identifiers to hide in the plugin catalog.
;plugin_catalog_hidden_plugins =

#################################### Grafana Live ##########################################
[live]
# max_connections to Grafana Live WebSocket endpoint per Grafana server instance. See Grafana Live docs
# if you are planning to make it higher than default 100 since this can require some OS and infrastructure
# tuning. 0 disables Live, -1 means unlimited connections.
;max_connections = 100

# allowed_origins is a comma-separated list of origins that can establish connection with Grafana Live.
# If not set then origin will be matched over root_url. Supports wildcard symbol "*".
;allowed_origins =

# engine defines an HA (high availability) engine to use for Grafana Live. By default no engine used - in
# this case Live features work only on a single Grafana server. Available options: "redis".
# Setting ha_engine is an EXPERIMENTAL feature.
;ha_engine =

# ha_engine_address sets a connection address for Live HA engine. Depending on engine type address format can differ.
# For now we only support Redis connection address in "host:port" format.
# This option is EXPERIMENTAL.
;ha_engine_address = "127.0.0.1:6379"

#################################### Grafana Image Renderer Plugin ##########################
[plugin.grafana-image-renderer]
# Instruct headless browser instance to use a default timezone when not provided by Grafana, e.g. when rendering panel image of alert.
# See ICU’s metaZones.txt (https://cs.chromium.org/chromium/src/third_party/icu/source/data/misc/metaZones.txt) for a list of supported
# timezone IDs. Fallbacks to TZ environment variable if not set.
;rendering_timezone =

# Instruct headless browser instance to use a default language when not provided by Grafana, e.g. when rendering panel image of alert.
# Please refer to the HTTP header Accept-Language to understand how to format this value, e.g. 'fr-CH, fr;q=0.9, en;q=0.8, de;q=0.7, *;q=0.5'.
;rendering_language =

# Instruct headless browser instance to use a default device scale factor when not provided by Grafana, e.g. when rendering panel image of alert.
# Default is 1. Using a higher value will produce more detailed images (higher DPI), but will require more disk space to store an image.
;rendering_viewport_device_scale_factor =

# Instruct headless browser instance whether to ignore HTTPS errors during navigation. Per default HTTPS errors are not ignored. Due to
# the security risk it's not recommended to ignore HTTPS errors.
;rendering_ignore_https_errors =

# Instruct headless browser instance whether to capture and log verbose information when rendering an image. Default is false and will
# only capture and log error messages. When enabled, debug messages are captured and logged as well.
# For the verbose information to be included in the Grafana server log you have to adjust the rendering log level to debug, configure
# [log].filter = rendering:debug.
;rendering_verbose_logging =

# Instruct headless browser instance whether to output its debug and error messages into running process of remote rendering service.
# Default is false. This can be useful to enable (true) when troubleshooting.
;rendering_dumpio =

# Additional arguments to pass to the headless browser instance. Default is --no-sandbox. The list of Chromium flags can be found
# here (https://peter.sh/experiments/chromium-command-line-switches/). Multiple arguments is separated with comma-character.
;rendering_args =

# You can configure the plugin to use a different browser binary instead of the pre-packaged version of Chromium.
# Please note that this is not recommended, since you may encounter problems if the installed version of Chrome/Chromium is not
# compatible with the plugin.
;rendering_chrome_bin =

# Instruct how headless browser instances are created. Default is 'default' and will create a new browser instance on each request.
# Mode 'clustered' will make sure that only a maximum of browsers/incognito pages can execute concurrently.
# Mode 'reusable' will have one browser instance and will create a new incognito page on each request.
;rendering_mode =

# When rendering_mode = clustered, you can instruct how many browsers or incognito pages can execute concurrently. Default is 'browser'
# and will cluster using browser instances.
# Mode 'context' will cluster using incognito pages.
;rendering_clustering_mode =
# When rendering_mode = clustered, you can define the maximum number of browser instances/incognito pages that can execute concurrently. Default is '5'.
;rendering_clustering_max_concurrency =
# When rendering_mode = clustered, you can specify the duration a rendering request can take before it will time out. Default is `30` seconds.
;rendering_clustering_timeout =

# Limit the maximum viewport width, height and device scale factor that can be requested.
;rendering_viewport_max_width =
;rendering_viewport_max_height =
;rendering_viewport_max_device_scale_factor =

# Change the listening host and port of the gRPC server. Default host is 127.0.0.1 and default port is 0 and will automatically assign
# a port not in use.
;grpc_host =
[enterprise]
# Path to a valid Grafana Enterprise license.jwt file
;license_path =

[feature_toggles]
# enable features, separated by spaces
;enable =

[date_formats]
# For information on what formatting patterns that are supported https://momentjs.com/docs/#/displaying/

# Default system date format used in time range picker and other places where full time is displayed
;full_date = YYYY-MM-DD HH:mm:ss

# Used by graph and other places where we only show small intervals
;interval_second = HH:mm:ss
;interval_minute = HH:mm
;interval_hour = MM/DD HH:mm
;interval_day = MM/DD
;interval_month = YYYY-MM
;interval_year = YYYY

# Experimental feature
;use_browser_locale = false

# Default timezone for user preferences. Options are 'browser' for the browser local timezone or a timezone name from IANA Time Zone database, e.g. 'UTC' or 'Europe/Amsterdam' etc.
;default_timezone = browser

[expressions]
# Enable or disable the expressions functionality.
;enabled = true

[geomap]
# Set the JSON configuration for the default basemap
;default_baselayer_config = `{
;  "type": "xyz",
;  "config": {
;    "attribution": "Open street map",
;    "url": "https://tile.openstreetmap.org/{z}/{x}/{y}.png"
;  }
;}`

# Enable or disable loading other base map layers
;enable_custom_baselayers = true
puhhh ich hoffe das ich alles fehlerfrei kopiert habe :)
-
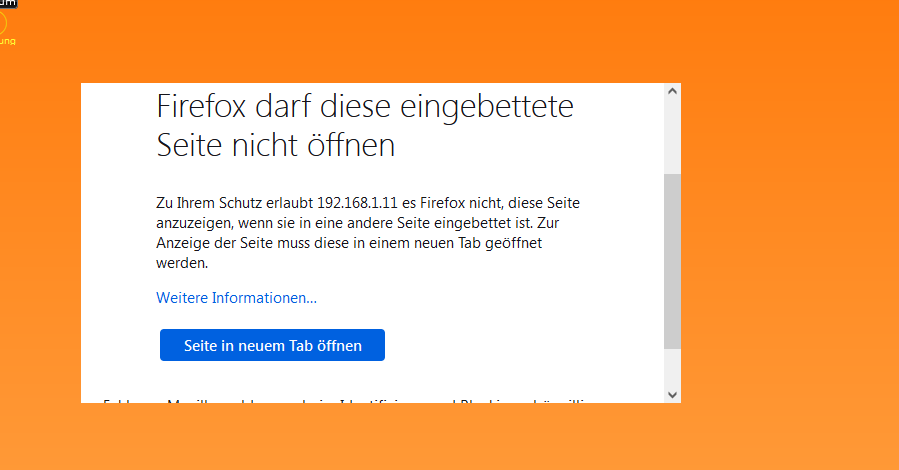
mach mal den ; weg, dann grafana server neustarten.
# set to true if you want to allow browsers to render Grafana in a <frame>, <iframe>, <embed> or <object>. default is false.
;allow_embedding = true
Ich bin mir relativ sicher, dass das der Fehler ist, weil so ist es nicht aktiv!
-
mach mal den ; weg, dann grafana server neustarten.
# set to true if you want to allow browsers to render Grafana in a <frame>, <iframe>, <embed> or <object>. default is false.
;allow_embedding = true
Ich bin mir relativ sicher, dass das der Fehler ist, weil so ist es nicht aktiv!
@saeft_2003 richtig, man muss bei den geänderten Zeilen auch das ; entfernen damit diese aktiv ist
hab ich mir hier schon gedacht, denn beim rauskopieren und in code tags setzen, werden die nicht mit angezeigt -
mach mal den ; weg, dann grafana server neustarten.
# set to true if you want to allow browsers to render Grafana in a <frame>, <iframe>, <embed> or <object>. default is false.
;allow_embedding = true
Ich bin mir relativ sicher, dass das der Fehler ist, weil so ist es nicht aktiv!
@saeft_2003 in Welcher "Rubrik" finde ich das unter sudo nano /etc/influxdb/influxdb.conf
Iobroker läuft als VM auf Proxmoxserver x folgende Hersteller im Einsatz Sonoff, Gosund, Siemens x Aofo über Tasmota x Zigbee x das Smarthome wächst und wächst
-
@saeft_2003 in Welcher "Rubrik" finde ich das unter sudo nano /etc/influxdb/influxdb.conf
-
@crunchip Ja klar :)
sudo nano /etc/influxdb/influxdb.confhier finde ich das nicht mehr es muss bei security stehen. Oder bin ich in der falschen config drinnen
Iobroker läuft als VM auf Proxmoxserver x folgende Hersteller im Einsatz Sonoff, Gosund, Siemens x Aofo über Tasmota x Zigbee x das Smarthome wächst und wächst
-
@crunchip Ja klar :)
sudo nano /etc/influxdb/influxdb.confhier finde ich das nicht mehr es muss bei security stehen. Oder bin ich in der falschen config drinnen
@basti97
das steht nicht drin, musst du manuell hinzufügen
da steht es
11. Absatz unter Security, da muss noch das ; weg# set to true if you want to allow browsers to render Grafana in a <frame>, <iframe>, <embed> or <object>. default is false. ;allow_embedding = true -
@crunchip Ja klar :)
sudo nano /etc/influxdb/influxdb.confhier finde ich das nicht mehr es muss bei security stehen. Oder bin ich in der falschen config drinnen
@basti97 sagte in Grafana iFrame in VIS:
@crunchip Ja klar :)
sudo nano /etc/influxdb/influxdb.confhier finde ich das nicht mehr es muss bei security stehen. Oder bin ich in der falschen config drinnen
Das ist falsch. Du musst in die grafana.ini
Da wo du das auch rauskopiert hast….
-
@basti97 sagte in Grafana iFrame in VIS:
@crunchip Ja klar :)
sudo nano /etc/influxdb/influxdb.confhier finde ich das nicht mehr es muss bei security stehen. Oder bin ich in der falschen config drinnen
Das ist falsch. Du musst in die grafana.ini
Da wo du das auch rauskopiert hast….
@saeft_2003 Ich habe es gefunden so nun erstmals neu starten und hoffen.
Ich habe mindestens eine Stunde in der Config gesucht hatte schon angst. Das ich es ausversehen beim kopieren gelöscht habe.
Iobroker läuft als VM auf Proxmoxserver x folgende Hersteller im Einsatz Sonoff, Gosund, Siemens x Aofo über Tasmota x Zigbee x das Smarthome wächst und wächst
-
@saeft_2003 Ich habe es gefunden so nun erstmals neu starten und hoffen.
Ich habe mindestens eine Stunde in der Config gesucht hatte schon angst. Das ich es ausversehen beim kopieren gelöscht habe.
-
@saeft_2003 Ich habe es gefunden so nun erstmals neu starten und hoffen.
Ich habe mindestens eine Stunde in der Config gesucht hatte schon angst. Das ich es ausversehen beim kopieren gelöscht habe.
@basti97 sagte in Grafana iFrame in VIS:
@saeft_2003 Ich habe es gefunden so nun erstmals neu starten und hoffen.
Ich habe mindestens eine Stunde in der Config gesucht hatte schon angst. Das ich es ausversehen beim kopieren gelöscht habe.
Und? Gehts?
-
@basti97 sagte in Grafana iFrame in VIS:
@saeft_2003 Ich habe es gefunden so nun erstmals neu starten und hoffen.
Ich habe mindestens eine Stunde in der Config gesucht hatte schon angst. Das ich es ausversehen beim kopieren gelöscht habe.
Und? Gehts?
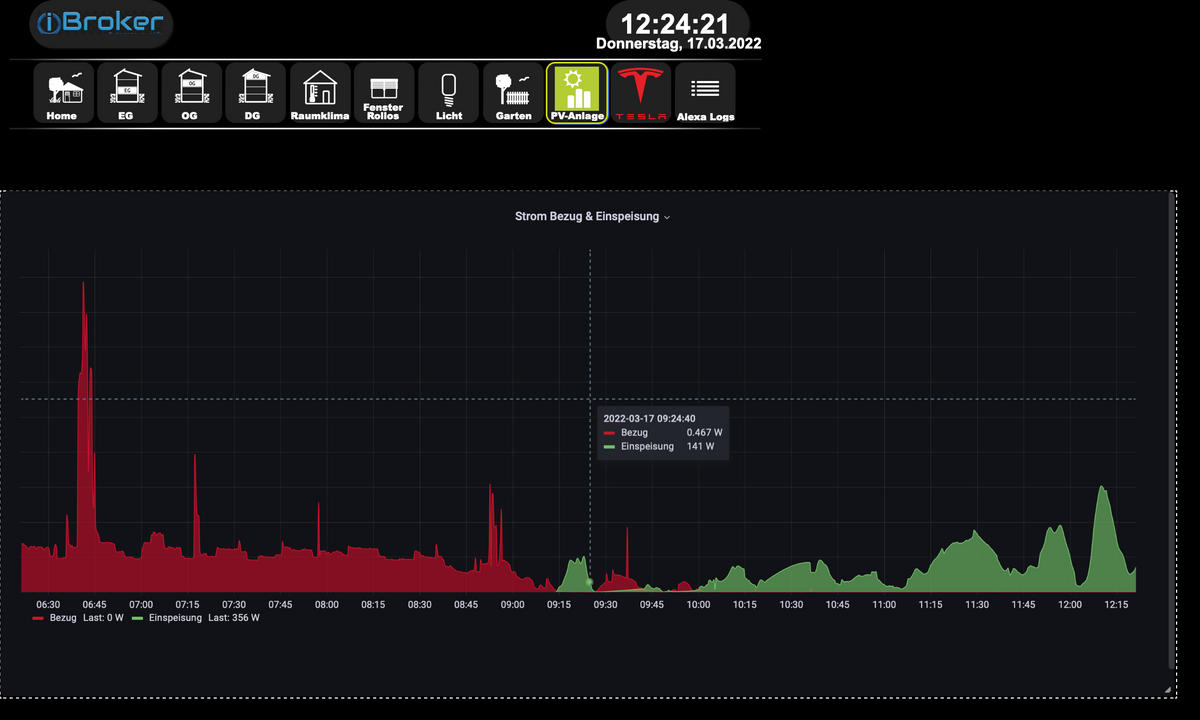
@saeft_2003 Ja es funktioniert auf dem PC auf dem Smartphone habe ich noch nicht probiert. Aber dort wird es denke ich auch funktionieren. Bastel gerade erstmal ein kleines Diagramm. Weißt du wie ich komplette Einträge in der Datenbank löschen kann.
Hindergrund: Ich habe ein Diagramm wo bereits ein Datenpunkt seit gestern aufgezeichnet ist. Nun wollte ich einen weiteren Hinzufügen aber dieser fängt bei der Uhrzeit von gestern an.Iobroker läuft als VM auf Proxmoxserver x folgende Hersteller im Einsatz Sonoff, Gosund, Siemens x Aofo über Tasmota x Zigbee x das Smarthome wächst und wächst
-
@saeft_2003 Ja es funktioniert auf dem PC auf dem Smartphone habe ich noch nicht probiert. Aber dort wird es denke ich auch funktionieren. Bastel gerade erstmal ein kleines Diagramm. Weißt du wie ich komplette Einträge in der Datenbank löschen kann.
Hindergrund: Ich habe ein Diagramm wo bereits ein Datenpunkt seit gestern aufgezeichnet ist. Nun wollte ich einen weiteren Hinzufügen aber dieser fängt bei der Uhrzeit von gestern an.@basti97 sagte in Grafana iFrame in VIS:
Hindergrund: Ich habe ein Diagramm wo bereits ein Datenpunkt seit gestern aufgezeichnet ist. Nun wollte ich einen weiteren Hinzufügen aber dieser fängt bei der Uhrzeit von gestern an.
hab dir im anderen Thread schon geantwortet, verstehe jetzt aber nicht dein Problem zwecks Uhrzeit
-

Hey! Du scheinst an dieser Unterhaltung interessiert zu sein, hast aber noch kein Konto.
Hast du es satt, bei jedem Besuch durch die gleichen Beiträge zu scrollen? Wenn du dich für ein Konto anmeldest, kommst du immer genau dorthin zurück, wo du zuvor warst, und kannst dich über neue Antworten benachrichtigen lassen (entweder per E-Mail oder Push-Benachrichtigung). Du kannst auch Lesezeichen speichern und Beiträge positiv bewerten, um anderen Community-Mitgliedern deine Wertschätzung zu zeigen.
Mit deinem Input könnte dieser Beitrag noch besser werden 💗
Registrieren AnmeldenSupport us
281
Online33.0k
Benutzer83.5k
Themen1.3m
Beiträge