Skip to content
  • Home
  • Aktuell
  • Tags
  • 0 Ungelesen 0
  • Kategorien
  • Unreplied
  • Beliebt
  • GitHub
  • Docu
  • Hilfe
Skins
  • Light
  • Brite
  • Cerulean
  • Cosmo
  • Flatly
  • Journal
  • Litera
  • Lumen
  • Lux
  • Materia
  • Minty
  • Morph
  • Pulse
  • Sandstone
  • Simplex
  • Sketchy
  • Spacelab
  • United
  • Yeti
  • Zephyr
  • Dark
  • Cyborg
  • Darkly
  • Quartz
  • Slate
  • Solar
  • Superhero
  • Vapor

  • Standard: (Kein Skin)
  • Kein Skin
Einklappen
ioBroker Logo

Community Forum

donate donate
  1. ioBroker Community Home
  2. Deutsch
  3. ioBroker Allgemein
  4. Welche proxmox VMs habt ihr?

NEWS

  • UPDATE 31.10.: Amazon Alexa - ioBroker Skill läuft aus ?
    apollon77A
    apollon77
    48
    3
    8.8k

  • Monatsrückblick – September 2025
    BluefoxB
    Bluefox
    13
    1
    2.2k

  • Neues Video "KI im Smart Home" - ioBroker plus n8n
    BluefoxB
    Bluefox
    16
    1
    3.2k

Welche proxmox VMs habt ihr?

Geplant Angeheftet Gesperrt Verschoben ioBroker Allgemein
proxmox
119 Beiträge 19 Kommentatoren 15.9k Aufrufe 22 Watching
  • Älteste zuerst
  • Neuste zuerst
  • Meiste Stimmen
Antworten
  • In einem neuen Thema antworten
Anmelden zum Antworten
Dieses Thema wurde gelöscht. Nur Nutzer mit entsprechenden Rechten können es sehen.
  • S Sempre

    @BBTown

    Bei mir war der Eintrag schon vorhanden, das sollte er normal bei dir auch sein.

    BBTownB Offline
    BBTownB Offline
    BBTown
    schrieb am zuletzt editiert von BBTown
    #110

    @Sempre @crunchip

    Nein, wie zuvor schon einmal angemerkt ist der Eintrag bei mir nicht vorhanden.
    Die Installation erfolgte frisch mit der aktuellsten Version 6.2.5

    #################################### Security ####################################
    [security]
    # default admin user, created on startup
    ;admin_user = admin
    
    # default admin password, can be changed before first start of grafana,  or in profile settings
    ;admin_password = admin
    
    # used for signing
    ;secret_key = 
    
    # disable gravatar profile images
    ;disable_gravatar = false
    
    # data source proxy whitelist (ip_or_domain:port separated by spaces)
    ;data_source_proxy_whitelist =
    
    # disable protection against brute force login attempts
    ;disable_brute_force_login_protection = false
    
    # set to true if you host Grafana behind HTTPS. default is false.
    ;cookie_secure = false
    
    # set cookie SameSite attribute. defaults to `lax`. can be set to "lax", "strict" and "none"
    ;cookie_samesite = lax
    
    #################################### Snapshots ###########################
    

    ioBroker auf NUC (VM debian v13 (Trixie ), node v22.21.0 npm v10.9.4, js-controller v7.0.7 jsonl/jsonl / HomeMatic CCU-2 (Wired und Funk) / Philips HUE / echo.DOT / Broadlink RM pro / SONOS

    1 Antwort Letzte Antwort
    0
    • S steimi

      @saeft_2003
      debMatic mit USB-Adapter für Funkmodul zur Steuerung der Homematic Komponenten
      Zoneminder zur Anzeige/Kameraüberwachung

      G Offline
      G Offline
      Gerni
      schrieb am zuletzt editiert von
      #111

      @steimi nutzt du HMIP und auch die normalen HM Geräte über den USB Stick mit debmatic?

      Jede Menge verschiedenes Zeug

      1 Antwort Letzte Antwort
      0
      • S Offline
        S Offline
        steimi
        schrieb am zuletzt editiert von
        #112

        Ich habe mein Raspberry Pi Funkmodul von ELV über das USB-Modul angebunden. Damit laufen Hm- als auch HmIP Geräte. Läuft stabil.

        1 Antwort Letzte Antwort
        0
        • crunchipC Abwesend
          crunchipC Abwesend
          crunchip
          Forum Testing Most Active
          schrieb am zuletzt editiert von
          #113

          @GeorgS ein Screen, aufgrund eines privatchat
          42fd9fb4-ad5d-4895-a148-e274002075b5-image.png

          umgestiegen von Proxmox auf Unraid

          G 1 Antwort Letzte Antwort
          0
          • crunchipC crunchip

            @GeorgS ein Screen, aufgrund eines privatchat
            42fd9fb4-ad5d-4895-a148-e274002075b5-image.png

            G Offline
            G Offline
            GeorgS
            schrieb am zuletzt editiert von GeorgS
            #114

            @crunchip Danke dafür, es geht um das Grafana Dashboard für die Fritzbox aus dem Beitrag (https://forum.iobroker.net/topic/23503/welche-proxmox-vms-habt-ihr/21)

            Leider stehen bei diesen Datenpunkten keine Werte...
            1.JPG

            grüße
            Georg

            Intel NUC, MaxCul, Xiaomi Vacuum Cleaner, Philips Hue, Zigbee, FritzDECT,Shelly

            crunchipC 2 Antworten Letzte Antwort
            0
            • G GeorgS

              @crunchip Danke dafür, es geht um das Grafana Dashboard für die Fritzbox aus dem Beitrag (https://forum.iobroker.net/topic/23503/welche-proxmox-vms-habt-ihr/21)

              Leider stehen bei diesen Datenpunkten keine Werte...
              1.JPG

              crunchipC Abwesend
              crunchipC Abwesend
              crunchip
              Forum Testing Most Active
              schrieb am zuletzt editiert von crunchip
              #115

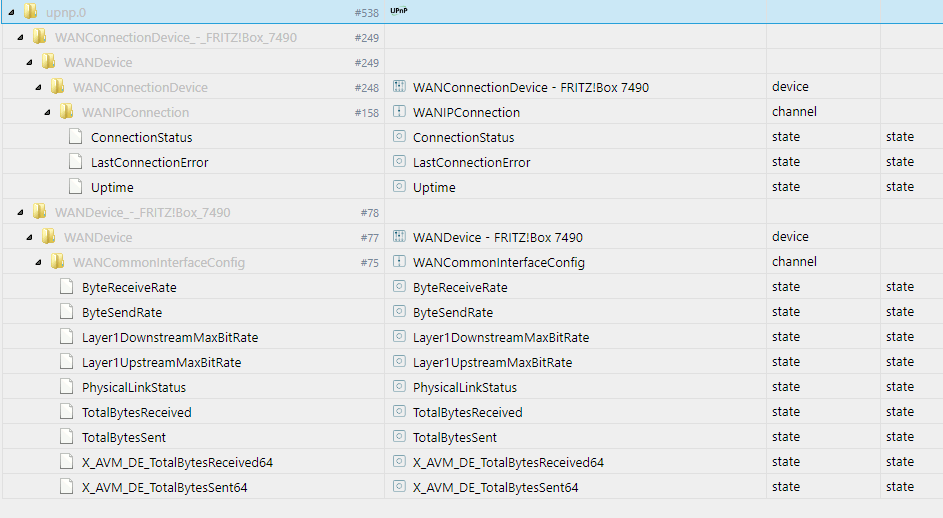
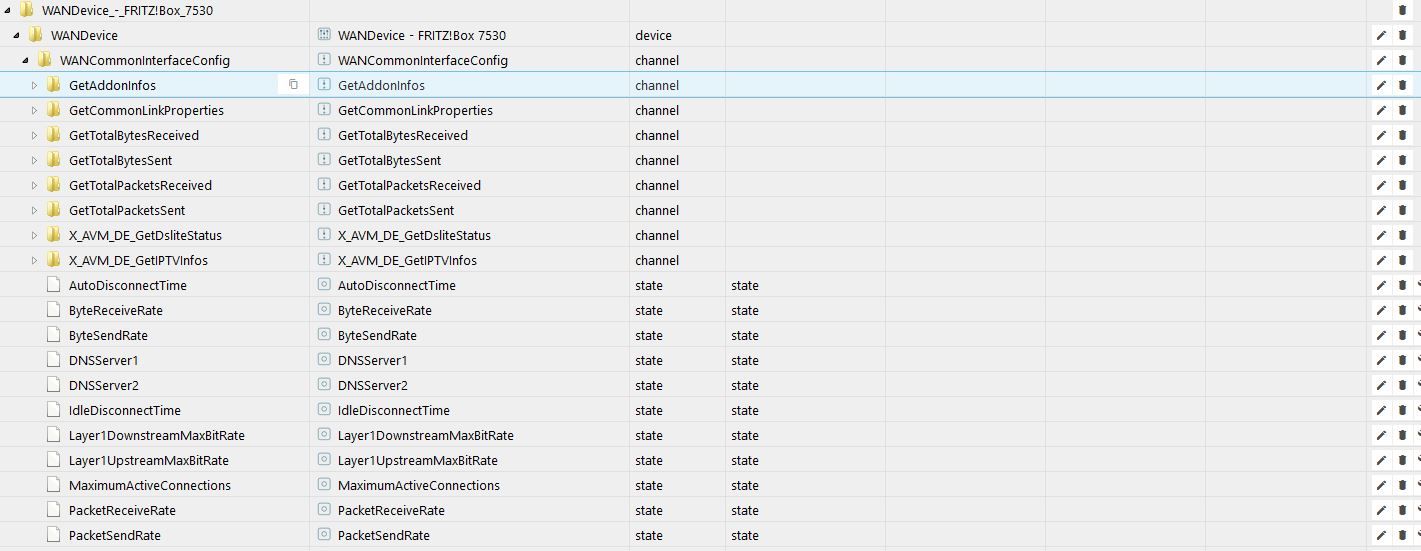
              @GeorgS du musst upnp.0.WANDevice_-FRITZ!Box_7490.WANDevice.WANCommonInterfaceConfig.GetAddonInfos öffnen, unten siehst du den request button, da auf den schraubenschlüssel und dann upnp...
              und dieser
              upnp.0.WANConnectionDevice
              -_FRITZ!Box_7490.WANDevice.WANConnectionDevice.WANIPConnection.GetStatusInfo

              umgestiegen von Proxmox auf Unraid

              1 Antwort Letzte Antwort
              0
              • G GeorgS

                @crunchip Danke dafür, es geht um das Grafana Dashboard für die Fritzbox aus dem Beitrag (https://forum.iobroker.net/topic/23503/welche-proxmox-vms-habt-ihr/21)

                Leider stehen bei diesen Datenpunkten keine Werte...
                1.JPG

                crunchipC Abwesend
                crunchipC Abwesend
                crunchip
                Forum Testing Most Active
                schrieb am zuletzt editiert von
                #116

                @GeorgS

                {
                 "__inputs": [
                   {
                     "name": "DS_INFLUXDB-COLLECTD",
                     "label": "InfluxDB-collectd",
                     "description": "",
                     "type": "datasource",
                     "pluginId": "influxdb",
                     "pluginName": "InfluxDB"
                   }
                 ],
                 "__requires": [
                   {
                     "type": "grafana",
                     "id": "grafana",
                     "name": "Grafana",
                     "version": "6.1.0"
                   },
                   {
                     "type": "panel",
                     "id": "graph",
                     "name": "Graph",
                     "version": ""
                   },
                   {
                     "type": "datasource",
                     "id": "influxdb",
                     "name": "InfluxDB",
                     "version": "1.0.0"
                   },
                   {
                     "type": "panel",
                     "id": "singlestat",
                     "name": "Singlestat",
                     "version": ""
                   },
                   {
                     "type": "panel",
                     "id": "table",
                     "name": "Table",
                     "version": ""
                   }
                 ],
                 "annotations": {
                   "list": [
                     {
                       "builtIn": 1,
                       "datasource": "-- Grafana --",
                       "enable": true,
                       "hide": true,
                       "iconColor": "rgba(0, 211, 255, 1)",
                       "name": "Annotations & Alerts",
                       "type": "dashboard"
                     }
                   ]
                 },
                 "description": "Monitor FRITZ!Box routers.",
                 "editable": true,
                 "gnetId": 713,
                 "graphTooltip": 2,
                 "id": null,
                 "links": [],
                 "panels": [
                   {
                     "cacheTimeout": null,
                     "colorBackground": true,
                     "colorValue": false,
                     "colors": [
                       "#1f78c1",
                       "rgba(237, 129, 40, 0.89)",
                       "rgba(245, 54, 54, 0.9)"
                     ],
                     "datasource": "${DS_INFLUXDB-COLLECTD}",
                     "format": "none",
                     "gauge": {
                       "maxValue": 100,
                       "minValue": 0,
                       "show": false,
                       "thresholdLabels": false,
                       "thresholdMarkers": true
                     },
                     "gridPos": {
                       "h": 4,
                       "w": 4,
                       "x": 0,
                       "y": 0
                     },
                     "id": 10,
                     "interval": "",
                     "links": [],
                     "mappingType": 1,
                     "mappingTypes": [
                       {
                         "name": "value to text",
                         "value": 1
                       },
                       {
                         "name": "range to text",
                         "value": 2
                       }
                     ],
                     "maxDataPoints": 100,
                     "nullPointMode": "connected",
                     "nullText": null,
                     "postfix": "",
                     "postfixFontSize": "50%",
                     "prefix": "",
                     "prefixFontSize": "50%",
                     "rangeMaps": [
                       {
                         "from": "null",
                         "text": "N/A",
                         "to": "null"
                       }
                     ],
                     "sparkline": {
                       "fillColor": "rgba(31, 118, 189, 0.18)",
                       "full": false,
                       "lineColor": "rgb(31, 120, 193)",
                       "show": false
                     },
                     "tableColumn": "last",
                     "targets": [
                       {
                         "dsType": "influxdb",
                         "groupBy": [],
                         "limit": "",
                         "measurement": "upnp.0.WANConnectionDevice_-_FRITZ!Box_7490.WANDevice.WANConnectionDevice.WANIPConnection.ConnectionStatus",
                         "orderByTime": "ASC",
                         "policy": "default",
                         "query": "SELECT last(\"ack\") FROM \"upnp.0.WANConnectionDevice_-_FRITZ!Box_7490.WANDevice.WANConnectionDevice.WANIPConnection.ConnectionStatus\" WHERE $timeFilter",
                         "rawQuery": false,
                         "refId": "A",
                         "resultFormat": "table",
                         "select": [
                           [
                             {
                               "params": [
                                 "value"
                               ],
                               "type": "field"
                             },
                             {
                               "params": [],
                               "type": "last"
                             }
                           ]
                         ],
                         "slimit": "",
                         "tags": [],
                         "target": "",
                         "tz": ""
                       }
                     ],
                     "thresholds": "1,1",
                     "timeFrom": null,
                     "title": "Connection Status",
                     "type": "singlestat",
                     "valueFontSize": "80%",
                     "valueMaps": [
                       {
                         "op": "=",
                         "text": "N/A",
                         "value": "null"
                       },
                       {
                         "op": "=",
                         "text": "Disconnected",
                         "value": "1"
                       },
                       {
                         "op": "=",
                         "text": "Connected",
                         "value": "0"
                       }
                     ],
                     "valueName": "current"
                   },
                   {
                     "cacheTimeout": null,
                     "colorBackground": true,
                     "colorValue": false,
                     "colors": [
                       "#1f78c1",
                       "rgba(237, 129, 40, 0.89)",
                       "rgba(245, 54, 54, 0.9)"
                     ],
                     "datasource": "${DS_INFLUXDB-COLLECTD}",
                     "format": "none",
                     "gauge": {
                       "maxValue": 100,
                       "minValue": 0,
                       "show": false,
                       "thresholdLabels": false,
                       "thresholdMarkers": true
                     },
                     "gridPos": {
                       "h": 4,
                       "w": 4,
                       "x": 4,
                       "y": 0
                     },
                     "id": 9,
                     "interval": null,
                     "links": [],
                     "mappingType": 1,
                     "mappingTypes": [
                       {
                         "name": "value to text",
                         "value": 1
                       },
                       {
                         "name": "range to text",
                         "value": 2
                       }
                     ],
                     "maxDataPoints": 100,
                     "nullPointMode": "connected",
                     "nullText": null,
                     "postfix": "",
                     "postfixFontSize": "50%",
                     "prefix": "",
                     "prefixFontSize": "50%",
                     "rangeMaps": [
                       {
                         "from": "null",
                         "text": "N/A",
                         "to": "null"
                       }
                     ],
                     "sparkline": {
                       "fillColor": "rgba(31, 118, 189, 0.18)",
                       "full": false,
                       "lineColor": "rgb(31, 120, 193)",
                       "show": false
                     },
                     "tableColumn": "last",
                     "targets": [
                       {
                         "dsType": "influxdb",
                         "groupBy": [],
                         "measurement": "upnp.0.WANDevice_-_FRITZ!Box_7490.WANDevice.WANCommonInterfaceConfig.PhysicalLinkStatus",
                         "orderByTime": "ASC",
                         "policy": "default",
                         "refId": "A",
                         "resultFormat": "table",
                         "select": [
                           [
                             {
                               "params": [
                                 "value"
                               ],
                               "type": "field"
                             },
                             {
                               "params": [],
                               "type": "last"
                             }
                           ]
                         ],
                         "tags": [],
                         "target": ""
                       }
                     ],
                     "thresholds": "1,1",
                     "title": "DSL Link Status",
                     "type": "singlestat",
                     "valueFontSize": "80%",
                     "valueMaps": [
                       {
                         "op": "=",
                         "text": "N/A",
                         "value": "null"
                       },
                       {
                         "op": "=",
                         "text": "Disconnected",
                         "value": "1"
                       },
                       {
                         "op": "=",
                         "text": "Connected",
                         "value": "0"
                       }
                     ],
                     "valueName": "current"
                   },
                   {
                     "cacheTimeout": null,
                     "colorBackground": false,
                     "colorValue": false,
                     "colors": [
                       "rgba(245, 54, 54, 0.9)",
                       "rgba(237, 129, 40, 0.89)",
                       "rgba(50, 172, 45, 0.97)"
                     ],
                     "datasource": "${DS_INFLUXDB-COLLECTD}",
                     "format": "dtdurations",
                     "gauge": {
                       "maxValue": 100,
                       "minValue": 0,
                       "show": false,
                       "thresholdLabels": false,
                       "thresholdMarkers": true
                     },
                     "gridPos": {
                       "h": 4,
                       "w": 4,
                       "x": 8,
                       "y": 0
                     },
                     "id": 13,
                     "interval": null,
                     "links": [],
                     "mappingType": 1,
                     "mappingTypes": [
                       {
                         "name": "value to text",
                         "value": 1
                       },
                       {
                         "name": "range to text",
                         "value": 2
                       }
                     ],
                     "maxDataPoints": 100,
                     "nullPointMode": "connected",
                     "nullText": null,
                     "postfix": "",
                     "postfixFontSize": "50%",
                     "prefix": "",
                     "prefixFontSize": "50%",
                     "rangeMaps": [
                       {
                         "from": "null",
                         "text": "N/A",
                         "to": "null"
                       }
                     ],
                     "sparkline": {
                       "fillColor": "rgba(31, 118, 189, 0.18)",
                       "full": false,
                       "lineColor": "rgb(31, 120, 193)",
                       "show": false
                     },
                     "tableColumn": "",
                     "targets": [
                       {
                         "dsType": "influxdb",
                         "groupBy": [
                           {
                             "params": [
                               "$__interval"
                             ],
                             "type": "time"
                           }
                         ],
                         "measurement": "upnp.0.WANConnectionDevice_-_FRITZ!Box_7490.WANDevice.WANConnectionDevice.WANIPConnection.Uptime",
                         "orderByTime": "ASC",
                         "policy": "default",
                         "query": "SELECT last(\"value\") FROM \"upnp.0.WANConnectionDevice_-_FRITZ!Box_7490.WANDevice.WANConnectionDevice.WANIPConnection.Uptime\" AND $timeFilter GROUP BY time($interval)",
                         "rawQuery": false,
                         "refId": "A",
                         "resultFormat": "time_series",
                         "select": [
                           [
                             {
                               "params": [
                                 "value"
                               ],
                               "type": "field"
                             },
                             {
                               "params": [],
                               "type": "last"
                             }
                           ]
                         ],
                         "tags": [],
                         "target": ""
                       }
                     ],
                     "thresholds": "1,1",
                     "title": "Uptime",
                     "type": "singlestat",
                     "valueFontSize": "80%",
                     "valueMaps": [
                       {
                         "op": "=",
                         "text": "N/A",
                         "value": "null"
                       },
                       {
                         "op": "=",
                         "text": "Disconnected",
                         "value": "0"
                       },
                       {
                         "op": "=",
                         "text": "Connected",
                         "value": "1"
                       }
                     ],
                     "valueName": "current"
                   },
                   {
                     "cacheTimeout": null,
                     "colorBackground": false,
                     "colorValue": false,
                     "colors": [
                       "rgba(245, 54, 54, 0.9)",
                       "rgba(237, 129, 40, 0.89)",
                       "#1f78c1"
                     ],
                     "datasource": "${DS_INFLUXDB-COLLECTD}",
                     "decimals": null,
                     "format": "bps",
                     "gauge": {
                       "maxValue": 51392000,
                       "minValue": 0,
                       "show": true,
                       "thresholdLabels": false,
                       "thresholdMarkers": false
                     },
                     "gridPos": {
                       "h": 4,
                       "w": 4,
                       "x": 12,
                       "y": 0
                     },
                     "id": 11,
                     "interval": null,
                     "links": [],
                     "mappingType": 1,
                     "mappingTypes": [
                       {
                         "name": "value to text",
                         "value": 1
                       },
                       {
                         "name": "range to text",
                         "value": 2
                       }
                     ],
                     "maxDataPoints": 100,
                     "nullPointMode": "connected",
                     "nullText": null,
                     "postfix": "",
                     "postfixFontSize": "50%",
                     "prefix": "",
                     "prefixFontSize": "50%",
                     "rangeMaps": [
                       {
                         "from": "null",
                         "text": "N/A",
                         "to": "null"
                       }
                     ],
                     "sparkline": {
                       "fillColor": "rgba(31, 118, 189, 0.18)",
                       "full": false,
                       "lineColor": "rgb(31, 120, 193)",
                       "show": false
                     },
                     "tableColumn": "",
                     "targets": [
                       {
                         "dsType": "influxdb",
                         "groupBy": [
                           {
                             "params": [
                               "$__interval"
                             ],
                             "type": "time"
                           }
                         ],
                         "measurement": "upnp.0.WANDevice_-_FRITZ!Box_7490.WANDevice.WANCommonInterfaceConfig.ByteReceiveRate",
                         "orderByTime": "ASC",
                         "policy": "default",
                         "refId": "A",
                         "resultFormat": "time_series",
                         "select": [
                           [
                             {
                               "params": [
                                 "value"
                               ],
                               "type": "field"
                             },
                             {
                               "params": [],
                               "type": "last"
                             }
                           ]
                         ],
                         "tags": [],
                         "target": ""
                       }
                     ],
                     "thresholds": "1,1",
                     "title": "Current Download",
                     "type": "singlestat",
                     "valueFontSize": "50%",
                     "valueMaps": [
                       {
                         "op": "=",
                         "text": "N/A",
                         "value": "null"
                       }
                     ],
                     "valueName": "current"
                   },
                   {
                     "cacheTimeout": null,
                     "colorBackground": false,
                     "colorValue": false,
                     "colors": [
                       "rgba(245, 54, 54, 0.9)",
                       "rgba(237, 129, 40, 0.89)",
                       "#e24d42"
                     ],
                     "datasource": "${DS_INFLUXDB-COLLECTD}",
                     "decimals": null,
                     "format": "bps",
                     "gauge": {
                       "maxValue": 10048000,
                       "minValue": 0,
                       "show": true,
                       "thresholdLabels": false,
                       "thresholdMarkers": false
                     },
                     "gridPos": {
                       "h": 4,
                       "w": 4,
                       "x": 16,
                       "y": 0
                     },
                     "id": 12,
                     "interval": null,
                     "links": [],
                     "mappingType": 1,
                     "mappingTypes": [
                       {
                         "name": "value to text",
                         "value": 1
                       },
                       {
                         "name": "range to text",
                         "value": 2
                       }
                     ],
                     "maxDataPoints": 100,
                     "nullPointMode": "connected",
                     "nullText": null,
                     "postfix": "",
                     "postfixFontSize": "50%",
                     "prefix": "",
                     "prefixFontSize": "50%",
                     "rangeMaps": [
                       {
                         "from": "null",
                         "text": "N/A",
                         "to": "null"
                       }
                     ],
                     "sparkline": {
                       "fillColor": "rgba(31, 118, 189, 0.18)",
                       "full": false,
                       "lineColor": "rgb(31, 120, 193)",
                       "show": false
                     },
                     "tableColumn": "",
                     "targets": [
                       {
                         "dsType": "influxdb",
                         "groupBy": [
                           {
                             "params": [
                               "$__interval"
                             ],
                             "type": "time"
                           }
                         ],
                         "measurement": "upnp.0.WANDevice_-_FRITZ!Box_7490.WANDevice.WANCommonInterfaceConfig.ByteSendRate",
                         "orderByTime": "ASC",
                         "policy": "default",
                         "refId": "A",
                         "resultFormat": "time_series",
                         "select": [
                           [
                             {
                               "params": [
                                 "value"
                               ],
                               "type": "field"
                             },
                             {
                               "params": [],
                               "type": "last"
                             }
                           ]
                         ],
                         "tags": [],
                         "target": ""
                       }
                     ],
                     "thresholds": "1,1",
                     "title": "Current Upload",
                     "type": "singlestat",
                     "valueFontSize": "50%",
                     "valueMaps": [
                       {
                         "op": "=",
                         "text": "N/A",
                         "value": "null"
                       }
                     ],
                     "valueName": "current"
                   },
                   {
                     "cacheTimeout": null,
                     "colorBackground": false,
                     "colorValue": false,
                     "colors": [
                       "rgba(245, 54, 54, 0.9)",
                       "rgba(237, 129, 40, 0.89)",
                       "rgba(50, 172, 45, 0.97)"
                     ],
                     "datasource": "${DS_INFLUXDB-COLLECTD}",
                     "decimals": null,
                     "format": "decbytes",
                     "gauge": {
                       "maxValue": 100,
                       "minValue": 0,
                       "show": false,
                       "thresholdLabels": false,
                       "thresholdMarkers": true
                     },
                     "gridPos": {
                       "h": 3,
                       "w": 5,
                       "x": 0,
                       "y": 4
                     },
                     "id": 3,
                     "interval": "",
                     "links": [],
                     "mappingType": 1,
                     "mappingTypes": [
                       {
                         "name": "value to text",
                         "value": 1
                       },
                       {
                         "name": "range to text",
                         "value": 2
                       }
                     ],
                     "maxDataPoints": 100,
                     "nullPointMode": "connected",
                     "nullText": null,
                     "postfix": "",
                     "postfixFontSize": "50%",
                     "prefix": "",
                     "prefixFontSize": "50%",
                     "rangeMaps": [
                       {
                         "from": "null",
                         "text": "N/A",
                         "to": "null"
                       }
                     ],
                     "sparkline": {
                       "fillColor": "rgba(31, 118, 189, 0.18)",
                       "full": false,
                       "lineColor": "rgb(31, 120, 193)",
                       "show": true
                     },
                     "tableColumn": "non_negative_difference",
                     "targets": [
                       {
                         "dsType": "influxdb",
                         "groupBy": [
                           {
                             "params": [
                               "$__interval"
                             ],
                             "type": "time"
                           },
                           {
                             "params": [
                               "linear"
                             ],
                             "type": "fill"
                           }
                         ],
                         "measurement": "upnp.0.WANDevice_-_FRITZ!Box_7490.WANDevice.WANCommonInterfaceConfig.X_AVM_DE_TotalBytesReceived64",
                         "orderByTime": "ASC",
                         "policy": "default",
                         "query": "SELECT cumulative_sum(non_negative_difference(last(\"value\"))) FROM \"upnp.0.WANDevice_-_FRITZ!Box_7490.WANDevice.WANCommonInterfaceConfig.X_AVM_DE_TotalBytesReceived64\" WHERE $timeFilter GROUP BY time($__interval) fill(linear) tz('Europe/Berlin')\n",
                         "rawQuery": true,
                         "refId": "A",
                         "resultFormat": "time_series",
                         "select": [
                           [
                             {
                               "params": [
                                 "value"
                               ],
                               "type": "field"
                             },
                             {
                               "params": [],
                               "type": "mean"
                             },
                             {
                               "params": [],
                               "type": "non_negative_difference"
                             },
                             {
                               "params": [],
                               "type": "cumulative_sum"
                             }
                           ]
                         ],
                         "tags": [],
                         "target": "",
                         "tz": ""
                       }
                     ],
                     "thresholds": "",
                     "timeFrom": null,
                     "title": "Total Download",
                     "type": "singlestat",
                     "valueFontSize": "80%",
                     "valueMaps": [
                       {
                         "op": "=",
                         "text": "N/A",
                         "value": "null"
                       }
                     ],
                     "valueName": "current"
                   },
                   {
                     "cacheTimeout": null,
                     "colorBackground": false,
                     "colorValue": false,
                     "colors": [
                       "rgba(245, 54, 54, 0.9)",
                       "rgba(237, 129, 40, 0.89)",
                       "rgba(50, 172, 45, 0.97)"
                     ],
                     "datasource": "${DS_INFLUXDB-COLLECTD}",
                     "decimals": null,
                     "format": "decbytes",
                     "gauge": {
                       "maxValue": 100,
                       "minValue": 0,
                       "show": false,
                       "thresholdLabels": false,
                       "thresholdMarkers": true
                     },
                     "gridPos": {
                       "h": 3,
                       "w": 5,
                       "x": 5,
                       "y": 4
                     },
                     "id": 8,
                     "interval": null,
                     "links": [],
                     "mappingType": 1,
                     "mappingTypes": [
                       {
                         "name": "value to text",
                         "value": 1
                       },
                       {
                         "name": "range to text",
                         "value": 2
                       }
                     ],
                     "maxDataPoints": 100,
                     "nullPointMode": "connected",
                     "nullText": null,
                     "postfix": "",
                     "postfixFontSize": "50%",
                     "prefix": "",
                     "prefixFontSize": "50%",
                     "rangeMaps": [
                       {
                         "from": "null",
                         "text": "N/A",
                         "to": "null"
                       }
                     ],
                     "sparkline": {
                       "fillColor": "rgba(137, 15, 2, 0.18)",
                       "full": false,
                       "lineColor": "#e24d42",
                       "show": true
                     },
                     "tableColumn": "",
                     "targets": [
                       {
                         "dsType": "influxdb",
                         "groupBy": [
                           {
                             "params": [
                               "$__interval"
                             ],
                             "type": "time"
                           },
                           {
                             "params": [
                               "linear"
                             ],
                             "type": "fill"
                           }
                         ],
                         "measurement": "upnp.0.WANDevice_-_FRITZ!Box_7490.WANDevice.WANCommonInterfaceConfig.X_AVM_DE_TotalBytesSent64",
                         "orderByTime": "ASC",
                         "policy": "default",
                         "query": "SELECT cumulative_sum(non_negative_difference(last(\"value\"))) FROM \"upnp.0.WANDevice_-_FRITZ!Box_7490.WANDevice.WANCommonInterfaceConfig.X_AVM_DE_TotalBytesSent64\" WHERE $timeFilter GROUP BY time($__interval) fill(linear) tz('Europe/Berlin')",
                         "rawQuery": true,
                         "refId": "A",
                         "resultFormat": "time_series",
                         "select": [
                           [
                             {
                               "params": [
                                 "value"
                               ],
                               "type": "field"
                             },
                             {
                               "params": [],
                               "type": "mean"
                             },
                             {
                               "params": [],
                               "type": "non_negative_difference"
                             },
                             {
                               "params": [],
                               "type": "cumulative_sum"
                             }
                           ]
                         ],
                         "tags": [],
                         "target": ""
                       }
                     ],
                     "thresholds": "",
                     "timeFrom": null,
                     "title": "Total Upload",
                     "type": "singlestat",
                     "valueFontSize": "80%",
                     "valueMaps": [
                       {
                         "op": "=",
                         "text": "N/A",
                         "value": "null"
                       }
                     ],
                     "valueName": "current"
                   },
                   {
                     "cacheTimeout": null,
                     "colorBackground": false,
                     "colorValue": false,
                     "colors": [
                       "rgba(245, 54, 54, 0.9)",
                       "rgba(237, 129, 40, 0.89)",
                       "rgba(50, 172, 45, 0.97)"
                     ],
                     "datasource": "${DS_INFLUXDB-COLLECTD}",
                     "decimals": null,
                     "format": "decbytes",
                     "gauge": {
                       "maxValue": 100,
                       "minValue": 0,
                       "show": false,
                       "thresholdLabels": false,
                       "thresholdMarkers": true
                     },
                     "gridPos": {
                       "h": 3,
                       "w": 5,
                       "x": 10,
                       "y": 4
                     },
                     "hideTimeOverride": false,
                     "id": 15,
                     "interval": null,
                     "links": [],
                     "mappingType": 1,
                     "mappingTypes": [
                       {
                         "name": "value to text",
                         "value": 1
                       },
                       {
                         "name": "range to text",
                         "value": 2
                       }
                     ],
                     "maxDataPoints": 100,
                     "nullPointMode": "connected",
                     "nullText": null,
                     "postfix": "",
                     "postfixFontSize": "50%",
                     "prefix": "",
                     "prefixFontSize": "50%",
                     "rangeMaps": [
                       {
                         "from": "null",
                         "text": "N/A",
                         "to": "null"
                       }
                     ],
                     "sparkline": {
                       "fillColor": "rgba(31, 118, 189, 0.18)",
                       "full": false,
                       "lineColor": "rgb(31, 120, 193)",
                       "show": true
                     },
                     "tableColumn": "",
                     "targets": [
                       {
                         "dsType": "influxdb",
                         "groupBy": [
                           {
                             "params": [
                               "$__interval"
                             ],
                             "type": "time"
                           },
                           {
                             "params": [
                               "null"
                             ],
                             "type": "fill"
                           }
                         ],
                         "measurement": "fritzbox_value",
                         "orderByTime": "ASC",
                         "policy": "default",
                         "query": "SELECT cumulative_sum(non_negative_difference(last(\"value\"))) FROM \"upnp.0.WANDevice_-_FRITZ!Box_7490.WANDevice.WANCommonInterfaceConfig.TotalBytesReceived\" WHERE $timeFilter GROUP BY time($__interval) fill(null) tz('Europe/Berlin')",
                         "rawQuery": true,
                         "refId": "A",
                         "resultFormat": "time_series",
                         "select": [
                           [
                             {
                               "params": [
                                 "value"
                               ],
                               "type": "field"
                             },
                             {
                               "params": [],
                               "type": "mean"
                             }
                           ]
                         ],
                         "tags": [
                           {
                             "key": "type_instance",
                             "operator": "=",
                             "value": "totalbytesreceived"
                           }
                         ],
                         "target": ""
                       }
                     ],
                     "thresholds": "",
                     "timeFrom": "1d",
                     "timeShift": null,
                     "title": "Last 24h Download",
                     "type": "singlestat",
                     "valueFontSize": "80%",
                     "valueMaps": [
                       {
                         "op": "=",
                         "text": "N/A",
                         "value": "null"
                       }
                     ],
                     "valueName": "current"
                   },
                   {
                     "cacheTimeout": null,
                     "colorBackground": false,
                     "colorValue": false,
                     "colors": [
                       "rgba(245, 54, 54, 0.9)",
                       "rgba(237, 129, 40, 0.89)",
                       "rgba(50, 172, 45, 0.97)"
                     ],
                     "datasource": "${DS_INFLUXDB-COLLECTD}",
                     "decimals": null,
                     "format": "decbytes",
                     "gauge": {
                       "maxValue": 100,
                       "minValue": 0,
                       "show": false,
                       "thresholdLabels": false,
                       "thresholdMarkers": true
                     },
                     "gridPos": {
                       "h": 3,
                       "w": 5,
                       "x": 15,
                       "y": 4
                     },
                     "id": 16,
                     "interval": null,
                     "links": [],
                     "mappingType": 1,
                     "mappingTypes": [
                       {
                         "name": "value to text",
                         "value": 1
                       },
                       {
                         "name": "range to text",
                         "value": 2
                       }
                     ],
                     "maxDataPoints": 100,
                     "nullPointMode": "connected",
                     "nullText": null,
                     "postfix": "",
                     "postfixFontSize": "50%",
                     "prefix": "",
                     "prefixFontSize": "50%",
                     "rangeMaps": [
                       {
                         "from": "null",
                         "text": "N/A",
                         "to": "null"
                       }
                     ],
                     "sparkline": {
                       "fillColor": "rgba(137, 15, 2, 0.18)",
                       "full": false,
                       "lineColor": "#e24d42",
                       "show": true
                     },
                     "tableColumn": "",
                     "targets": [
                       {
                         "dsType": "influxdb",
                         "groupBy": [
                           {
                             "params": [
                               "$__interval"
                             ],
                             "type": "time"
                           },
                           {
                             "params": [
                               "null"
                             ],
                             "type": "fill"
                           }
                         ],
                         "measurement": "fritzbox_value",
                         "orderByTime": "ASC",
                         "policy": "default",
                         "query": "SELECT cumulative_sum(non_negative_difference(last(\"value\"))) FROM \"upnp.0.WANDevice_-_FRITZ!Box_7490.WANDevice.WANCommonInterfaceConfig.TotalBytesSent\" WHERE $timeFilter GROUP BY time($__interval) fill(null) tz('Europe/Berlin')",
                         "rawQuery": true,
                         "refId": "A",
                         "resultFormat": "time_series",
                         "select": [
                           [
                             {
                               "params": [
                                 "value"
                               ],
                               "type": "field"
                             },
                             {
                               "params": [],
                               "type": "mean"
                             }
                           ]
                         ],
                         "tags": [
                           {
                             "key": "type_instance",
                             "operator": "=",
                             "value": "totalbytesreceived"
                           }
                         ],
                         "target": ""
                       }
                     ],
                     "thresholds": "",
                     "timeFrom": "1d",
                     "title": "Last 24h Upload",
                     "type": "singlestat",
                     "valueFontSize": "80%",
                     "valueMaps": [
                       {
                         "op": "=",
                         "text": "N/A",
                         "value": "null"
                       }
                     ],
                     "valueName": "current"
                   },
                   {
                     "aliasColors": {
                       "Download": "#1f78c1",
                       "Upload": "#e24d42",
                       "fritzbox_value.non_negative_derivative": "#ba43a9",
                       "fritzbox_value.non_negative_difference": "#e24d42"
                     },
                     "bars": true,
                     "dashLength": 10,
                     "dashes": false,
                     "datasource": "${DS_INFLUXDB-COLLECTD}",
                     "fill": 1,
                     "gridPos": {
                       "h": 5,
                       "w": 10,
                       "x": 0,
                       "y": 7
                     },
                     "id": 2,
                     "interval": "10s",
                     "legend": {
                       "alignAsTable": false,
                       "avg": false,
                       "current": false,
                       "hideEmpty": false,
                       "hideZero": false,
                       "max": false,
                       "min": false,
                       "rightSide": false,
                       "show": true,
                       "total": false,
                       "values": false
                     },
                     "lines": false,
                     "linewidth": 1,
                     "links": [],
                     "nullPointMode": "null",
                     "percentage": false,
                     "pointradius": 5,
                     "points": false,
                     "renderer": "flot",
                     "seriesOverrides": [],
                     "spaceLength": 10,
                     "stack": false,
                     "steppedLine": false,
                     "targets": [
                       {
                         "alias": "Download",
                         "dsType": "influxdb",
                         "groupBy": [
                           {
                             "params": [
                               "24h"
                             ],
                             "type": "time"
                           }
                         ],
                         "hide": false,
                         "measurement": "upnp.0.WANDevice_-_FRITZ!Box_7490.WANDevice.WANCommonInterfaceConfig.TotalBytesReceived",
                         "orderByTime": "ASC",
                         "policy": "default",
                         "query": "SELECT non_negative_difference(last(cumulative_sum))FROM (\nSELECT cumulative_sum(non_negative_difference(last(\"value\"))) FROM \"upnp.0.WANDevice_-_FRITZ!Box_7490.WANDevice.WANCommonInterfaceConfig.TotalBytesReceived\" WHERE $timeFilter GROUP BY time($__interval)\n) WHERE $timeFilter GROUP BY time(1d) tz('Europe/Berlin')",
                         "rawQuery": true,
                         "refId": "F",
                         "resultFormat": "time_series",
                         "select": [
                           [
                             {
                               "params": [
                                 "value"
                               ],
                               "type": "field"
                             },
                             {
                               "params": [],
                               "type": "last"
                             },
                             {
                               "params": [],
                               "type": "non_negative_difference"
                             },
                             {
                               "params": [],
                               "type": "cumulative_sum"
                             },
                             {
                               "params": [],
                               "type": "cumulative_sum"
                             },
                             {
                               "params": [],
                               "type": "non_negative_difference"
                             }
                           ]
                         ],
                         "tags": [],
                         "target": ""
                       },
                       {
                         "alias": "Upload",
                         "dsType": "influxdb",
                         "groupBy": [
                           {
                             "params": [
                               "24h"
                             ],
                             "type": "time"
                           }
                         ],
                         "hide": false,
                         "measurement": "fritzbox_value",
                         "orderByTime": "ASC",
                         "policy": "default",
                         "query": "SELECT non_negative_difference(last(cumulative_sum)) FROM (\nSELECT cumulative_sum(non_negative_difference(last(\"value\"))) FROM \"upnp.0.WANDevice_-_FRITZ!Box_7490.WANDevice.WANCommonInterfaceConfig.TotalBytesSent\" WHERE $timeFilter GROUP BY time($__interval)\n) WHERE $timeFilter GROUP BY time(1d) tz('Europe/Berlin')",
                         "rawQuery": true,
                         "refId": "A",
                         "resultFormat": "time_series",
                         "select": [
                           [
                             {
                               "params": [
                                 "value"
                               ],
                               "type": "field"
                             },
                             {
                               "params": [],
                               "type": "max"
                             },
                             {
                               "params": [
                                 "10s"
                               ],
                               "type": "non_negative_derivative"
                             }
                           ]
                         ],
                         "tags": [
                           {
                             "key": "type_instance",
                             "operator": "=",
                             "value": "totalbytesreceived"
                           }
                         ],
                         "target": ""
                       }
                     ],
                     "thresholds": [],
                     "timeFrom": null,
                     "timeRegions": [],
                     "timeShift": null,
                     "title": "Daily Traffic",
                     "tooltip": {
                       "shared": true,
                       "sort": 0,
                       "value_type": "individual"
                     },
                     "type": "graph",
                     "xaxis": {
                       "buckets": null,
                       "mode": "time",
                       "name": null,
                       "show": true,
                       "values": []
                     },
                     "yaxes": [
                       {
                         "decimals": 2,
                         "format": "decbytes",
                         "label": "",
                         "logBase": 1,
                         "max": null,
                         "min": null,
                         "show": true
                       },
                       {
                         "format": "decbytes",
                         "label": null,
                         "logBase": 1,
                         "max": null,
                         "min": null,
                         "show": true
                       }
                     ],
                     "yaxis": {
                       "align": false,
                       "alignLevel": null
                     }
                   },
                   {
                     "aliasColors": {
                       "download": "#1F78C1",
                       "upload": "#EA6460"
                     },
                     "annotate": {
                       "enable": false
                     },
                     "bars": true,
                     "dashLength": 10,
                     "dashes": false,
                     "datasource": "${DS_INFLUXDB-COLLECTD}",
                     "editable": true,
                     "fill": 0,
                     "grid": {},
                     "gridPos": {
                       "h": 5,
                       "w": 10,
                       "x": 10,
                       "y": 7
                     },
                     "id": 17,
                     "interval": "1h",
                     "legend": {
                       "avg": false,
                       "current": true,
                       "max": false,
                       "min": false,
                       "show": true,
                       "total": false,
                       "values": true
                     },
                     "lines": false,
                     "linewidth": 1,
                     "links": [],
                     "nullPointMode": "null",
                     "percentage": false,
                     "pointradius": 5,
                     "points": false,
                     "renderer": "flot",
                     "resolution": 100,
                     "scale": 1,
                     "seriesOverrides": [],
                     "spaceLength": 10,
                     "stack": false,
                     "steppedLine": true,
                     "targets": [
                       {
                         "alias": "download",
                         "dsType": "influxdb",
                         "fields": [
                           {
                             "func": "mean",
                             "name": "value"
                           }
                         ],
                         "groupBy": [
                           {
                             "params": [
                               "$interval"
                             ],
                             "type": "time"
                           },
                           {
                             "params": [
                               "null"
                             ],
                             "type": "fill"
                           }
                         ],
                         "groupByTags": [],
                         "hide": false,
                         "measurement": "upnp.0.WANDevice_-_FRITZ!Box_7490.WANDevice.WANCommonInterfaceConfig.TotalBytesReceived",
                         "orderByTime": "ASC",
                         "policy": "default",
                         "query": "SELECT mean(\"value\") FROM \"upnp.0.WANDevice_-_FRITZ!Box_7490.WANDevice.WANCommonInterfaceConfig.ByteReceiveRate\" WHERE $timeFilter GROUP BY time($interval) fill(null)",
                         "rawQuery": true,
                         "refId": "A",
                         "resultFormat": "time_series",
                         "select": [
                           [
                             {
                               "params": [
                                 "value"
                               ],
                               "type": "field"
                             },
                             {
                               "params": [],
                               "type": "mean"
                             }
                           ]
                         ],
                         "tags": [],
                         "target": "alias(summarize(nonNegativeDerivative(collectd.squirrel.fritzbox.bytes-totalbytesreceived, 0), '1h', 'sum'), 'download')"
                       },
                       {
                         "alias": "upload",
                         "dsType": "influxdb",
                         "fields": [
                           {
                             "func": "mean",
                             "name": "value"
                           }
                         ],
                         "fill": "null",
                         "groupBy": [
                           {
                             "params": [
                               "$interval"
                             ],
                             "type": "time"
                           },
                           {
                             "params": [
                               "null"
                             ],
                             "type": "fill"
                           }
                         ],
                         "groupByTags": [],
                         "hide": false,
                         "measurement": "upnp.0.WANDevice_-_FRITZ!Box_7490.WANDevice.WANCommonInterfaceConfig.ByteSendRate",
                         "orderByTime": "ASC",
                         "policy": "default",
                         "query": "SELECT mean(\"value\") FROM \"upnp.0.WANDevice_-_FRITZ!Box_7490.WANDevice.WANCommonInterfaceConfig.ByteSendRate\" WHERE $timeFilter GROUP BY time($interval) fill(null)",
                         "rawQuery": true,
                         "refId": "B",
                         "resultFormat": "time_series",
                         "select": [
                           [
                             {
                               "params": [
                                 "value"
                               ],
                               "type": "field"
                             },
                             {
                               "params": [],
                               "type": "mean"
                             }
                           ]
                         ],
                         "tags": [],
                         "target": "alias(summarize(nonNegativeDerivative(collectd.squirrel.fritzbox.bytes-totalbytessent,0),'1h','sum'),'upload')"
                       }
                     ],
                     "thresholds": [],
                     "timeFrom": null,
                     "timeRegions": [],
                     "timeShift": null,
                     "title": "Current Traffic",
                     "tooltip": {
                       "msResolution": false,
                       "query_as_alias": true,
                       "shared": true,
                       "sort": 0,
                       "value_type": "cumulative"
                     },
                     "type": "graph",
                     "xaxis": {
                       "buckets": null,
                       "mode": "time",
                       "name": null,
                       "show": true,
                       "values": []
                     },
                     "yaxes": [
                       {
                         "format": "decbytes",
                         "logBase": 1,
                         "max": null,
                         "min": 0,
                         "show": true
                       },
                       {
                         "format": "short",
                         "logBase": 1,
                         "max": null,
                         "min": null,
                         "show": true
                       }
                     ],
                     "yaxis": {
                       "align": false,
                       "alignLevel": null
                     },
                     "zerofill": true
                   },
                   {
                     "columns": [],
                     "datasource": "${DS_INFLUXDB-COLLECTD}",
                     "fontSize": "100%",
                     "gridPos": {
                       "h": 6,
                       "w": 10,
                       "x": 0,
                       "y": 12
                     },
                     "id": 14,
                     "links": [],
                     "pageSize": null,
                     "scroll": true,
                     "showHeader": true,
                     "sort": {
                       "col": 0,
                       "desc": true
                     },
                     "styles": [
                       {
                         "alias": "Time",
                         "dateFormat": "MMMM D, YYYY LT",
                         "pattern": "Time",
                         "type": "date"
                       },
                       {
                         "alias": "",
                         "colorMode": null,
                         "colors": [
                           "rgba(245, 54, 54, 0.9)",
                           "rgba(237, 129, 40, 0.89)",
                           "rgba(50, 172, 45, 0.97)"
                         ],
                         "decimals": 2,
                         "pattern": "/.*/",
                         "thresholds": [],
                         "type": "number",
                         "unit": "decbytes"
                       }
                     ],
                     "targets": [
                       {
                         "alias": "Download",
                         "dsType": "influxdb",
                         "groupBy": [
                           {
                             "params": [
                               "1d"
                             ],
                             "type": "time"
                           }
                         ],
                         "measurement": "fritzbox_value",
                         "orderByTime": "ASC",
                         "policy": "default",
                         "query": "SELECT non_negative_difference(last(cumulative_sum))FROM (\nSELECT cumulative_sum(non_negative_difference(last(\"value\"))) FROM \"upnp.0.WANDevice_-_FRITZ!Box_7490.WANDevice.WANCommonInterfaceConfig.TotalBytesReceived\" WHERE $timeFilter GROUP BY time($__interval)\n) WHERE $timeFilter GROUP BY time(1d) tz('Europe/Berlin')",
                         "rawQuery": true,
                         "refId": "A",
                         "resultFormat": "time_series",
                         "select": [
                           [
                             {
                               "params": [
                                 "value"
                               ],
                               "type": "field"
                             },
                             {
                               "params": [],
                               "type": "max"
                             },
                             {
                               "params": [
                                 "10s"
                               ],
                               "type": "non_negative_derivative"
                             }
                           ]
                         ],
                         "tags": [
                           {
                             "key": "type_instance",
                             "operator": "=",
                             "value": "totalbytesreceived"
                           }
                         ],
                         "target": ""
                       },
                       {
                         "alias": "Upload",
                         "dsType": "influxdb",
                         "groupBy": [
                           {
                             "params": [
                               "1d"
                             ],
                             "type": "time"
                           }
                         ],
                         "hide": false,
                         "measurement": "fritzbox_value",
                         "orderByTime": "ASC",
                         "policy": "default",
                         "query": "SELECT non_negative_difference(last(cumulative_sum))FROM (\nSELECT cumulative_sum(non_negative_difference(last(\"value\"))) FROM \"upnp.0.WANDevice_-_FRITZ!Box_7490.WANDevice.WANCommonInterfaceConfig.TotalBytesSent\" WHERE $timeFilter GROUP BY time($__interval)\n) WHERE $timeFilter GROUP BY time(1d) tz('Europe/Berlin')",
                         "rawQuery": true,
                         "refId": "B",
                         "resultFormat": "time_series",
                         "select": [
                           [
                             {
                               "params": [
                                 "value"
                               ],
                               "type": "field"
                             },
                             {
                               "params": [],
                               "type": "max"
                             },
                             {
                               "params": [
                                 "10s"
                               ],
                               "type": "non_negative_derivative"
                             }
                           ]
                         ],
                         "tags": [
                           {
                             "key": "type_instance",
                             "operator": "=",
                             "value": "totalbytesreceived"
                           }
                         ],
                         "target": ""
                       }
                     ],
                     "title": "Daily Traffic",
                     "transform": "timeseries_to_columns",
                     "type": "table"
                   },
                   {
                     "aliasColors": {
                       "downstream": "#1F78C1",
                       "downstream max": "#0A437C",
                       "upstream": "#EA6460",
                       "upstream max": "#890F02"
                     },
                     "annotate": {
                       "enable": false
                     },
                     "bars": false,
                     "dashLength": 10,
                     "dashes": false,
                     "datasource": "${DS_INFLUXDB-COLLECTD}",
                     "editable": true,
                     "fill": 1,
                     "grid": {},
                     "gridPos": {
                       "h": 6,
                       "w": 10,
                       "x": 10,
                       "y": 12
                     },
                     "id": 18,
                     "interval": "10s",
                     "legend": {
                       "avg": false,
                       "current": true,
                       "max": false,
                       "min": false,
                       "show": true,
                       "total": false,
                       "values": true
                     },
                     "lines": true,
                     "linewidth": 1,
                     "links": [],
                     "nullPointMode": "connected",
                     "percentage": false,
                     "pointradius": 5,
                     "points": false,
                     "renderer": "flot",
                     "resolution": 100,
                     "scale": 1,
                     "seriesOverrides": [],
                     "spaceLength": 10,
                     "stack": false,
                     "steppedLine": false,
                     "targets": [
                       {
                         "alias": "downstream",
                         "dsType": "influxdb",
                         "fields": [
                           {
                             "func": "mean",
                             "name": "value"
                           }
                         ],
                         "groupBy": [
                           {
                             "params": [
                               "$__interval"
                             ],
                             "type": "time"
                           },
                           {
                             "params": [
                               "null"
                             ],
                             "type": "fill"
                           }
                         ],
                         "groupByTags": [],
                         "hide": false,
                         "measurement": "upnp.0.WANDevice_-_FRITZ!Box_7490.WANDevice.WANCommonInterfaceConfig.ByteReceiveRate",
                         "orderByTime": "ASC",
                         "policy": "default",
                         "query": "SELECT mean(value) FROM \"fritzbox_value\" WHERE \"type_instance\" = 'receiverate' AND $timeFilter GROUP BY time($interval)",
                         "refId": "A",
                         "resultFormat": "time_series",
                         "select": [
                           [
                             {
                               "params": [
                                 "value"
                               ],
                               "type": "field"
                             },
                             {
                               "params": [],
                               "type": "mean"
                             },
                             {
                               "params": [
                                 " / 0.125"
                               ],
                               "type": "math"
                             }
                           ]
                         ],
                         "tags": [],
                         "target": "alias(collectd.squirrel.fritzbox.bitrate-receiverate,'downstream')"
                       },
                       {
                         "alias": "downstream max",
                         "dsType": "influxdb",
                         "fields": [
                           {
                             "func": "mean",
                             "name": "value"
                           }
                         ],
                         "groupBy": [
                           {
                             "params": [
                               "$__interval"
                             ],
                             "type": "time"
                           },
                           {
                             "params": [
                               "null"
                             ],
                             "type": "fill"
                           }
                         ],
                         "groupByTags": [],
                         "hide": false,
                         "measurement": "upnp.0.WANDevice_-_FRITZ!Box_7490.WANDevice.WANCommonInterfaceConfig.Layer1DownstreamMaxBitRate",
                         "orderByTime": "ASC",
                         "policy": "default",
                         "query": "SELECT mean(value) FROM \"fritzbox_value\" WHERE \"type_instance\" = 'downstreammax' AND $timeFilter GROUP BY time($interval)",
                         "refId": "B",
                         "resultFormat": "time_series",
                         "select": [
                           [
                             {
                               "params": [
                                 "value"
                               ],
                               "type": "field"
                             },
                             {
                               "params": [],
                               "type": "mean"
                             }
                           ]
                         ],
                         "tags": [],
                         "target": "alias(collectd.squirrel.fritzbox.bitrate-downstreammax,'downstream max')"
                       },
                       {
                         "alias": "upstream",
                         "dsType": "influxdb",
                         "fields": [
                           {
                             "func": "mean",
                             "name": "value"
                           }
                         ],
                         "groupBy": [
                           {
                             "params": [
                               "$__interval"
                             ],
                             "type": "time"
                           },
                           {
                             "params": [
                               "null"
                             ],
                             "type": "fill"
                           }
                         ],
                         "groupByTags": [],
                         "hide": false,
                         "measurement": "upnp.0.WANDevice_-_FRITZ!Box_7490.WANDevice.WANCommonInterfaceConfig.ByteSendRate",
                         "orderByTime": "ASC",
                         "policy": "default",
                         "query": "SELECT mean(value) FROM \"fritzbox_value\" WHERE \"type_instance\" = 'sendrate' AND $timeFilter GROUP BY time($interval)",
                         "refId": "C",
                         "resultFormat": "time_series",
                         "select": [
                           [
                             {
                               "params": [
                                 "value"
                               ],
                               "type": "field"
                             },
                             {
                               "params": [],
                               "type": "mean"
                             },
                             {
                               "params": [
                                 " / 0.125"
                               ],
                               "type": "math"
                             }
                           ]
                         ],
                         "tags": [],
                         "target": "alias(collectd.squirrel.fritzbox.bitrate-sendrate,'upstream')"
                       },
                       {
                         "alias": "upstream max",
                         "dsType": "influxdb",
                         "fields": [
                           {
                             "func": "mean",
                             "name": "value"
                           }
                         ],
                         "groupBy": [
                           {
                             "params": [
                               "$__interval"
                             ],
                             "type": "time"
                           },
                           {
                             "params": [
                               "null"
                             ],
                             "type": "fill"
                           }
                         ],
                         "groupByTags": [],
                         "hide": false,
                         "measurement": "upnp.0.WANDevice_-_FRITZ!Box_7490.WANDevice.WANCommonInterfaceConfig.Layer1UpstreamMaxBitRate",
                         "orderByTime": "ASC",
                         "policy": "default",
                         "query": "SELECT mean(value) FROM \"fritzbox_value\" WHERE \"type_instance\" = 'upstreammax' AND $timeFilter GROUP BY time($interval)",
                         "refId": "D",
                         "resultFormat": "time_series",
                         "select": [
                           [
                             {
                               "params": [
                                 "value"
                               ],
                               "type": "field"
                             },
                             {
                               "params": [],
                               "type": "mean"
                             }
                           ]
                         ],
                         "tags": [],
                         "target": "alias(collectd.squirrel.fritzbox.bitrate-upstreammax,'upstream max')"
                       }
                     ],
                     "thresholds": [],
                     "timeFrom": null,
                     "timeRegions": [],
                     "timeShift": null,
                     "title": "Bandwidth",
                     "tooltip": {
                       "msResolution": false,
                       "query_as_alias": true,
                       "shared": true,
                       "sort": 0,
                       "value_type": "cumulative"
                     },
                     "type": "graph",
                     "xaxis": {
                       "buckets": null,
                       "mode": "time",
                       "name": null,
                       "show": true,
                       "values": []
                     },
                     "yaxes": [
                       {
                         "format": "bps",
                         "logBase": 1,
                         "max": null,
                         "min": "0",
                         "show": true
                       },
                       {
                         "format": "short",
                         "logBase": 1,
                         "max": null,
                         "min": null,
                         "show": true
                       }
                     ],
                     "yaxis": {
                       "align": false,
                       "alignLevel": null
                     },
                     "zerofill": true
                   }
                 ],
                 "refresh": "1m",
                 "schemaVersion": 18,
                 "style": "dark",
                 "tags": [],
                 "templating": {
                   "list": []
                 },
                 "time": {
                   "from": "now-7d",
                   "to": "now"
                 },
                 "timepicker": {
                   "refresh_intervals": [
                     "5s",
                     "10s",
                     "30s",
                     "1m",
                     "5m",
                     "15m",
                     "30m",
                     "1h",
                     "2h",
                     "1d"
                   ],
                   "time_options": [
                     "5m",
                     "15m",
                     "1h",
                     "6h",
                     "12h",
                     "24h",
                     "2d",
                     "7d",
                     "30d"
                   ]
                 },
                 "timezone": "",
                 "title": "FRITZ!Box Router Status",
                 "uid": "000000013",
                 "version": 62
                }
                

                umgestiegen von Proxmox auf Unraid

                1 Antwort Letzte Antwort
                0
                • liv-in-skyL Offline
                  liv-in-skyL Offline
                  liv-in-sky
                  schrieb am zuletzt editiert von
                  #117

                  hat jmd. von euch plex media server auf proxmox laufen ?

                  habe einen container erstellt und auch tautulli darauf installiert - es wird ja gerade ein plex adapter gemacht.

                  plex zieht ganz schön an der performance (cpu zeit) - nicht unbedingt beim anschauen selbst sondern beim anlegen und pflegen der mediatheken - habt ihr da ähnliche erfahrung ?

                  nach einem gelösten Thread wäre es sinnvoll dies in der Überschrift des ersten Posts einzutragen [gelöst]-... Bitte benutzt das Voting rechts unten im Beitrag wenn er euch geholfen hat. Forum-Tools: PicPick https://picpick.app/en/download/ und ScreenToGif https://www.screentogif.com/downloads.html

                  1 Antwort Letzte Antwort
                  0
                  • S Offline
                    S Offline
                    schittl
                    schrieb am zuletzt editiert von
                    #118

                    @ilovegym
                    Habe ebenfalls einen Lenovo X230 mit 512 SSD (16GB RAM). Jetzt möchte ich noch per UltraBay + mSATA zwei weitere SSD 256 GB einbinden. Würde es sich da lohnen aus den 3 Platten ein ZFS aufzubauen über 200 GB oder würdest Du das nicht empfehlen bzw zu overload?

                    Geplant sind Container (ioBroker, ioBroker-dev, Docker, piHole, debmatic, chilipie) + 1 VM Win10 als Testsystem... Cluster dann eventuell auch noch...

                    Gruß
                    Falk

                    HW: Lenovo M920q (Proxmox, ioBroker, RaspMatic & Z2M), QNAP (Docker, Influx), Arduino Mega 2560 R3 (I2C DS18B20 + LED)

                    SW: CT IoBroker, VM RaspMatic(v3.79.6.20241122)

                    K 1 Antwort Letzte Antwort
                    0
                    • S schittl

                      @ilovegym
                      Habe ebenfalls einen Lenovo X230 mit 512 SSD (16GB RAM). Jetzt möchte ich noch per UltraBay + mSATA zwei weitere SSD 256 GB einbinden. Würde es sich da lohnen aus den 3 Platten ein ZFS aufzubauen über 200 GB oder würdest Du das nicht empfehlen bzw zu overload?

                      Geplant sind Container (ioBroker, ioBroker-dev, Docker, piHole, debmatic, chilipie) + 1 VM Win10 als Testsystem... Cluster dann eventuell auch noch...

                      Gruß
                      Falk

                      K Offline
                      K Offline
                      karstent
                      schrieb am zuletzt editiert von
                      #119

                      Ubuntu 32 bit 16.04 mit CUPS und einem XEROX Treiber der nur unter 32 bit läuft.

                      Habe es nach langem suchen entlich geschafft meinen schönen aber in die Jahre gekommenen WLAN Farblaser Drucker Dell 1660w Airprint fähig zu machen. Für den Dell Drucker selber gint es keine Linux Treiber und unter Cups schon gar nicht. Allerdings gibt es einen XEROX Treiber der baugleich zum Dell Drucker wunderbar funktioniert. Also VM erstellt, besagte Ubuntu 32 Bit version installiert, Cups, installiert, Druckertreiber nachinstalliert, avahi-discover installiert. IN Cups den Drucker eingerichtet, fertig. Nun kann ich das Druckermenüh des iPhones/ipads nutzen um von den Geräten direkt drucken zu können.
                      Ist zwar ein wenig oversized mit der eigenen VM aber Proxmox läuft eh rund um die Uhr und der Resourcenverbrauch hält sich in Grenzen. :+1:

                      1 Antwort Letzte Antwort
                      0
                      Antworten
                      • In einem neuen Thema antworten
                      Anmelden zum Antworten
                      • Älteste zuerst
                      • Neuste zuerst
                      • Meiste Stimmen


                      Support us

                      ioBroker
                      Community Adapters
                      Donate
                      FAQ Cloud / IOT
                      HowTo: Node.js-Update
                      HowTo: Backup/Restore
                      Downloads
                      BLOG

                      887

                      Online

                      32.4k

                      Benutzer

                      81.5k

                      Themen

                      1.3m

                      Beiträge
                      Community
                      Impressum | Datenschutz-Bestimmungen | Nutzungsbedingungen | Einwilligungseinstellungen
                      ioBroker Community 2014-2025
                      logo
                      • Anmelden

                      • Du hast noch kein Konto? Registrieren

                      • Anmelden oder registrieren, um zu suchen
                      • Erster Beitrag
                        Letzter Beitrag
                      0
                      • Home
                      • Aktuell
                      • Tags
                      • Ungelesen 0
                      • Kategorien
                      • Unreplied
                      • Beliebt
                      • GitHub
                      • Docu
                      • Hilfe