Navigation

    Logo
    • Register
    • Login
    • Search
    • Recent
    • Tags
    • Unread
    • Categories
    • Unreplied
    • Popular
    • GitHub
    • Docu
    • Hilfe
    1. Home
    2. Deutsch
    3. Tester
    4. Test Adapter Material Design Widgets v0.2.x

    NEWS

    • Neuer Blog: Fotos und Eindrücke aus Solingen

    • ioBroker@Smart Living Forum Solingen, 14.06. - Agenda added

    • ioBroker goes Matter ... Matter Adapter in Stable

    Test Adapter Material Design Widgets v0.2.x

    This topic has been deleted. Only users with topic management privileges can see it.
    • Scrounger
      Scrounger Developer @darkiop last edited by Scrounger

      @darkiop
      Nein hab bis jetzt dafür noch keinen UseCase.
      Grundsätzlich kann man wie hier beschrieben vorgehen:
      https://forum.iobroker.net/topic/2344/script-um-sql-auszulesen

      Und Daten muss man danach nur noch richtig formatieren und an den JSON Chart übergeben.
      So mal die Theorie 😉

      Hätte auch den Vorteil ggü. dem Line Chart, dass die ganze Datenaufbereitung serverseitg dann läuft - mhh vielleicht doch grad ein UseCase gefunden 😁

      1 Reply Last reply Reply Quote 0
      • S
        stockics6 last edited by

        Hi,

        ich versuche den "Line History Chart" einzubinden und stoße dabei auf folgendes Probelem:

        • Obwohl beide Datenpunkte meiner Meinung nach richtig angelegt sind, wird mir nur einer angezeigt

        31e7db00-f2c2-4e58-b001-05675b0914a1-grafik.png
        34fe0c92-4a38-41d6-884b-fef867ba4ecf-grafik.png 5ebf8ade-7f7d-4121-b780-2270da7f61bc-grafik.png

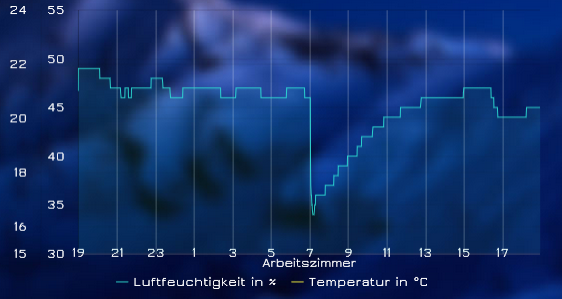
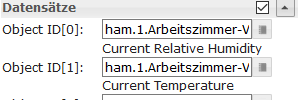
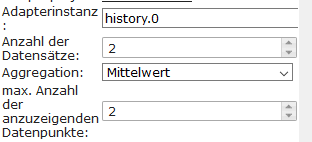
        Hat jemand einen Rat?

        sigi234 1 Reply Last reply Reply Quote 0
        • sigi234
          sigi234 Forum Testing Most Active @stockics6 last edited by

          @stockics6

          Anzahl der Datensätze 1

          0 wird auch mitgezählt!

          S 1 Reply Last reply Reply Quote 0
          • S
            stockics6 @sigi234 last edited by

            @sigi234

            ouh man wie dumm :D, vielen Dank 🙂

            1 Reply Last reply Reply Quote 0
            • C
              Coffeelover last edited by

              Hallo zusammen,
              habe mir ein Bar-Chart erstellt. Leider bekomme ich die Werte bei den größten Datensätzen nicht angezeigt, da sie die Breite des Widgets überschreiten. Gibt es dazu einen Tipp oder ist das ein Bug?
              Es geht um die abgeschnittenen Werte "Gesamt". Ein Überlagern durch andere Widgets kann ausgeschlossen werden.
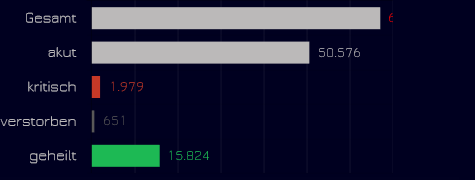
              81865ad2-7134-41ce-9efe-9b38fbff3c56-grafik.png
              VG

              Scrounger 1 Reply Last reply Reply Quote 0
              • Scrounger
                Scrounger Developer @Coffeelover last edited by

                @Coffeelover
                Abstand von rechts anpassen:
                4d3fde49-e0c6-446a-9f05-e7d78e02397d-grafik.png

                1 Reply Last reply Reply Quote 1
                • S
                  sveni_lee last edited by

                  hallo @Scrounger

                  kann man den minimal bzw maximal Wert auch mit gebrochenen Zahlen festlegen?
                  Für dieselpreise würde ich gern min. 0,95 und max 1,30 angeben. Mit ganzen Zahlen lässt es sich grafisch nicht ganz so schön darstellen.

                  Scrounger 1 Reply Last reply Reply Quote 0
                  • Scrounger
                    Scrounger Developer @sveni_lee last edited by

                    @sveni_lee
                    Welches Widget? Wo willst du was eingeben?
                    Sorry aber ich versteh die Frage nicht.

                    S 1 Reply Last reply Reply Quote 0
                    • S
                      sveni_lee @Scrounger last edited by

                      In den History Charts Y-Achsen-Layout für Datensatz(x), kann ich doch einen Wertebereich min und max eingeben aber eben nur ganze Zahlen. Meine Frage ist ob man auch irgendwie gebrochene Zahlen also mit Nachmommastellen angeben kann.

                      Scrounger 1 Reply Last reply Reply Quote 0
                      • Scrounger
                        Scrounger Developer @sveni_lee last edited by

                        @sveni_lee
                        Ne das geht nicht, Bau ich aber ein.
                        Wir in deinem Fall nur bedingt helfen wichtig ist hier die Formatierung der Nachkommastellen. Das gibt's aktuell auch nicht, Werd ich auch noch einbauen.

                        1 Reply Last reply Reply Quote 0
                        • J
                          jerzimeik last edited by

                          Hallo zusammen,

                          kann es sein, dass sowohl im fully-Browser als auch in der iobroker.vis App unter Android die Widgets nicht mit angezeigt werden?

                          Bei mir kommt zumindest nichts.

                          C 1 Reply Last reply Reply Quote 0
                          • C
                            Coffeelover @jerzimeik last edited by

                            @jerzimeik Grundsätzlich werden die Widgets schon im Fully-Browser angezeigt. Hast du darauf geachtet, dass der Z-Index sie nicht in den Hintergrund schiebt?

                            1 Reply Last reply Reply Quote 0
                            • M
                              mrMuppet last edited by

                              Gibt es eigentlich einen Plan, wann diese Widget stable wird? Bluefox will das Nutzung in der vis-App ja erst ermöglichen wenn das Widget stable wird und da warte ich jetzt schon etliche Wochen in denen ich meine neue Visualisierung nicht nutzen kann.

                              Scrounger 1 Reply Last reply Reply Quote 1
                              • M
                                mrMuppet last edited by

                                btw. bei den alten Plugins gibts ein Typo: richtig"deprecated" - bei dir steht an einigen Stellen "decrepated"... siehe "deprecated"

                                1 Reply Last reply Reply Quote 0
                                • Scrounger
                                  Scrounger Developer @mrMuppet last edited by

                                  @mrMuppet sagte in Test Adapter Material Design Widgets v0.2.x:

                                  Gibt es eigentlich einen Plan, wann diese Widget stable wird?

                                  Sobald ich der Meinung bin, das es stable ist, das wird aber sicher noch ein ganze Weile dauern, weil ich noch immer einige Fehler entdecke und features integriere, die mir beim parallelen erstellen meiner VIS auffallen.

                                  Bluefox will das Nutzung in der vis-App ja erst ermöglichen wenn das Widget stable wird und da warte ich jetzt schon etliche Wochen in denen ich meine neue Visualisierung nicht nutzen kann.

                                  Ist bereits in der aktuellen Beta 2.0.0 integriert, siehe
                                  https://github.com/ioBroker/ioBroker.vis.cordova/blob/0a71c6297a529cf0f91960394e385fb63fd406d8/package.json#L77.
                                  Die ist auch shcon im Play Store.

                                  M 1 Reply Last reply Reply Quote 1
                                  • M
                                    mrMuppet @Scrounger last edited by

                                    @Scrounger sagte in Test Adapter Material Design Widgets v0.2.x:

                                    Ist bereits in der aktuellen Beta 2.0.0 integriert, siehe
                                    https://github.com/ioBroker/ioBroker.vis.cordova/blob/0a71c6297a529cf0f91960394e385fb63fd406d8/package.json#L77.
                                    Die ist auch shcon im Play Store.

                                    Super! Vielen Dank. Hatte ich gar nicht mitbekommen.

                                    1 Reply Last reply Reply Quote 0
                                    • Chris Tailor
                                      Chris Tailor @Michi_Pi last edited by Scrounger

                                      Hallo zusammen

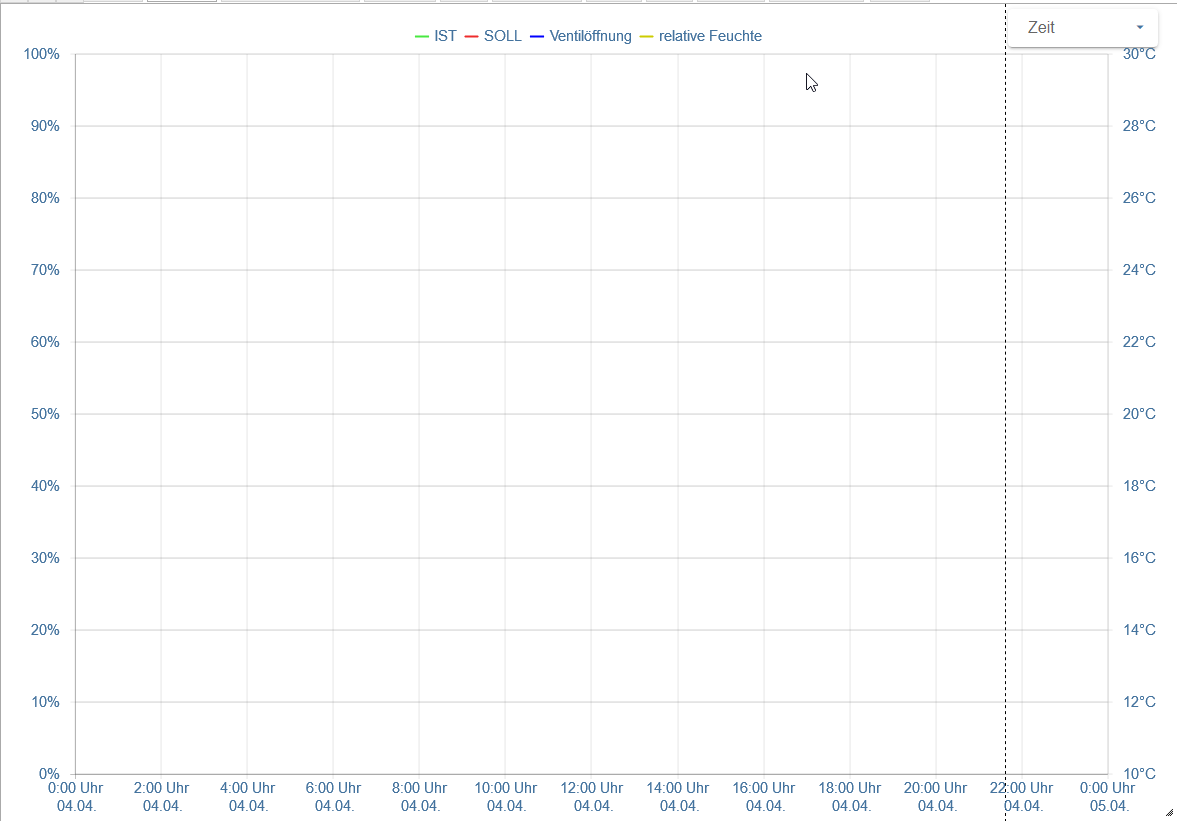
                                      ich versuche Werte meiner Photovoltaik Anlage mittels Line History Charts darzustellen. Leider ist die Darstellung nicht zuverlässig. Einmal werden alle Kennzahlen dargestellt, einmal keine und einmal nur eine der beiden darzustellenden.
                                      Als DB habe ich MariaDB wie auch InfluxDB ausprobiert. Ergebnis ist ist beides mal das gleiche. Von dem her denke ich nicht, dass es mit der DB zusammenhängt.

                                      Im folgenden Video sollten 2 Kennzahlen dargestellt werden.
                                      Video: 2020-04-04_20h42_02.mp4

                                      Hat jemand einen Tipp? Ich denke es hat mit der Datenmenge zu tun. Bei der PV Anlage habe ich ca. jede Sekunde einen neuen Wert. Bei Sysinfo Daten habe ich alle 10 Sekunden einen Wert und bei diesen Mengen habe ich weniger Probleme.

                                      Edit: verschoben, da Frage Widget Fehler betrifft

                                      Scrounger 1 Reply Last reply Reply Quote 0
                                      • Scrounger
                                        Scrounger Developer @Chris Tailor last edited by

                                        @Chris-Tailor, @liv-in-sky, @stockics6, @sigi234, @Coffeelover

                                        Neuer Versuch Eure Fehler mit dem Line Chart Widget zu fixen.

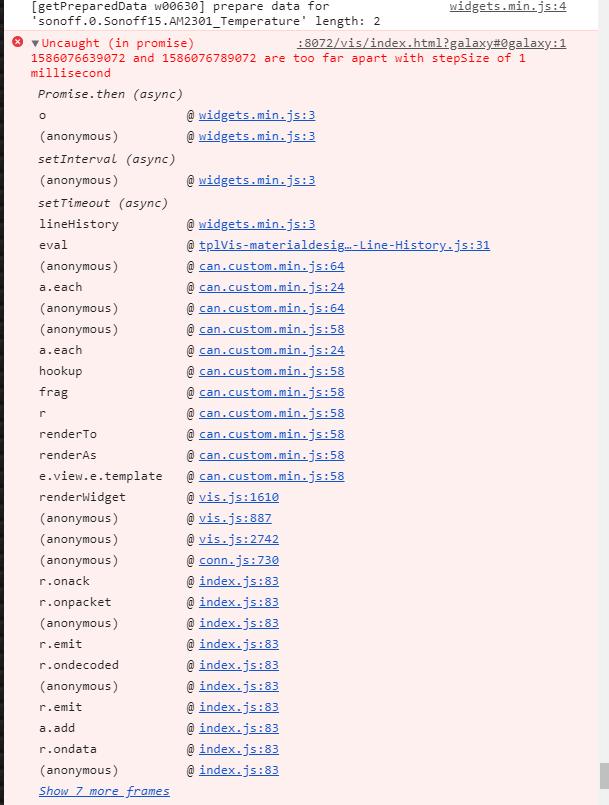
                                        Ich hab jetzt einen Debug Modus für das Line Chart Widget hinzugefügt.

                                        9d5830f8-53a5-485f-a2db-a3c714f872d8-grafik.png

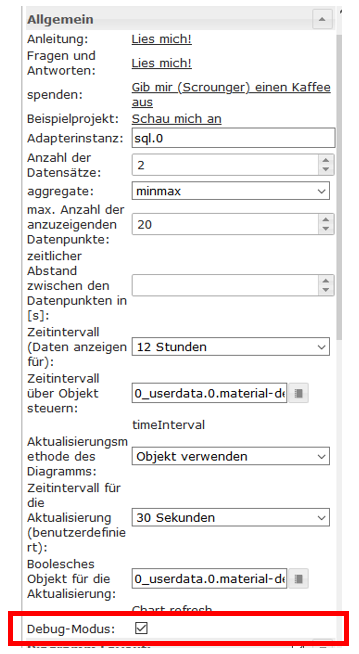
                                        Bitte testet die aktuelle Version von git -> v0.2.77.

                                        Schaltet den Debug Modus an (unter Allgemein) und reproduziert Eure fehler.

                                        Hier dann das vollständige consolen log zur runtime vom browser (F12 -> Reiter 'Console') posten - keine Screenshots!!!!

                                        Ich benötige zwingend die log Infos, weil ich den Fehler bei mir nicht repsoduzieren kann.

                                        liv-in-sky sigi234 Chris Tailor 4 Replies Last reply Reply Quote 0
                                        • liv-in-sky
                                          liv-in-sky @Scrounger last edited by

                                          @Scrounger danke - dachte du hast es übersehen

                                          [Line History Chart w00630] widget setting: {"_data":{"wid":"w00630","g_fixed":false,"g_visibility":false,"g_css_font_text":false,"g_css_background":false,"g_css_shadow_padding":false,"g_css_border":false,"g_gestures":false,"g_signals":false,"g_last_change":false,"visibility-cond":"==","visibility-val":1,"visibility-groups-action":"hide","dataCount":"","aggregate":"average","timeIntervalToShow":"5 minutes","refreshMethod":"timeInterval","refreshTimeInterval":"1 minute","pointStyle":"circle","showLegend":"true","legendPosition":"right","legendPointStyle":"true","showTooltip":"true","tooltipTimeFormats":"{\"millisecond\":\"lll:ss\",\"second\":\"lll:ss\",\"minute\":\"lll\",\"hour\":\"lll\",\"day\":\"lll\",\"week\":\"lll\",\"month\":\"lll\",\"quarter\":\"lll\",\"year\":\"lll\"}","tooltipShowColorBox":"true","lineSpanGaps0":"true","lineSpanGaps1":"true","xAxisPosition":"bottom","xAxisBounds":"dataSet","xAxisTimeFormats":"{\"millisecond\":\"H:mm:ss.SSS\",\"second\":\"H:mm:ss\",\"minute\":\"H:mm\",\"hour\":\"H\",\"day\":\"ddd DD.\",\"week\":\"ll\",\"month\":\"MMM YYYY\",\"quarter\":\"[Q]Q - YYYY\",\"year\":\"YYYY\"}","xAxisValueDistanceToAxis":"0","xAxisShowAxis":"true","xAxisShowAxisLabels":"true","xAxisShowGridLines":"true","xAxisShowTicks":"true","xAxisMinRotation":"0","xAxisMaxRotation":"0","yAxisValueDistanceToAxis":"10","showYAxis0":"true","yAxisPosition0":"left","yAxisShowGridLines0":"true","yAxisShowTicks0":"true","yAxisShowAxisBorder0":"true","showYAxis1":"true","yAxisPosition1":"left","yAxisShowGridLines1":"true","yAxisShowTicks1":"true","yAxisShowAxisBorder1":"true","showValues0":"true","valuesPositionAnchor0":"end","valuesPositionAlign0":"top","valuesTextAlign0":"center","showValues1":"true","valuesPositionAnchor1":"end","valuesPositionAlign1":"top","valuesTextAlign1":"center","signals-cond-0":"==","signals-val-0":true,"signals-icon-0":"/vis/signals/lowbattery.png","signals-icon-size-0":0,"signals-blink-0":false,"signals-horz-0":0,"signals-vert-0":0,"signals-hide-edit-0":false,"signals-cond-1":"==","signals-val-1":true,"signals-icon-1":"/vis/signals/lowbattery.png","signals-icon-size-1":0,"signals-blink-1":false,"signals-horz-1":0,"signals-vert-1":0,"signals-hide-edit-1":false,"signals-cond-2":"==","signals-val-2":true,"signals-icon-2":"/vis/signals/lowbattery.png","signals-icon-size-2":0,"signals-blink-2":false,"signals-horz-2":0,"signals-vert-2":0,"signals-hide-edit-2":false,"lc-type":"last-change","lc-is-interval":true,"lc-is-moment":false,"lc-format":"","lc-position-vert":"top","lc-position-horz":"right","lc-offset-vert":0,"lc-offset-horz":0,"lc-font-size":"12px","lc-font-family":"","lc-font-style":"","lc-bkg-color":"","lc-color":"","lc-border-width":"0","lc-border-style":"","lc-border-color":"","lc-border-radius":10,"lc-zindex":0,"mdwDebug":true,"oid0":"sonoff.0.Sonoff15.AM2301_Temperature","maxDataPoints":"1","lineSpanGaps2":"true","lineSpanGaps3":"true","lineSpanGaps4":"true","lineSpanGaps5":"true","lineSpanGaps6":"true","lineSpanGaps7":"true","lineSpanGaps8":"true","lineSpanGaps9":"true","lineSpanGaps10":"true","showYAxis2":"true","yAxisPosition2":"left","yAxisShowGridLines2":"true","yAxisShowTicks2":"true","yAxisShowAxisBorder2":"true","showYAxis3":"true","yAxisPosition3":"left","yAxisShowGridLines3":"true","yAxisShowTicks3":"true","yAxisShowAxisBorder3":"true","showYAxis4":"true","yAxisPosition4":"left","yAxisShowGridLines4":"true","yAxisShowTicks4":"true","yAxisShowAxisBorder4":"true","showYAxis5":"true","yAxisPosition5":"left","yAxisShowGridLines5":"true","yAxisShowTicks5":"true","yAxisShowAxisBorder5":"true","showYAxis6":"true","yAxisPosition6":"left","yAxisShowGridLines6":"true","yAxisShowTicks6":"true","yAxisShowAxisBorder6":"true","showYAxis7":"true","yAxisPosition7":"left","yAxisShowGridLines7":"true","yAxisShowTicks7":"true","yAxisShowAxisBorder7":"true","showYAxis8":"true","yAxisPosition8":"left","yAxisShowGridLines8":"true","yAxisShowTicks8":"true","yAxisShowAxisBorder8":"true","showYAxis9":"true","yAxisPosition9":"left","yAxisShowGridLines9":"true","yAxisShowTicks9":"true","yAxisShowAxisBorder9":"true","showYAxis10":"true","yAxisPosition10":"left","yAxisShowGridLines10":"true","yAxisShowTicks10":"true","yAxisShowAxisBorder10":"true","showValues2":"true","valuesPositionAnchor2":"end","valuesPositionAlign2":"top","valuesTextAlign2":"center","showValues3":"true","valuesPositionAnchor3":"end","valuesPositionAlign3":"top","valuesTextAlign3":"center","showValues4":"true","valuesPositionAnchor4":"end","valuesPositionAlign4":"top","valuesTextAlign4":"center","showValues5":"true","valuesPositionAnchor5":"end","valuesPositionAlign5":"top","valuesTextAlign5":"center","showValues6":"true","valuesPositionAnchor6":"end","valuesPositionAlign6":"top","valuesTextAlign6":"center","showValues7":"true","valuesPositionAnchor7":"end","valuesPositionAlign7":"top","valuesTextAlign7":"center","showValues8":"true","valuesPositionAnchor8":"end","valuesPositionAlign8":"top","valuesTextAlign8":"center","showValues9":"true","valuesPositionAnchor9":"end","valuesPositionAlign9":"top","valuesTextAlign9":"center","showValues10":"true","valuesPositionAnchor10":"end","valuesPositionAlign10":"top","valuesTextAlign10":"center","historyAdapterInstance":"sql.0"},"_cid":".map5148","_computedAttrs":{},"wid":"w00630","g_fixed":false,"g_visibility":false,"g_css_font_text":false,"g_css_background":false,"g_css_shadow_padding":false,"g_css_border":false,"g_gestures":false,"g_signals":false,"g_last_change":false,"visibility-cond":"==","visibility-val":1,"visibility-groups-action":"hide","dataCount":"","aggregate":"average","timeIntervalToShow":"5 minutes","refreshMethod":"timeInterval","refreshTimeInterval":"1 minute","pointStyle":"circle","showLegend":"true","legendPosition":"right","legendPointStyle":"true","showTooltip":"true","tooltipTimeFormats":"{\"millisecond\":\"lll:ss\",\"second\":\"lll:ss\",\"minute\":\"lll\",\"hour\":\"lll\",\"day\":\"lll\",\"week\":\"lll\",\"month\":\"lll\",\"quarter\":\"lll\",\"year\":\"lll\"}","tooltipShowColorBox":"true","lineSpanGaps0":"true","lineSpanGaps1":"true","xAxisPosition":"bottom","xAxisBounds":"dataSet","xAxisTimeFormats":"{\"millisecond\":\"H:mm:ss.SSS\",\"second\":\"H:mm:ss\",\"minute\":\"H:mm\",\"hour\":\"H\",\"day\":\"ddd DD.\",\"week\":\"ll\",\"month\":\"MMM YYYY\",\"quarter\":\"[Q]Q - YYYY\",\"year\":\"YYYY\"}","xAxisValueDistanceToAxis":"0","xAxisShowAxis":"true","xAxisShowAxisLabels":"true","xAxisShowGridLines":"true","xAxisShowTicks":"true","xAxisMinRotation":"0","xAxisMaxRotation":"0","yAxisValueDistanceToAxis":"10","showYAxis0":"true","yAxisPosition0":"left","yAxisShowGridLines0":"true","yAxisShowTicks0":"true","yAxisShowAxisBorder0":"true","showYAxis1":"true","yAxisPosition1":"left","yAxisShowGridLines1":"true","yAxisShowTicks1":"true","yAxisShowAxisBorder1":"true","showValues0":"true","valuesPositionAnchor0":"end","valuesPositionAlign0":"top","valuesTextAlign0":"center","showValues1":"true","valuesPositionAnchor1":"end","valuesPositionAlign1":"top","valuesTextAlign1":"center","signals-cond-0":"==","signals-val-0":true,"signals-icon-0":"/vis/signals/lowbattery.png","signals-icon-size-0":0,"signals-blink-0":false,"signals-horz-0":0,"signals-vert-0":0,"signals-hide-edit-0":false,"signals-cond-1":"==","signals-val-1":true,"signals-icon-1":"/vis/signals/lowbattery.png","signals-icon-size-1":0,"signals-blink-1":false,"signals-horz-1":0,"signals-vert-1":0,"signals-hide-edit-1":false,"signals-cond-2":"==","signals-val-2":true,"signals-icon-2":"/vis/signals/lowbattery.png","signals-icon-size-2":0,"signals-blink-2":false,"signals-horz-2":0,"signals-vert-2":0,"signals-hide-edit-2":false,"lc-type":"last-change","lc-is-interval":true,"lc-is-moment":false,"lc-format":"","lc-position-vert":"top","lc-position-horz":"right","lc-offset-vert":0,"lc-offset-horz":0,"lc-font-size":"12px","lc-font-family":"","lc-font-style":"","lc-bkg-color":"","lc-color":"","lc-border-width":"0","lc-border-style":"","lc-border-color":"","lc-border-radius":10,"lc-zindex":0,"mdwDebug":true,"oid0":"sonoff.0.Sonoff15.AM2301_Temperature","maxDataPoints":"1","lineSpanGaps2":"true","lineSpanGaps3":"true","lineSpanGaps4":"true","lineSpanGaps5":"true","lineSpanGaps6":"true","lineSpanGaps7":"true","lineSpanGaps8":"true","lineSpanGaps9":"true","lineSpanGaps10":"true","showYAxis2":"true","yAxisPosition2":"left","yAxisShowGridLines2":"true","yAxisShowTicks2":"true","yAxisShowAxisBorder2":"true","showYAxis3":"true","yAxisPosition3":"left","yAxisShowGridLines3":"true","yAxisShowTicks3":"true","yAxisShowAxisBorder3":"true","showYAxis4":"true","yAxisPosition4":"left","yAxisShowGridLines4":"true","yAxisShowTicks4":"true","yAxisShowAxisBorder4":"true","showYAxis5":"true","yAxisPosition5":"left","yAxisShowGridLines5":"true","yAxisShowTicks5":"true","yAxisShowAxisBorder5":"true","showYAxis6":"true","yAxisPosition6":"left","yAxisShowGridLines6":"true","yAxisShowTicks6":"true","yAxisShowAxisBorder6":"true","showYAxis7":"true","yAxisPosition7":"left","yAxisShowGridLines7":"true","yAxisShowTicks7":"true","yAxisShowAxisBorder7":"true","showYAxis8":"true","yAxisPosition8":"left","yAxisShowGridLines8":"true","yAxisShowTicks8":"true","yAxisShowAxisBorder8":"true","showYAxis9":"true","yAxisPosition9":"left","yAxisShowGridLines9":"true","yAxisShowTicks9":"true","yAxisShowAxisBorder9":"true","showYAxis10":"true","yAxisPosition10":"left","yAxisShowGridLines10":"true","yAxisShowTicks10":"true","yAxisShowAxisBorder10":"true","showValues2":"true","valuesPositionAnchor2":"end","valuesPositionAlign2":"top","valuesTextAlign2":"center","showValues3":"true","valuesPositionAnchor3":"end","valuesPositionAlign3":"top","valuesTextAlign3":"center","showValues4":"true","valuesPositionAnchor4":"end","valuesPositionAlign4":"top","valuesTextAlign4":"center","showValues5":"true","valuesPositionAnchor5":"end","valuesPositionAlign5":"top","valuesTextAlign5":"center","showValues6":"true","valuesPositionAnchor6":"end","valuesPositionAlign6":"top","valuesTextAlign6":"center","showValues7":"true","valuesPositionAnchor7":"end","valuesPositionAlign7":"top","valuesTextAlign7":"center","showValues8":"true","valuesPositionAnchor8":"end","valuesPositionAlign8":"top","valuesTextAlign8":"center","showValues9":"true","valuesPositionAnchor9":"end","valuesPositionAlign9":"top","valuesTextAlign9":"center","showValues10":"true","valuesPositionAnchor10":"end","valuesPositionAlign10":"top","valuesTextAlign10":"center","historyAdapterInstance":"sql.0","_bubbleBindings":{},"__bindEvents":{"class":[{"name":"class"}],"backgroundColor":[{"name":"backgroundColor"}],"wid":[{"name":"wid"}]},"_bindings":3}
                                          

                                          Scrounger 1 Reply Last reply Reply Quote 0
                                          • liv-in-sky
                                            liv-in-sky @Scrounger last edited by liv-in-sky

                                            @Scrounger das kam auch noch bzw. kommt immer wieder


                                            Image 1.png

                                            [Line History Chart w00630] ************************************************************** onChange - TimeInterval by Editor **************************************************************
                                            widgets.min.js:4 [getTaskForHistoryData w00630] history data 'sonoff.0.Sonoff15.AM2301_Temperature' length: 2
                                            widgets.min.js:4 [getTaskForHistoryData w00630] history data 'sonoff.0.Sonoff15.AM2301_Temperature': [{"ts":1586076818340,"val":12.265},{"ts":1586076968340,"val":12.33}]
                                            widgets.min.js:3 [Line History Chart w00630] promise all datasets - count: 1
                                            widgets.min.js:4 [getPreparedData w00630] prepare data for 'sonoff.0.Sonoff15.AM2301_Temperature' length: 2
                                            :8072/vis/index.html?galaxy#0galaxy:1 Uncaught (in promise) 1586076818340 and 1586076968340 are too far apart with stepSize of 1 millisecond
                                            Promise.then (async)
                                            o @ widgets.min.js:3
                                            (anonymous) @ widgets.min.js:3
                                            setInterval (async)
                                            (anonymous) @ widgets.min.js:3
                                            setTimeout (async)
                                            lineHistory @ widgets.min.js:3
                                            eval @ tplVis-materialdesign-Chart-Line-History.js:31
                                            (anonymous) @ can.custom.min.js:64
                                            a.each @ can.custom.min.js:24
                                            (anonymous) @ can.custom.min.js:64
                                            (anonymous) @ can.custom.min.js:58
                                            a.each @ can.custom.min.js:24
                                            hookup @ can.custom.min.js:58
                                            frag @ can.custom.min.js:58
                                            r @ can.custom.min.js:58
                                            renderTo @ can.custom.min.js:58
                                            renderAs @ can.custom.min.js:58
                                            e.view.e.template @ can.custom.min.js:58
                                            renderWidget @ vis.js:1610
                                            (anonymous) @ vis.js:887
                                            (anonymous) @ vis.js:2742
                                            (anonymous) @ conn.js:730
                                            r.onack @ index.js:83
                                            r.onpacket @ index.js:83
                                            (anonymous) @ index.js:83
                                            r.emit @ index.js:83
                                            r.ondecoded @ index.js:83
                                            (anonymous) @ index.js:83
                                            r.emit @ index.js:83
                                            a.add @ index.js:83
                                            r.ondata @ index.js:83
                                            (anonymous) @ index.js:83
                                            r.emit @ index.js:83
                                            r.onPacket @ index.js:83
                                            (anonymous) @ index.js:83
                                            r.emit @ index.js:83
                                            r.onPacket @ index.js:83
                                            r.onData @ index.js:83
                                            ws.onmessage @ index.js:83
                                            Show 7 more frames
                                            

                                            undefined:1 GET http://192.168.178.59:8072/vis/undefined 404 (Not Found)
                                            Image (async)
                                            l @ can.custom.min.js:20
                                            e.buildFragment @ can.custom.min.js:20
                                            n.frag @ can.custom.min.js:14
                                            fragment @ can.custom.min.js:58
                                            frag @ can.custom.min.js:58
                                            r @ can.custom.min.js:58
                                            renderTo @ can.custom.min.js:58
                                            renderAs @ can.custom.min.js:58
                                            e.view.e.template @ can.custom.min.js:58
                                            renderWidget @ vis.js:1610
                                            (anonymous) @ vis.js:887
                                            (anonymous) @ vis.js:2742
                                            (anonymous) @ conn.js:730
                                            r.onack @ index.js:83
                                            r.onpacket @ index.js:83
                                            (anonymous) @ index.js:83
                                            r.emit @ index.js:83
                                            r.ondecoded @ index.js:83
                                            (anonymous) @ index.js:83
                                            r.emit @ index.js:83
                                            a.add @ index.js:83
                                            r.ondata @ index.js:83
                                            (anonymous) @ index.js:83
                                            r.emit @ index.js:83
                                            r.onPacket @ index.js:83
                                            (anonymous) @ index.js:83
                                            r.emit @ index.js:83
                                            r.onPacket @ index.js:83
                                            r.onData @ index.js:83
                                            ws.onmessage @ index.js:83
                                            widgets.min.js:4 [getTaskForHistoryData w00630] history data 'sonoff.0.Sonoff15.AM2301_Temperature' length: 2
                                            widgets.min.js:4 [getTaskForHistoryData w00630] history data 'sonoff.0.Sonoff15.AM2301_Temperature': [{"ts":1586076518337,"val":12.124999916666944},{"ts":1586076668338,"val":12.15}]
                                            widgets.min.js:3 [Line History Chart w00630] promise all datasets - count: 1
                                            widgets.min.js:4 [getPreparedData w00630] prepare data for 'sonoff.0.Sonoff15.AM2301_Temperature' length: 2
                                            

                                            1 Reply Last reply Reply Quote 0
                                            • First post
                                              Last post

                                            Support us

                                            ioBroker
                                            Community Adapters
                                            Donate

                                            566
                                            Online

                                            31.8k
                                            Users

                                            80.0k
                                            Topics

                                            1.3m
                                            Posts

                                            adapater material vis visualization widget
                                            77
                                            902
                                            180156
                                            Loading More Posts
                                            • Oldest to Newest
                                            • Newest to Oldest
                                            • Most Votes
                                            Reply
                                            • Reply as topic
                                            Log in to reply
                                            Community
                                            Impressum | Datenschutz-Bestimmungen | Nutzungsbedingungen
                                            The ioBroker Community 2014-2023
                                            logo