

Umzug von Bullseye auf Trixie, Probleme mit Backup
-
Hallo zusammen,
Da mein Senec Adapter nicht mehr funktioniert hat, habe ich mich entschlossen komplett von Bullseye auf Trixie zu emigrieren.
Hierzu habe ich eine neue SD genommen, um auf das alte System bei Probleme etc. zurückzuschwenken.
Die Installation hat (OS lite) hat soweit geklappt, habe auch bereits den Broker, Influx, und Grafana installiert. Bei den Backups einspielen bin ich gerade, genauer gesagt bei Grafana und dies ist auch das erste Backup an dem ich bin. Habe gelesen das man mit diesem anfangen soll, dann Influx und dann den Broker.
Habe von diesem Stand (alles Installiert außer den Backups) auch ein Image gemacht, das wenn etwas ist ich wieder den Stand "Grundzustand" herholen kann. Und glaubt mir ich habe bereits sehr oft diesen Stand wieder hergeholt.
Jetzt zu meinem Problem:
Auf meinem alten System benutze ich Backitup. Dort archiviere den Broker, Influx, Jscript, und natürlich Grafana.
Also ich erstmals über das recovern über Backitup gegangen. Dies hat nicht funktioniert, Es blieb immer im Backitup Statusfenster stehen und es passierte nichts mehr. Mir fiel aber auf das die Backupdatei von Grafana sehr klein ist (32 kB).
Ich habe daraufhin wieder auf mein altes System geswitcht und mal probiert nur von Grafana ein Backup zu erzeugen. Dies war aber nicht möglich da der Button bei Backitup ausgegraut war zum Starten des Backups.
Ich habe dann mal probiert eine Alternative zu suchen (sprich manuell) ein Backup von Grafana zu erstellen.
Hier bin ich auf diesen Beitrag gestoßen:
https://forum.iobroker.net/topic/77920/wie-backup-von-grafana-erstellen/5 (Ab Eintrag #6)
Hier wurde die Grafana.ini und Grafana.db vom alten System ins neue kopiert.
Das habe ich auch versucht. Zuerst hat es über Filezilla nicht geklappt da ich die Rechte nicht hatte die Dateien zu kopieren.
Dazu konnte ich aber auch eine Lösung finden (sudo chmod a+w und sudo chmod r+ ). Jetzt konnte ich beide Dateien kopieren.
Diese habe ich dann in mein neues OS kopiert (Grafana zuvor gestoppt). Grafana neu gestartet. Jetzt hatte ich aber keine Verbindung mehr zum Grafana Server.
Okay weiter unten stand dann auch das der damalige User auch das Problem hatte und die rechte der kopierten Dateien noch angepasst werden musste, diesen Befehl auch ausgeführt (Eintrag #9)
Aber ich komme immer noch nicht drauf. Ich bin mittlerweile am Verzweifeln. Und wie ich die Sache sehe wird dies bei dieser Aktion nicht mein letztes Problem bleiben.
Ich habe mir die Rechte mal angeschaut, aber ja ich weiß nicht ob das passt.Sry für das viele Schreiben
pi@Raspberry:/etc/grafana $ ls -al total 72 drwxr-xr-x 3 root root 4096 Jun 19 13:15 . drwxr-xr-x 103 root root 4096 Jun 19 13:55 .. -rw-r----- 1 grafana grafana 54215 Jun 22 17:50 grafana.ini -rw-r----- 1 root grafana 3137 Jun 19 13:15 ldap.toml drwxr-xr-x 7 root grafana 4096 Jun 19 13:15 provisioning pi@Raspberry:/var/lib/grafana $ ls -l total 5604 drwx------ 2 grafana grafana 4096 Jun 19 13:17 csv -rw-r----- 1 grafana grafana 5713920 Jun 22 17:52 grafana.db drwx------ 2 grafana grafana 4096 Jun 19 13:17 pdf drwxr-x--- 6 grafana grafana 4096 Jun 19 13:17 plugins drwx------ 2 grafana grafana 4096 Jun 19 13:17 png drwxr-x--- 2 grafana grafana 4096 Jun 22 18:07 tmp drwxr-x--- 3 grafana grafana 4096 Jun 19 13:17 unified-search -
Hallo Marc, danke für deine Hilfe!!
Hier der Auszug , hintendran noch den Status des Serverspi@Raspberry:~ $ sudo journalctl -u grafana-server -b --no-pager -n 100 [sudo] password for pi: Jun 22 20:26:46 Raspberry grafana[3524]: logger=sqlstore t=2026-06-22T20:26:46.3 51971252+02:00 level=info msg="Connecting to DB" dbtype=sqlite3 Jun 22 20:26:46 Raspberry grafana[3524]: logger=sqlstore t=2026-06-22T20:26:46.3 52060492+02:00 level=info msg="Using SQLite driver" driver=modernc.org/sqlite Jun 22 20:26:46 Raspberry grafana[3524]: logger=migrator t=2026-06-22T20:26:46.3 59147846+02:00 level=info msg="Locking database" Jun 22 20:26:46 Raspberry grafana[3524]: logger=migrator t=2026-06-22T20:26:46.3 59348214+02:00 level=info msg="Starting DB migrations" Jun 22 20:26:46 Raspberry grafana[3524]: logger=migrator t=2026-06-22T20:26:46.4 49475902+02:00 level=info msg="migrations completed" performed=0 skipped=710 dur ation=6.065145ms Jun 22 20:26:46 Raspberry grafana[3524]: logger=migrator t=2026-06-22T20:26:46.4 51548894+02:00 level=info msg="Unlocking database" Jun 22 20:26:46 Raspberry grafana[3524]: logger=secrets t=2026-06-22T20:26:46.46 9208577+02:00 level=info msg="Envelope encryption state" currentprovider=secretK ey.v1 Jun 22 20:26:47 Raspberry grafana[3524]: logger=plugin.angulardetectorsprovider. dynamic t=2026-06-22T20:26:47.191191397+02:00 level=info msg="Restored cache fro m database" duration=1.006172ms Jun 22 20:26:47 Raspberry grafana[3524]: logger=accesscontrol.service t=2026-06- 22T20:26:47.195657489+02:00 level=info msg="Starting migration to remove depreca ted permissions" migration=removeDeprecatedPermissions Jun 22 20:26:47 Raspberry grafana[3524]: logger=accesscontrol.service t=2026-06- 22T20:26:47.197661001+02:00 level=info msg="Completed migration to remove deprec ated permissions" migration=removeDeprecatedPermissions totalRemoved=0 duration= 2.007549ms Jun 22 20:26:47 Raspberry grafana[3524]: logger=plugin.store t=2026-06-22T20:26: 47.198401233+02:00 level=info msg="Loading plugins..." Jun 22 20:26:48 Raspberry grafana[3524]: logger=plugins.registration t=2026-06-2 2T20:26:48.083529261+02:00 level=info msg="Plugin registered" pluginId=grafana-e xploretraces-app Jun 22 20:26:49 Raspberry grafana[3524]: logger=plugins.registration t=2026-06-2 2T20:26:49.062367314+02:00 level=info msg="Plugin registered" pluginId=grafana-l okiexplore-app Jun 22 20:26:49 Raspberry grafana[3524]: logger=plugins.registration t=2026-06-2 2T20:26:49.458010636+02:00 level=info msg="Plugin registered" pluginId=grafana-m etricsdrilldown-app Jun 22 20:26:49 Raspberry grafana[3524]: logger=plugins.registration t=2026-06-2 2T20:26:49.732818654+02:00 level=info msg="Plugin registered" pluginId=grafana-p yroscope-app Jun 22 20:26:50 Raspberry grafana[3524]: logger=plugins.registration t=2026-06-2 2T20:26:50.738328974+02:00 level=info msg="Plugin registered" pluginId=elasticse arch Jun 22 20:26:50 Raspberry grafana[3524]: logger=plugin.store t=2026-06-22T20:26: 50.738593564+02:00 level=info msg="Plugins loaded" count=56 duration=3.540201257 s Jun 22 20:26:50 Raspberry grafana[3524]: logger=authz-grpc-server t=2026-06-22T2 0:26:50.740000528+02:00 level=info msg="cache ttl is 0, using noop cache" Jun 22 20:26:50 Raspberry grafana[3524]: logger=authz-grpc-server t=2026-06-22T2 0:26:50.740193248+02:00 level=info msg="cache ttl is 0, using noop cache" Jun 22 20:26:50 Raspberry grafana[3524]: logger=authz-grpc-server t=2026-06-22T2 0:26:50.740262081+02:00 level=info msg="cache ttl is 0, using noop cache" Jun 22 20:26:50 Raspberry grafana[3524]: logger=authz-grpc-server t=2026-06-22T2 0:26:50.740317339+02:00 level=info msg="cache ttl is 0, using noop cache" Jun 22 20:26:50 Raspberry grafana[3524]: logger=authz-grpc-server t=2026-06-22T2 0:26:50.740370672+02:00 level=info msg="cache ttl is 0, using noop cache" Jun 22 20:26:50 Raspberry grafana[3524]: logger=secret-migrator t=2026-06-22T20: 26:50.741824062+02:00 level=info msg="Locking database" Jun 22 20:26:50 Raspberry grafana[3524]: logger=secret-migrator t=2026-06-22T20: 26:50.742026893+02:00 level=info msg="Starting DB migrations" Jun 22 20:26:50 Raspberry grafana[3524]: logger=secret-migrator t=2026-06-22T20: 26:50.747116406+02:00 level=info msg="migrations completed" performed=0 skipped= 33 duration=351.792µs Jun 22 20:26:50 Raspberry grafana[3524]: logger=secret-migrator t=2026-06-22T20: 26:50.748894421+02:00 level=info msg="Unlocking database" Jun 22 20:26:50 Raspberry grafana[3524]: logger=resource-db t=2026-06-22T20:26:5 0.752380453+02:00 level=info msg="Using database section" db_type=sqlite3 Jun 22 20:26:50 Raspberry grafana[3524]: logger=resource-db t=2026-06-22T20:26:5 0.752902836+02:00 level=info msg="Initializing Resource DB" db_type=sqlite3 open _conn=0 in_use_conn=0 idle_conn=0 max_open_conn=0 Jun 22 20:26:50 Raspberry grafana[3524]: logger=resource-migrator t=2026-06-22T2 0:26:50.754955015+02:00 level=info msg="Locking database" Jun 22 20:26:50 Raspberry grafana[3524]: logger=resource-migrator t=2026-06-22T2 0:26:50.755143865+02:00 level=info msg="Starting DB migrations" Jun 22 20:26:50 Raspberry grafana[3524]: logger=resource-migrator t=2026-06-22T2 0:26:50.778729711+02:00 level=info msg="migrations completed" performed=0 skippe d=43 duration=421.291µs Jun 22 20:26:50 Raspberry grafana[3524]: logger=resource-migrator t=2026-06-22T2 0:26:50.780440801+02:00 level=info msg="Unlocking database" Jun 22 20:26:50 Raspberry grafana[3524]: t=2026-06-22T20:26:50.798287086+02:00 l evel=info caller=logger.go:214 time=2026-06-22T20:26:50.79821505+02:00 msg="Usin g channel notifier" logger=sql-resource-server Jun 22 20:26:50 Raspberry grafana[3524]: logger=bleve-backend namespace=default group=folder.grafana.app resource=folders size=5 reason=init t=2026-06-22T20:26: 50.805437889+02:00 level=info msg="Building index using memory" Jun 22 20:26:50 Raspberry grafana[3524]: logger=bleve-backend namespace=default group=dashboard.grafana.app resource=dashboards size=14 reason=init t=2026-06-22 T20:26:50.809382342+02:00 level=info msg="Skipping index build, using existing i ndex" Jun 22 20:26:50 Raspberry grafana[3524]: logger=bleve-backend namespace=default group=dashboard.grafana.app resource=dashboards size=14 reason=init t=2026-06-22 T20:26:50.809590913+02:00 level=info msg="Storing index in cache, with no expira tion" key="{Namespace:default Group:dashboard.grafana.app Resource:dashboards}" Jun 22 20:26:50 Raspberry grafana[3524]: logger=bleve-backend namespace=default group=folder.grafana.app resource=folders size=5 reason=init t=2026-06-22T20:26: 50.82751179+02:00 level=info msg="Finished building index" elapsed=21.292114ms l istRV=1782143533874009 Jun 22 20:26:50 Raspberry grafana[3524]: logger=bleve-backend namespace=default group=folder.grafana.app resource=folders size=5 reason=init t=2026-06-22T20:26: 50.827830101+02:00 level=info msg="Storing index in cache" key="{Namespace:defau lt Group:folder.grafana.app Resource:folders}" expiration=2026-06-22T20:36:50.82 7813305+02:00 Jun 22 20:26:50 Raspberry grafana[3524]: logger=resource-search t=2026-06-22T20: 26:50.828205189+02:00 level=info msg="search index initialized" duration_secs=0 total_docs=19 Jun 22 20:26:50 Raspberry grafana[3524]: logger=storage.unified.migrations t=202 6-06-22T20:26:50.84067341+02:00 level=info msg="Running migrations for unified s torage" Jun 22 20:26:50 Raspberry grafana[3524]: logger=storage.unified.migrations t=202 6-06-22T20:26:50.841091497+02:00 level=info msg="Migration is disabled in config , skipping" migration=shorturls Jun 22 20:26:50 Raspberry grafana[3524]: logger=storage.unified.migrations t=202 6-06-22T20:26:50.841197755+02:00 level=info msg="Migration is disabled in config , skipping" migration=datasource Jun 22 20:26:50 Raspberry grafana[3524]: logger=storage.unified.migrations t=202 6-06-22T20:26:50.841267643+02:00 level=info msg="Migration is disabled in config , skipping" migration=stars Jun 22 20:26:50 Raspberry grafana[3524]: logger=unifiedstorage-migrator t=2026-0 6-22T20:26:50.841457067+02:00 level=info msg="Locking database" Jun 22 20:26:50 Raspberry grafana[3524]: logger=unifiedstorage-migrator t=2026-0 6-22T20:26:50.841536029+02:00 level=info msg="Starting DB migrations" Jun 22 20:26:50 Raspberry grafana[3524]: logger=unifiedstorage-migrator t=2026-0 6-22T20:26:50.843344137+02:00 level=info msg="Executing migration" id="playlists migration" Jun 22 20:26:50 Raspberry grafana[3524]: logger=storage.unified.migration_runner .playlists t=2026-06-22T20:26:50.844150016+02:00 level=info msg="Starting migrat ion for all organizations" org_count=1 resources=[playlists.playlist.grafana.app ] Jun 22 20:26:50 Raspberry grafana[3524]: logger=storage.unified.migration_runner .playlists t=2026-06-22T20:26:50.844426642+02:00 level=info msg="Stored migrator transaction in context for bulk operations (SQLite compatibility)" Jun 22 20:26:50 Raspberry grafana[3524]: logger=storage.unified.migration_runner .playlists t=2026-06-22T20:26:50.845750626+02:00 level=info msg="Migrating organ ization" org_id=1 namespace=default Jun 22 20:26:50 Raspberry grafana[3524]: logger=storage.unified.migrator t=2026- 06-22T20:26:50.846186343+02:00 level=info msg="start migrating legacy resources" namespace=default orgId=1 stackId=0 Jun 22 20:26:50 Raspberry grafana[3524]: logger=storage.unified.migration_runner .playlists t=2026-06-22T20:26:50.846339712+02:00 level=info msg="Migration progr ess" org_id=1 count=-1 message="migrating playlists..." Jun 22 20:26:50 Raspberry grafana[3524]: t=2026-06-22T20:26:50.847393088+02:00 l evel=info caller=logger.go:214 time=2026-06-22T20:26:50.847335867+02:00 msg="Usi ng SQLite transaction from client context" logger=sql-resource-server Jun 22 20:26:50 Raspberry grafana[3524]: logger=storage.unified.migrator t=2026- 06-22T20:26:50.864937747+02:00 level=error msg="error migrating legacy resources " error="SQL logic error: no such column: p.created_at (1)" namespace=default Jun 22 20:26:50 Raspberry grafana[3524]: logger=storage.unified.migration_runner .playlists t=2026-06-22T20:26:50.865175485+02:00 level=error msg="Migration fail ed" org_id=1 error="SQL logic error: no such column: p.created_at (1)" duration= 19.279694ms Jun 22 20:26:50 Raspberry grafana[3524]: logger=storage.unified.migration_runner .playlists t=2026-06-22T20:26:50.865318132+02:00 level=warn msg="SQLite migratio n failed, retrying with parquet buffer" error="migration failed for org 1 (defau lt): SQL logic error: no such column: p.created_at (1)" Jun 22 20:26:50 Raspberry grafana[3524]: logger=storage.unified.migration_runner .playlists t=2026-06-22T20:26:50.865415945+02:00 level=info msg="Migrating organ ization" org_id=1 namespace=default Jun 22 20:26:50 Raspberry grafana[3524]: t=2026-06-22T20:26:50.865433908+02:00 l evel=info caller=logger.go:214 time=2026-06-22T20:26:50.865379501+02:00 msg=roll back logger=sql-resource-server Jun 22 20:26:50 Raspberry grafana[3524]: logger=storage.unified.migrator t=2026- 06-22T20:26:50.865683757+02:00 level=info msg="start migrating legacy resources" namespace=default orgId=1 stackId=0 Jun 22 20:26:50 Raspberry grafana[3524]: logger=storage.unified.migration_runner .playlists t=2026-06-22T20:26:50.8658032+02:00 level=info msg="Migration progres s" org_id=1 count=-1 message="migrating playlists..." Jun 22 20:26:50 Raspberry grafana[3524]: logger=storage.unified.migrator t=2026- 06-22T20:26:50.866534247+02:00 level=error msg="error migrating legacy resources " error="SQL logic error: no such column: p.created_at (1)" namespace=default Jun 22 20:26:50 Raspberry grafana[3524]: logger=storage.unified.migration_runner .playlists t=2026-06-22T20:26:50.866718448+02:00 level=error msg="Migration fail ed" org_id=1 error="SQL logic error: no such column: p.created_at (1)" duration= 1.207078ms Jun 22 20:26:50 Raspberry grafana[3524]: logger=unifiedstorage-migrator t=2026-0 6-22T20:26:50.866841039+02:00 level=error msg="Executing migration failed" id="p laylists migration" error="migration failed for org 1 (default): SQL logic error : no such column: p.created_at (1)" duration=23.495532ms Jun 22 20:26:50 Raspberry grafana[3524]: logger=unifiedstorage-migrator t=2026-0 6-22T20:26:50.866923964+02:00 level=error msg="Exec failed" error="migration fai led for org 1 (default): SQL logic error: no such column: p.created_at (1)" sql= "unified storage data migration: playlists" Jun 22 20:26:50 Raspberry grafana[3524]: t=2026-06-22T20:26:50.867710047+02:00 l evel=info caller=logger.go:214 time=2026-06-22T20:26:50.86765653+02:00 msg=close logger=parquet.writer Jun 22 20:26:50 Raspberry grafana[3524]: t=2026-06-22T20:26:50.868361336+02:00 l evel=info caller=logger.go:214 time=2026-06-22T20:26:50.868311577+02:00 msg="usi ng parquet buffer" logger=sql-resource-server path=/var/lib/grafana/tmp/grafana- bulk-export-358923225.parquet processed=0 Jun 22 20:26:50 Raspberry grafana[3524]: logger=unifiedstorage-migrator t=2026-0 6-22T20:26:50.868624388+02:00 level=info msg="Unlocking database" Jun 22 20:26:50 Raspberry grafana[3524]: t=2026-06-22T20:26:50.868941496+02:00 l evel=info caller=logger.go:214 time=2026-06-22T20:26:50.868898644+02:00 msg="Usi ng SQLite transaction from client context" logger=sql-resource-server Jun 22 20:26:50 Raspberry grafana[3524]: t=2026-06-22T20:26:50.869968891+02:00 l evel=info caller=logger.go:214 time=2026-06-22T20:26:50.869871151+02:00 msg=roll back logger=sql-resource-server Jun 22 20:26:50 Raspberry grafana[3524]: Error: ✗ unable to start dualwrite serv ice due to migration error: unified storage data migration failed: migration fai led (id = playlists migration): migration failed for org 1 (default): SQL logic error: no such column: p.created_at (1) Jun 22 20:26:50 Raspberry systemd[1]: grafana-server.service: Main process exite d, code=exited, status=1/FAILURE Jun 22 20:26:50 Raspberry systemd[1]: grafana-server.service: Failed with result 'exit-code'. Jun 22 20:26:50 Raspberry systemd[1]: grafana-server.service: Consumed 6.171s CP U time. Jun 22 20:26:51 Raspberry systemd[1]: grafana-server.service: Scheduled restart job, restart counter is at 96. Jun 22 20:26:51 Raspberry systemd[1]: Started grafana-server.service - Grafana i nstance. Jun 22 20:26:51 Raspberry grafana[3576]: logger=settings t=2026-06-22T20:26:51.9 33312548+02:00 level=info msg="Starting Grafana" version=13.0.2 commit=3fcdbc5a branch=release-13.0.2 compiled=2026-06-02T13:31:14+02:00 Jun 22 20:26:51 Raspberry grafana[3576]: logger=settings t=2026-06-22T20:26:51.9 37753329+02:00 level=info msg="Unified migration configs enforced" storage_type= unified target=[all] Jun 22 20:26:51 Raspberry grafana[3576]: logger=settings t=2026-06-22T20:26:51.9 38013807+02:00 level=info msg="Enforcing mode 5 for resource in unified storage" resource=playlists.playlist.grafana.app Jun 22 20:26:51 Raspberry grafana[3576]: logger=settings t=2026-06-22T20:26:51.9 38089436+02:00 level=info msg="Enforcing mode 5 for resource in unified storage" resource=folders.folder.grafana.app Jun 22 20:26:51 Raspberry grafana[3576]: logger=settings t=2026-06-22T20:26:51.9 3815162+02:00 level=info msg="Enforcing mode 5 for resource in unified storage" resource=dashboards.dashboard.grafana.app Jun 22 20:26:51 Raspberry grafana[3576]: logger=settings t=2026-06-22T20:26:51.9 38828982+02:00 level=info msg="Config loaded from" file=/usr/share/grafana/conf/ defaults.ini Jun 22 20:26:51 Raspberry grafana[3576]: logger=settings t=2026-06-22T20:26:51.9 38910982+02:00 level=info msg="Config loaded from" file=/etc/grafana/grafana.ini Jun 22 20:26:51 Raspberry grafana[3576]: logger=settings t=2026-06-22T20:26:51.9 38971203+02:00 level=info msg="Config overridden from command line" arg="default .paths.data=/var/lib/grafana" Jun 22 20:26:51 Raspberry grafana[3576]: logger=settings t=2026-06-22T20:26:51.9 39029332+02:00 level=info msg="Config overridden from command line" arg="default .paths.logs=/var/log/grafana" Jun 22 20:26:51 Raspberry grafana[3576]: logger=settings t=2026-06-22T20:26:51.9 39085831+02:00 level=info msg="Config overridden from command line" arg="default .paths.plugins=/var/lib/grafana/plugins" Jun 22 20:26:51 Raspberry grafana[3576]: logger=settings t=2026-06-22T20:26:51.9 39142201+02:00 level=info msg="Config overridden from command line" arg="default .paths.provisioning=/etc/grafana/provisioning" Jun 22 20:26:51 Raspberry grafana[3576]: logger=settings t=2026-06-22T20:26:51.9 39199441+02:00 level=info msg=Target target=[all] Jun 22 20:26:51 Raspberry grafana[3576]: logger=settings t=2026-06-22T20:26:51.9 39276588+02:00 level=info msg="Path Home" path=/usr/share/grafana Jun 22 20:26:51 Raspberry grafana[3576]: logger=settings t=2026-06-22T20:26:51.9 39332588+02:00 level=info msg="Path Data" path=/var/lib/grafana Jun 22 20:26:51 Raspberry grafana[3576]: logger=settings t=2026-06-22T20:26:51.9 39387457+02:00 level=info msg="Path Logs" path=/var/log/grafana Jun 22 20:26:51 Raspberry grafana[3576]: logger=settings t=2026-06-22T20:26:51.9 39440623+02:00 level=info msg="Path Plugins" path="[/var/lib/grafana/plugins /us r/share/grafana/data/plugins-bundled]" Jun 22 20:26:51 Raspberry grafana[3576]: logger=settings t=2026-06-22T20:26:51.9 39524196+02:00 level=info msg="Path Provisioning" path=/etc/grafana/provisioning Jun 22 20:26:51 Raspberry grafana[3576]: logger=settings t=2026-06-22T20:26:51.9 39582881+02:00 level=info msg="App mode production" Jun 22 20:26:51 Raspberry grafana[3576]: logger=featuremgmt t=2026-06-22T20:26:5 1.94600986+02:00 level=info msg=FeatureToggles alertRuleRestore=true alertingBul kActionsInUI=true alertingImportYAMLUI=true alertingListViewV2=true alertingList ViewV2PreviewToggle=true alertingMigrationUI=true alertingNavigationV2=true aler tingNotificationsStepMode=true alertingQueryAndExpressionsStepMode=true alerting RulePermanentlyDelete=true alertingRuleRecoverDeleted=true alertingRuleVersionHi storyRestore=true alertingSaveStateCompressed=true alertingUIOptimizeReducer=tru e alertingUIUseBackendFilters=true alertingUIUseFullyCompatBackendFilters=true a lertingUseNewSimplifiedRoutingHashAlgorithm=true annotationPermissionUpdate=true awsAsyncQueryCaching=true awsDatasourcesTempCredentials=true azureMonitorEnable UserAuth=true azureMonitorPrometheusExemplars=true azureResourcePickerUpdates=tr ue cloudWatchCrossAccountQuerying=true cloudWatchNewLabelParsing=true cloudWatch RoundUpEndTime=true dashboardDefaultLayoutSelector=true dashboardNewLayouts=true dashboardScene=true dashgpt=true enableSCIM=true externalVizSuggestions=true fe edbackButton=true grafanaAdvisor=true grafanaAssistantInProfilesDrilldown=true g rafanaconThemes=true improvedExternalSessionHandling=true improvedExternalSessio nHandlingSAML=true influxdbBackendMigration=true logsPanelControls=true lokiLabe lNamesQueryApi=true lokiQuerySplitting=true multiPropsVariables=true newLogsPane l=true newPanelPadding=true newTimeRangeZoomShortcuts=true newUnconfiguredPanel= true newVizSuggestions=true onlyStoreActionSets=true preventPanelChromeOverflow= true prometheusAzureOverrideAudience=true prometheusTypeMigration=true provision ing=true provisioningFolderMetadata=true publicDashboardsScene=true rememberUser OrgForSso=true renderAuthJWT=true restoreDashboards=true restrictedPluginApis=tr ue sharingDashboardImage=true splashScreen=true timeRangePan=true useSessionStor ageForRedirection=true Jun 22 20:26:51 Raspberry grafana[3576]: logger=sqlstore t=2026-06-22T20:26:51.9 46784592+02:00 level=info msg="Connecting to DB" dbtype=sqlite3 Jun 22 20:26:51 Raspberry grafana[3576]: logger=sqlstore t=2026-06-22T20:26:51.9 46866202+02:00 level=info msg="Using SQLite driver" driver=modernc.org/sqlite Jun 22 20:26:51 Raspberry grafana[3576]: logger=migrator t=2026-06-22T20:26:51.9 53974395+02:00 level=info msg="Locking database" Jun 22 20:26:51 Raspberry grafana[3576]: logger=migrator t=2026-06-22T20:26:51.9 54164726+02:00 level=info msg="Starting DB migrations" Jun 22 20:26:52 Raspberry grafana[3576]: logger=migrator t=2026-06-22T20:26:52.0 46677877+02:00 level=info msg="migrations completed" performed=0 skipped=710 dur ation=6.761773ms Jun 22 20:26:52 Raspberry grafana[3576]: logger=migrator t=2026-06-22T20:26:52.0 48510689+02:00 level=info msg="Unlocking database" Jun 22 20:26:52 Raspberry grafana[3576]: logger=secrets t=2026-06-22T20:26:52.06 6287888+02:00 level=info msg="Envelope encryption state" currentprovider=secretK ey.v1 pi@Raspberry:~ $ sudo systemctl status grafana-server ● grafana-server.service - Grafana instance Loaded: loaded (/usr/lib/systemd/system/grafana-server.service; enabled; preset: enabled) Active: active (running) since Mon 2026-06-22 20:28:22 CEST; 1s ago Invocation: c606f28e56934b17b5ca074ef48515b2 Docs: http://docs.grafana.org Main PID: 3893 (grafana) Tasks: 7 (limit: 3967) CPU: 2.280s CGroup: /system.slice/grafana-server.service └─3893 /usr/share/grafana/bin/grafana server --config=/etc/grafana/grafana.ini --pidfile=/run/grafana/grafana-server.pid --packagi> Jun 22 20:28:23 Raspberry grafana[3893]: logger=sqlstore t=2026-06-22T20:28:23.477860385+02:00 level=info msg="Using SQLite driver" driver=mode> Jun 22 20:28:23 Raspberry grafana[3893]: logger=migrator t=2026-06-22T20:28:23.484983859+02:00 level=info msg="Locking database" Jun 22 20:28:23 Raspberry grafana[3893]: logger=migrator t=2026-06-22T20:28:23.485173192+02:00 level=info msg="Starting DB migrations" Jun 22 20:28:23 Raspberry grafana[3893]: logger=migrator t=2026-06-22T20:28:23.577256559+02:00 level=info msg="migrations completed" performed=> Jun 22 20:28:23 Raspberry grafana[3893]: logger=migrator t=2026-06-22T20:28:23.57920652+02:00 level=info msg="Unlocking database" Jun 22 20:28:23 Raspberry grafana[3893]: logger=secrets t=2026-06-22T20:28:23.597211224+02:00 level=info msg="Envelope encryption state" curren> Jun 22 20:28:24 Raspberry grafana[3893]: logger=plugin.angulardetectorsprovider.dynamic t=2026-06-22T20:28:24.32406544+02:00 level=info msg="Re> Jun 22 20:28:24 Raspberry grafana[3893]: logger=accesscontrol.service t=2026-06-22T20:28:24.328700973+02:00 level=info msg="Starting migration > Jun 22 20:28:24 Raspberry grafana[3893]: logger=accesscontrol.service t=2026-06-22T20:28:24.33086373+02:00 level=info msg="Completed migration > Jun 22 20:28:24 Raspberry grafana[3893]: logger=plugin.store t=2026-06-22T20:28:24.331623285+02:00 level=info msg="Loading plugins..." -
Hallo Marc, danke für deine Hilfe!!
Hier der Auszug , hintendran noch den Status des Serverspi@Raspberry:~ $ sudo journalctl -u grafana-server -b --no-pager -n 100 [sudo] password for pi: Jun 22 20:26:46 Raspberry grafana[3524]: logger=sqlstore t=2026-06-22T20:26:46.3 51971252+02:00 level=info msg="Connecting to DB" dbtype=sqlite3 Jun 22 20:26:46 Raspberry grafana[3524]: logger=sqlstore t=2026-06-22T20:26:46.3 52060492+02:00 level=info msg="Using SQLite driver" driver=modernc.org/sqlite Jun 22 20:26:46 Raspberry grafana[3524]: logger=migrator t=2026-06-22T20:26:46.3 59147846+02:00 level=info msg="Locking database" Jun 22 20:26:46 Raspberry grafana[3524]: logger=migrator t=2026-06-22T20:26:46.3 59348214+02:00 level=info msg="Starting DB migrations" Jun 22 20:26:46 Raspberry grafana[3524]: logger=migrator t=2026-06-22T20:26:46.4 49475902+02:00 level=info msg="migrations completed" performed=0 skipped=710 dur ation=6.065145ms Jun 22 20:26:46 Raspberry grafana[3524]: logger=migrator t=2026-06-22T20:26:46.4 51548894+02:00 level=info msg="Unlocking database" Jun 22 20:26:46 Raspberry grafana[3524]: logger=secrets t=2026-06-22T20:26:46.46 9208577+02:00 level=info msg="Envelope encryption state" currentprovider=secretK ey.v1 Jun 22 20:26:47 Raspberry grafana[3524]: logger=plugin.angulardetectorsprovider. dynamic t=2026-06-22T20:26:47.191191397+02:00 level=info msg="Restored cache fro m database" duration=1.006172ms Jun 22 20:26:47 Raspberry grafana[3524]: logger=accesscontrol.service t=2026-06- 22T20:26:47.195657489+02:00 level=info msg="Starting migration to remove depreca ted permissions" migration=removeDeprecatedPermissions Jun 22 20:26:47 Raspberry grafana[3524]: logger=accesscontrol.service t=2026-06- 22T20:26:47.197661001+02:00 level=info msg="Completed migration to remove deprec ated permissions" migration=removeDeprecatedPermissions totalRemoved=0 duration= 2.007549ms Jun 22 20:26:47 Raspberry grafana[3524]: logger=plugin.store t=2026-06-22T20:26: 47.198401233+02:00 level=info msg="Loading plugins..." Jun 22 20:26:48 Raspberry grafana[3524]: logger=plugins.registration t=2026-06-2 2T20:26:48.083529261+02:00 level=info msg="Plugin registered" pluginId=grafana-e xploretraces-app Jun 22 20:26:49 Raspberry grafana[3524]: logger=plugins.registration t=2026-06-2 2T20:26:49.062367314+02:00 level=info msg="Plugin registered" pluginId=grafana-l okiexplore-app Jun 22 20:26:49 Raspberry grafana[3524]: logger=plugins.registration t=2026-06-2 2T20:26:49.458010636+02:00 level=info msg="Plugin registered" pluginId=grafana-m etricsdrilldown-app Jun 22 20:26:49 Raspberry grafana[3524]: logger=plugins.registration t=2026-06-2 2T20:26:49.732818654+02:00 level=info msg="Plugin registered" pluginId=grafana-p yroscope-app Jun 22 20:26:50 Raspberry grafana[3524]: logger=plugins.registration t=2026-06-2 2T20:26:50.738328974+02:00 level=info msg="Plugin registered" pluginId=elasticse arch Jun 22 20:26:50 Raspberry grafana[3524]: logger=plugin.store t=2026-06-22T20:26: 50.738593564+02:00 level=info msg="Plugins loaded" count=56 duration=3.540201257 s Jun 22 20:26:50 Raspberry grafana[3524]: logger=authz-grpc-server t=2026-06-22T2 0:26:50.740000528+02:00 level=info msg="cache ttl is 0, using noop cache" Jun 22 20:26:50 Raspberry grafana[3524]: logger=authz-grpc-server t=2026-06-22T2 0:26:50.740193248+02:00 level=info msg="cache ttl is 0, using noop cache" Jun 22 20:26:50 Raspberry grafana[3524]: logger=authz-grpc-server t=2026-06-22T2 0:26:50.740262081+02:00 level=info msg="cache ttl is 0, using noop cache" Jun 22 20:26:50 Raspberry grafana[3524]: logger=authz-grpc-server t=2026-06-22T2 0:26:50.740317339+02:00 level=info msg="cache ttl is 0, using noop cache" Jun 22 20:26:50 Raspberry grafana[3524]: logger=authz-grpc-server t=2026-06-22T2 0:26:50.740370672+02:00 level=info msg="cache ttl is 0, using noop cache" Jun 22 20:26:50 Raspberry grafana[3524]: logger=secret-migrator t=2026-06-22T20: 26:50.741824062+02:00 level=info msg="Locking database" Jun 22 20:26:50 Raspberry grafana[3524]: logger=secret-migrator t=2026-06-22T20: 26:50.742026893+02:00 level=info msg="Starting DB migrations" Jun 22 20:26:50 Raspberry grafana[3524]: logger=secret-migrator t=2026-06-22T20: 26:50.747116406+02:00 level=info msg="migrations completed" performed=0 skipped= 33 duration=351.792µs Jun 22 20:26:50 Raspberry grafana[3524]: logger=secret-migrator t=2026-06-22T20: 26:50.748894421+02:00 level=info msg="Unlocking database" Jun 22 20:26:50 Raspberry grafana[3524]: logger=resource-db t=2026-06-22T20:26:5 0.752380453+02:00 level=info msg="Using database section" db_type=sqlite3 Jun 22 20:26:50 Raspberry grafana[3524]: logger=resource-db t=2026-06-22T20:26:5 0.752902836+02:00 level=info msg="Initializing Resource DB" db_type=sqlite3 open _conn=0 in_use_conn=0 idle_conn=0 max_open_conn=0 Jun 22 20:26:50 Raspberry grafana[3524]: logger=resource-migrator t=2026-06-22T2 0:26:50.754955015+02:00 level=info msg="Locking database" Jun 22 20:26:50 Raspberry grafana[3524]: logger=resource-migrator t=2026-06-22T2 0:26:50.755143865+02:00 level=info msg="Starting DB migrations" Jun 22 20:26:50 Raspberry grafana[3524]: logger=resource-migrator t=2026-06-22T2 0:26:50.778729711+02:00 level=info msg="migrations completed" performed=0 skippe d=43 duration=421.291µs Jun 22 20:26:50 Raspberry grafana[3524]: logger=resource-migrator t=2026-06-22T2 0:26:50.780440801+02:00 level=info msg="Unlocking database" Jun 22 20:26:50 Raspberry grafana[3524]: t=2026-06-22T20:26:50.798287086+02:00 l evel=info caller=logger.go:214 time=2026-06-22T20:26:50.79821505+02:00 msg="Usin g channel notifier" logger=sql-resource-server Jun 22 20:26:50 Raspberry grafana[3524]: logger=bleve-backend namespace=default group=folder.grafana.app resource=folders size=5 reason=init t=2026-06-22T20:26: 50.805437889+02:00 level=info msg="Building index using memory" Jun 22 20:26:50 Raspberry grafana[3524]: logger=bleve-backend namespace=default group=dashboard.grafana.app resource=dashboards size=14 reason=init t=2026-06-22 T20:26:50.809382342+02:00 level=info msg="Skipping index build, using existing i ndex" Jun 22 20:26:50 Raspberry grafana[3524]: logger=bleve-backend namespace=default group=dashboard.grafana.app resource=dashboards size=14 reason=init t=2026-06-22 T20:26:50.809590913+02:00 level=info msg="Storing index in cache, with no expira tion" key="{Namespace:default Group:dashboard.grafana.app Resource:dashboards}" Jun 22 20:26:50 Raspberry grafana[3524]: logger=bleve-backend namespace=default group=folder.grafana.app resource=folders size=5 reason=init t=2026-06-22T20:26: 50.82751179+02:00 level=info msg="Finished building index" elapsed=21.292114ms l istRV=1782143533874009 Jun 22 20:26:50 Raspberry grafana[3524]: logger=bleve-backend namespace=default group=folder.grafana.app resource=folders size=5 reason=init t=2026-06-22T20:26: 50.827830101+02:00 level=info msg="Storing index in cache" key="{Namespace:defau lt Group:folder.grafana.app Resource:folders}" expiration=2026-06-22T20:36:50.82 7813305+02:00 Jun 22 20:26:50 Raspberry grafana[3524]: logger=resource-search t=2026-06-22T20: 26:50.828205189+02:00 level=info msg="search index initialized" duration_secs=0 total_docs=19 Jun 22 20:26:50 Raspberry grafana[3524]: logger=storage.unified.migrations t=202 6-06-22T20:26:50.84067341+02:00 level=info msg="Running migrations for unified s torage" Jun 22 20:26:50 Raspberry grafana[3524]: logger=storage.unified.migrations t=202 6-06-22T20:26:50.841091497+02:00 level=info msg="Migration is disabled in config , skipping" migration=shorturls Jun 22 20:26:50 Raspberry grafana[3524]: logger=storage.unified.migrations t=202 6-06-22T20:26:50.841197755+02:00 level=info msg="Migration is disabled in config , skipping" migration=datasource Jun 22 20:26:50 Raspberry grafana[3524]: logger=storage.unified.migrations t=202 6-06-22T20:26:50.841267643+02:00 level=info msg="Migration is disabled in config , skipping" migration=stars Jun 22 20:26:50 Raspberry grafana[3524]: logger=unifiedstorage-migrator t=2026-0 6-22T20:26:50.841457067+02:00 level=info msg="Locking database" Jun 22 20:26:50 Raspberry grafana[3524]: logger=unifiedstorage-migrator t=2026-0 6-22T20:26:50.841536029+02:00 level=info msg="Starting DB migrations" Jun 22 20:26:50 Raspberry grafana[3524]: logger=unifiedstorage-migrator t=2026-0 6-22T20:26:50.843344137+02:00 level=info msg="Executing migration" id="playlists migration" Jun 22 20:26:50 Raspberry grafana[3524]: logger=storage.unified.migration_runner .playlists t=2026-06-22T20:26:50.844150016+02:00 level=info msg="Starting migrat ion for all organizations" org_count=1 resources=[playlists.playlist.grafana.app ] Jun 22 20:26:50 Raspberry grafana[3524]: logger=storage.unified.migration_runner .playlists t=2026-06-22T20:26:50.844426642+02:00 level=info msg="Stored migrator transaction in context for bulk operations (SQLite compatibility)" Jun 22 20:26:50 Raspberry grafana[3524]: logger=storage.unified.migration_runner .playlists t=2026-06-22T20:26:50.845750626+02:00 level=info msg="Migrating organ ization" org_id=1 namespace=default Jun 22 20:26:50 Raspberry grafana[3524]: logger=storage.unified.migrator t=2026- 06-22T20:26:50.846186343+02:00 level=info msg="start migrating legacy resources" namespace=default orgId=1 stackId=0 Jun 22 20:26:50 Raspberry grafana[3524]: logger=storage.unified.migration_runner .playlists t=2026-06-22T20:26:50.846339712+02:00 level=info msg="Migration progr ess" org_id=1 count=-1 message="migrating playlists..." Jun 22 20:26:50 Raspberry grafana[3524]: t=2026-06-22T20:26:50.847393088+02:00 l evel=info caller=logger.go:214 time=2026-06-22T20:26:50.847335867+02:00 msg="Usi ng SQLite transaction from client context" logger=sql-resource-server Jun 22 20:26:50 Raspberry grafana[3524]: logger=storage.unified.migrator t=2026- 06-22T20:26:50.864937747+02:00 level=error msg="error migrating legacy resources " error="SQL logic error: no such column: p.created_at (1)" namespace=default Jun 22 20:26:50 Raspberry grafana[3524]: logger=storage.unified.migration_runner .playlists t=2026-06-22T20:26:50.865175485+02:00 level=error msg="Migration fail ed" org_id=1 error="SQL logic error: no such column: p.created_at (1)" duration= 19.279694ms Jun 22 20:26:50 Raspberry grafana[3524]: logger=storage.unified.migration_runner .playlists t=2026-06-22T20:26:50.865318132+02:00 level=warn msg="SQLite migratio n failed, retrying with parquet buffer" error="migration failed for org 1 (defau lt): SQL logic error: no such column: p.created_at (1)" Jun 22 20:26:50 Raspberry grafana[3524]: logger=storage.unified.migration_runner .playlists t=2026-06-22T20:26:50.865415945+02:00 level=info msg="Migrating organ ization" org_id=1 namespace=default Jun 22 20:26:50 Raspberry grafana[3524]: t=2026-06-22T20:26:50.865433908+02:00 l evel=info caller=logger.go:214 time=2026-06-22T20:26:50.865379501+02:00 msg=roll back logger=sql-resource-server Jun 22 20:26:50 Raspberry grafana[3524]: logger=storage.unified.migrator t=2026- 06-22T20:26:50.865683757+02:00 level=info msg="start migrating legacy resources" namespace=default orgId=1 stackId=0 Jun 22 20:26:50 Raspberry grafana[3524]: logger=storage.unified.migration_runner .playlists t=2026-06-22T20:26:50.8658032+02:00 level=info msg="Migration progres s" org_id=1 count=-1 message="migrating playlists..." Jun 22 20:26:50 Raspberry grafana[3524]: logger=storage.unified.migrator t=2026- 06-22T20:26:50.866534247+02:00 level=error msg="error migrating legacy resources " error="SQL logic error: no such column: p.created_at (1)" namespace=default Jun 22 20:26:50 Raspberry grafana[3524]: logger=storage.unified.migration_runner .playlists t=2026-06-22T20:26:50.866718448+02:00 level=error msg="Migration fail ed" org_id=1 error="SQL logic error: no such column: p.created_at (1)" duration= 1.207078ms Jun 22 20:26:50 Raspberry grafana[3524]: logger=unifiedstorage-migrator t=2026-0 6-22T20:26:50.866841039+02:00 level=error msg="Executing migration failed" id="p laylists migration" error="migration failed for org 1 (default): SQL logic error : no such column: p.created_at (1)" duration=23.495532ms Jun 22 20:26:50 Raspberry grafana[3524]: logger=unifiedstorage-migrator t=2026-0 6-22T20:26:50.866923964+02:00 level=error msg="Exec failed" error="migration fai led for org 1 (default): SQL logic error: no such column: p.created_at (1)" sql= "unified storage data migration: playlists" Jun 22 20:26:50 Raspberry grafana[3524]: t=2026-06-22T20:26:50.867710047+02:00 l evel=info caller=logger.go:214 time=2026-06-22T20:26:50.86765653+02:00 msg=close logger=parquet.writer Jun 22 20:26:50 Raspberry grafana[3524]: t=2026-06-22T20:26:50.868361336+02:00 l evel=info caller=logger.go:214 time=2026-06-22T20:26:50.868311577+02:00 msg="usi ng parquet buffer" logger=sql-resource-server path=/var/lib/grafana/tmp/grafana- bulk-export-358923225.parquet processed=0 Jun 22 20:26:50 Raspberry grafana[3524]: logger=unifiedstorage-migrator t=2026-0 6-22T20:26:50.868624388+02:00 level=info msg="Unlocking database" Jun 22 20:26:50 Raspberry grafana[3524]: t=2026-06-22T20:26:50.868941496+02:00 l evel=info caller=logger.go:214 time=2026-06-22T20:26:50.868898644+02:00 msg="Usi ng SQLite transaction from client context" logger=sql-resource-server Jun 22 20:26:50 Raspberry grafana[3524]: t=2026-06-22T20:26:50.869968891+02:00 l evel=info caller=logger.go:214 time=2026-06-22T20:26:50.869871151+02:00 msg=roll back logger=sql-resource-server Jun 22 20:26:50 Raspberry grafana[3524]: Error: ✗ unable to start dualwrite serv ice due to migration error: unified storage data migration failed: migration fai led (id = playlists migration): migration failed for org 1 (default): SQL logic error: no such column: p.created_at (1) Jun 22 20:26:50 Raspberry systemd[1]: grafana-server.service: Main process exite d, code=exited, status=1/FAILURE Jun 22 20:26:50 Raspberry systemd[1]: grafana-server.service: Failed with result 'exit-code'. Jun 22 20:26:50 Raspberry systemd[1]: grafana-server.service: Consumed 6.171s CP U time. Jun 22 20:26:51 Raspberry systemd[1]: grafana-server.service: Scheduled restart job, restart counter is at 96. Jun 22 20:26:51 Raspberry systemd[1]: Started grafana-server.service - Grafana i nstance. Jun 22 20:26:51 Raspberry grafana[3576]: logger=settings t=2026-06-22T20:26:51.9 33312548+02:00 level=info msg="Starting Grafana" version=13.0.2 commit=3fcdbc5a branch=release-13.0.2 compiled=2026-06-02T13:31:14+02:00 Jun 22 20:26:51 Raspberry grafana[3576]: logger=settings t=2026-06-22T20:26:51.9 37753329+02:00 level=info msg="Unified migration configs enforced" storage_type= unified target=[all] Jun 22 20:26:51 Raspberry grafana[3576]: logger=settings t=2026-06-22T20:26:51.9 38013807+02:00 level=info msg="Enforcing mode 5 for resource in unified storage" resource=playlists.playlist.grafana.app Jun 22 20:26:51 Raspberry grafana[3576]: logger=settings t=2026-06-22T20:26:51.9 38089436+02:00 level=info msg="Enforcing mode 5 for resource in unified storage" resource=folders.folder.grafana.app Jun 22 20:26:51 Raspberry grafana[3576]: logger=settings t=2026-06-22T20:26:51.9 3815162+02:00 level=info msg="Enforcing mode 5 for resource in unified storage" resource=dashboards.dashboard.grafana.app Jun 22 20:26:51 Raspberry grafana[3576]: logger=settings t=2026-06-22T20:26:51.9 38828982+02:00 level=info msg="Config loaded from" file=/usr/share/grafana/conf/ defaults.ini Jun 22 20:26:51 Raspberry grafana[3576]: logger=settings t=2026-06-22T20:26:51.9 38910982+02:00 level=info msg="Config loaded from" file=/etc/grafana/grafana.ini Jun 22 20:26:51 Raspberry grafana[3576]: logger=settings t=2026-06-22T20:26:51.9 38971203+02:00 level=info msg="Config overridden from command line" arg="default .paths.data=/var/lib/grafana" Jun 22 20:26:51 Raspberry grafana[3576]: logger=settings t=2026-06-22T20:26:51.9 39029332+02:00 level=info msg="Config overridden from command line" arg="default .paths.logs=/var/log/grafana" Jun 22 20:26:51 Raspberry grafana[3576]: logger=settings t=2026-06-22T20:26:51.9 39085831+02:00 level=info msg="Config overridden from command line" arg="default .paths.plugins=/var/lib/grafana/plugins" Jun 22 20:26:51 Raspberry grafana[3576]: logger=settings t=2026-06-22T20:26:51.9 39142201+02:00 level=info msg="Config overridden from command line" arg="default .paths.provisioning=/etc/grafana/provisioning" Jun 22 20:26:51 Raspberry grafana[3576]: logger=settings t=2026-06-22T20:26:51.9 39199441+02:00 level=info msg=Target target=[all] Jun 22 20:26:51 Raspberry grafana[3576]: logger=settings t=2026-06-22T20:26:51.9 39276588+02:00 level=info msg="Path Home" path=/usr/share/grafana Jun 22 20:26:51 Raspberry grafana[3576]: logger=settings t=2026-06-22T20:26:51.9 39332588+02:00 level=info msg="Path Data" path=/var/lib/grafana Jun 22 20:26:51 Raspberry grafana[3576]: logger=settings t=2026-06-22T20:26:51.9 39387457+02:00 level=info msg="Path Logs" path=/var/log/grafana Jun 22 20:26:51 Raspberry grafana[3576]: logger=settings t=2026-06-22T20:26:51.9 39440623+02:00 level=info msg="Path Plugins" path="[/var/lib/grafana/plugins /us r/share/grafana/data/plugins-bundled]" Jun 22 20:26:51 Raspberry grafana[3576]: logger=settings t=2026-06-22T20:26:51.9 39524196+02:00 level=info msg="Path Provisioning" path=/etc/grafana/provisioning Jun 22 20:26:51 Raspberry grafana[3576]: logger=settings t=2026-06-22T20:26:51.9 39582881+02:00 level=info msg="App mode production" Jun 22 20:26:51 Raspberry grafana[3576]: logger=featuremgmt t=2026-06-22T20:26:5 1.94600986+02:00 level=info msg=FeatureToggles alertRuleRestore=true alertingBul kActionsInUI=true alertingImportYAMLUI=true alertingListViewV2=true alertingList ViewV2PreviewToggle=true alertingMigrationUI=true alertingNavigationV2=true aler tingNotificationsStepMode=true alertingQueryAndExpressionsStepMode=true alerting RulePermanentlyDelete=true alertingRuleRecoverDeleted=true alertingRuleVersionHi storyRestore=true alertingSaveStateCompressed=true alertingUIOptimizeReducer=tru e alertingUIUseBackendFilters=true alertingUIUseFullyCompatBackendFilters=true a lertingUseNewSimplifiedRoutingHashAlgorithm=true annotationPermissionUpdate=true awsAsyncQueryCaching=true awsDatasourcesTempCredentials=true azureMonitorEnable UserAuth=true azureMonitorPrometheusExemplars=true azureResourcePickerUpdates=tr ue cloudWatchCrossAccountQuerying=true cloudWatchNewLabelParsing=true cloudWatch RoundUpEndTime=true dashboardDefaultLayoutSelector=true dashboardNewLayouts=true dashboardScene=true dashgpt=true enableSCIM=true externalVizSuggestions=true fe edbackButton=true grafanaAdvisor=true grafanaAssistantInProfilesDrilldown=true g rafanaconThemes=true improvedExternalSessionHandling=true improvedExternalSessio nHandlingSAML=true influxdbBackendMigration=true logsPanelControls=true lokiLabe lNamesQueryApi=true lokiQuerySplitting=true multiPropsVariables=true newLogsPane l=true newPanelPadding=true newTimeRangeZoomShortcuts=true newUnconfiguredPanel= true newVizSuggestions=true onlyStoreActionSets=true preventPanelChromeOverflow= true prometheusAzureOverrideAudience=true prometheusTypeMigration=true provision ing=true provisioningFolderMetadata=true publicDashboardsScene=true rememberUser OrgForSso=true renderAuthJWT=true restoreDashboards=true restrictedPluginApis=tr ue sharingDashboardImage=true splashScreen=true timeRangePan=true useSessionStor ageForRedirection=true Jun 22 20:26:51 Raspberry grafana[3576]: logger=sqlstore t=2026-06-22T20:26:51.9 46784592+02:00 level=info msg="Connecting to DB" dbtype=sqlite3 Jun 22 20:26:51 Raspberry grafana[3576]: logger=sqlstore t=2026-06-22T20:26:51.9 46866202+02:00 level=info msg="Using SQLite driver" driver=modernc.org/sqlite Jun 22 20:26:51 Raspberry grafana[3576]: logger=migrator t=2026-06-22T20:26:51.9 53974395+02:00 level=info msg="Locking database" Jun 22 20:26:51 Raspberry grafana[3576]: logger=migrator t=2026-06-22T20:26:51.9 54164726+02:00 level=info msg="Starting DB migrations" Jun 22 20:26:52 Raspberry grafana[3576]: logger=migrator t=2026-06-22T20:26:52.0 46677877+02:00 level=info msg="migrations completed" performed=0 skipped=710 dur ation=6.761773ms Jun 22 20:26:52 Raspberry grafana[3576]: logger=migrator t=2026-06-22T20:26:52.0 48510689+02:00 level=info msg="Unlocking database" Jun 22 20:26:52 Raspberry grafana[3576]: logger=secrets t=2026-06-22T20:26:52.06 6287888+02:00 level=info msg="Envelope encryption state" currentprovider=secretK ey.v1 pi@Raspberry:~ $ sudo systemctl status grafana-server ● grafana-server.service - Grafana instance Loaded: loaded (/usr/lib/systemd/system/grafana-server.service; enabled; preset: enabled) Active: active (running) since Mon 2026-06-22 20:28:22 CEST; 1s ago Invocation: c606f28e56934b17b5ca074ef48515b2 Docs: http://docs.grafana.org Main PID: 3893 (grafana) Tasks: 7 (limit: 3967) CPU: 2.280s CGroup: /system.slice/grafana-server.service └─3893 /usr/share/grafana/bin/grafana server --config=/etc/grafana/grafana.ini --pidfile=/run/grafana/grafana-server.pid --packagi> Jun 22 20:28:23 Raspberry grafana[3893]: logger=sqlstore t=2026-06-22T20:28:23.477860385+02:00 level=info msg="Using SQLite driver" driver=mode> Jun 22 20:28:23 Raspberry grafana[3893]: logger=migrator t=2026-06-22T20:28:23.484983859+02:00 level=info msg="Locking database" Jun 22 20:28:23 Raspberry grafana[3893]: logger=migrator t=2026-06-22T20:28:23.485173192+02:00 level=info msg="Starting DB migrations" Jun 22 20:28:23 Raspberry grafana[3893]: logger=migrator t=2026-06-22T20:28:23.577256559+02:00 level=info msg="migrations completed" performed=> Jun 22 20:28:23 Raspberry grafana[3893]: logger=migrator t=2026-06-22T20:28:23.57920652+02:00 level=info msg="Unlocking database" Jun 22 20:28:23 Raspberry grafana[3893]: logger=secrets t=2026-06-22T20:28:23.597211224+02:00 level=info msg="Envelope encryption state" curren> Jun 22 20:28:24 Raspberry grafana[3893]: logger=plugin.angulardetectorsprovider.dynamic t=2026-06-22T20:28:24.32406544+02:00 level=info msg="Re> Jun 22 20:28:24 Raspberry grafana[3893]: logger=accesscontrol.service t=2026-06-22T20:28:24.328700973+02:00 level=info msg="Starting migration > Jun 22 20:28:24 Raspberry grafana[3893]: logger=accesscontrol.service t=2026-06-22T20:28:24.33086373+02:00 level=info msg="Completed migration > Jun 22 20:28:24 Raspberry grafana[3893]: logger=plugin.store t=2026-06-22T20:28:24.331623285+02:00 level=info msg="Loading plugins..."✗ unable to start dualwrite service due to migration error: unified storage data migration failed: migration failed (id = playlists migration): migration failed for org 1 (default): SQL logic error: no such column: p.created_at (1)
Jun 22 20:26:50 Raspberry systemd[1]: grafana-server.service: Main process exite d, code=exited, status=1/FAILURESieht für mich so aus, als ob die Aktualisierung auf die neue Grafana Version nicht sauber durchläuft. Vielleicht der Sprung von der alten zu groß? Kannst du auf der alten Installation die Version noch hochziehen?
-
Hi Marc,
ich habe die 9.4.7. drauf, allerdings stellt sich das updaten sehr schwer heraus, da ich kein offizielles Update mehr finde.
Andere Idee: Sollte das Downloaden der einzelnen Dashboards auch gehen?
So muss jetzt ins Bett, hatte Nachtschicht. -
Hi Marc,
ich habe die 9.4.7. drauf, allerdings stellt sich das updaten sehr schwer heraus, da ich kein offizielles Update mehr finde.
Andere Idee: Sollte das Downloaden der einzelnen Dashboards auch gehen?
So muss jetzt ins Bett, hatte Nachtschicht.Andere Idee: Sollte das Downloaden der einzelnen Dashboards auch gehen?
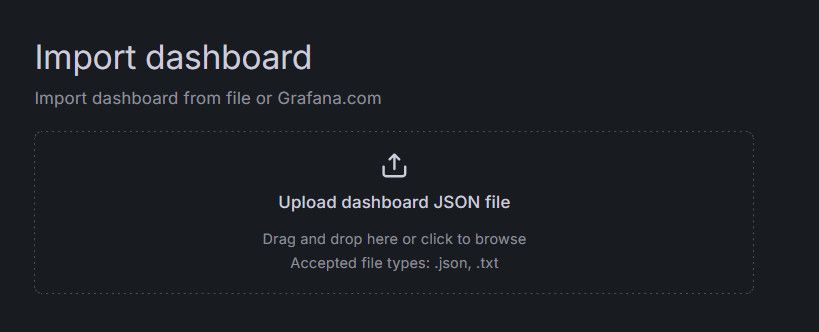
Du kannst dafür in das *.tar.gz gehen, welches von Backitup erstellt wurde. Da drin gibt es einen Ordner "dashboards_manually_restore". Diese Jsons kann du in Grafana unter "Dashboards --> New --> Import" importieren.
-
Hi Marc, da mein Grafana Backup über Backitup nicht funktioniert. Habe ich die Dashboards einzeln heruntergeladen und ins neue Grafana importiert.Die ging aber komischerweise nicht durch die Drag and Drop Funktion, da ist mir Grafan sofort ausgestiegen. Habe den Code dann kopiert und eingefügt.
Soweit so gut. Werde jetzt erstmal ein Image von dem Stand machen. Als nächstes habe ich vor die Influx Datenbank wieder herzustellen. Da will ich morgen ran. Oder hast du einen anderen Vorschlag zur Vorgehensweise. -
Hi Marc,
ich habe die 9.4.7. drauf, allerdings stellt sich das updaten sehr schwer heraus, da ich kein offizielles Update mehr finde.
Andere Idee: Sollte das Downloaden der einzelnen Dashboards auch gehen?
So muss jetzt ins Bett, hatte Nachtschicht. -
Hallo Thomas.
Meinst du das?pi@raspberrypi:~ $ pi@raspberrypi:~ $ sudo apt update Get:1 http://raspbian.raspberrypi.org/raspbian bullseye InRelease [15.0 kB] Get:2 http://archive.raspberrypi.org/debian bullseye InRelease [39.0 kB] Ign:3 http://archive.raspbian.org/raspbian stretch InRelease Err:4 http://archive.raspbian.org/raspbian stretch Release 404 Not Found [IP: 2a00:1098:0:80:1000:75:0:2 80] Get:5 https://packages.grafana.com/oss/deb stable InRelease [7,661 B] Hit:6 https://deb.nodesource.com/node_20.x nodistro InRelease Get:7 https://repos.influxdata.com/debian stretch InRelease [12.9 kB] Get:8 http://archive.raspberrypi.org/debian bullseye/main armhf Packages [330 kB ] Err:5 https://packages.grafana.com/oss/deb stable InRelease The following signatures couldn't be verified because the public key is not av ailable: NO_PUBKEY 963FA27710458545 Err:7 https://repos.influxdata.com/debian stretch InRelease The following signatures couldn't be verified because the public key is not av ailable: NO_PUBKEY DA61C26A0585BD3B Reading package lists... Done E: The repository 'http://archive.raspbian.org/raspbian stretch Release' no long er has a Release file. N: Updating from such a repository can't be done securely, and is therefore disa bled by default. N: See apt-secure(8) manpage for repository creation and user configuration deta ils. W: An error occurred during the signature verification. The repository is not up dated and the previous index files will be used. GPG error: https://packages.gra fana.com/oss/deb stable InRelease: The following signatures couldn't be verified because the public key is not available: NO_PUBKEY 963FA27710458545 W: GPG error: https://repos.influxdata.com/debian stretch InRelease: The followi ng signatures couldn't be verified because the public key is not available: NO_P UBKEY DA61C26A0585BD3B E: The repository 'https://repos.influxdata.com/debian stretch InRelease' is not signed. N: Updating from such a repository can't be done securely, and is therefore disa bled by default. N: See apt-secure(8) manpage for repository creation and user configuration deta ils. N: See apt-secure(8) manpage for repository creation and user configuration deta ils. W: An error occurred during the signature verification. The repository is not up dated and the previous index files will be used. GPG error: https://packages.gra fana.com/oss/deb stable InRelease: The following signatures couldn't be verified because the public key is not available: NO_PUBKEY 963FA27710458545 W: GPG error: https://repos.influxdata.com/debian stretch InRelease: The followi ng signatures couldn't be verified because the public key is not available: NO_P UBKEY DA61C26A0585BD3B -
Ich habe letzte Woche als ich den neuen Senec Adapter installiert habe.
Bereits iob fix ausgeführt. Hier die aktuelle iob diag========== Start marking the full check here =========== ```bash Script v.2026-06-06 *** BASE SYSTEM *** Operating System: Raspbian GNU/Linux 11 (bullseye) Static hostname: raspberrypi Icon name: computer Kernel: Linux 6.1.21-v7l+ Architecture: arm OS is similar to: debian Model : Raspberry Pi 4 Model B Rev 1.1 Docker : false Virtualization : none Unknown Kernel : armv7l Userland : 32bit System was installed 1697 days ago (on 2021-10-30). Outdated 32Bit architecture detected. Only a pure 64Bit-System will be supported in the future. You will have to reinstall your operating system with full 64Bit support or upgrade to more modern hardware soon. Systemuptime and Load: 19:24:59 up 1:39, 1 user, load average: 5.00, 2.75, 1.28 CPU threads : 4 *** LIFE CYCLE STATUS *** ERROR: Package 'distro-info' is not installed. Please do: sudo apt update && sudo apt install distro-info Alternatively execute the 'iob fix' -
Ich habe letzte Woche als ich den neuen Senec Adapter installiert habe.
Bereits iob fix ausgeführt. Hier die aktuelle iob diag========== Start marking the full check here =========== ```bash Script v.2026-06-06 *** BASE SYSTEM *** Operating System: Raspbian GNU/Linux 11 (bullseye) Static hostname: raspberrypi Icon name: computer Kernel: Linux 6.1.21-v7l+ Architecture: arm OS is similar to: debian Model : Raspberry Pi 4 Model B Rev 1.1 Docker : false Virtualization : none Unknown Kernel : armv7l Userland : 32bit System was installed 1697 days ago (on 2021-10-30). Outdated 32Bit architecture detected. Only a pure 64Bit-System will be supported in the future. You will have to reinstall your operating system with full 64Bit support or upgrade to more modern hardware soon. Systemuptime and Load: 19:24:59 up 1:39, 1 user, load average: 5.00, 2.75, 1.28 CPU threads : 4 *** LIFE CYCLE STATUS *** ERROR: Package 'distro-info' is not installed. Please do: sudo apt update && sudo apt install distro-info Alternatively execute the 'iob fix'Kernel : armv7l
Userland : 32bitDas System NEUINSTALLIEREN.
In der 64Bit-Lite-Version.https://forum.iobroker.net/topic/51869/installation-auf-raspi-einfacher-geht-s-nicht
-
Hi Thomas, das mache ich ja gerade. Ich habe eben Probleme mit dem Einspielen des Backups.
Habe ja bereits alles installiert. Und jetzt möchte ich eben die Backups implemenierenDa dürfte dir deine verkorkste Quellensammlung in die Suppe spucken.
Weder influx noch grafana können darüber aktuell gehalten werden. Und die Versionen dürften mittlerweile zu weit auseinanderliegen. -
Da dürfte dir deine verkorkste Quellensammlung in die Suppe spucken.
Weder influx noch grafana können darüber aktuell gehalten werden. Und die Versionen dürften mittlerweile zu weit auseinanderliegen. -
Hallo, ich wieder.
Habe jetzt schon mehrere Tage versucht meine Influxdb mit dem iobroker zu Verbinden. Mir fehlt aber immer "Verbunden mit Gerät oder Dienst" im Adapter.
Zuerst habe ich mein Influx und Iobroker backup zurück geholt (Backitup). iobroker hat eigentlich keine Probleme gemacht, das Influx Backup hat mir im Logger keine Fehler gebracht und mitgeteil succesfull. Konnte es bis jetzt aber nicht überprüfen ob die Daten wirklich vorhanden sind. Das ist eigentlich mein zweites Problem. Aber jetzt erstmal zur Verbindung.
Ich habe jetzt die Sache mal so probiert, wie wenn ich es komplett neu installiert hätte, d.h. ich hole mir kein Backup her, sondern versuch einfach mit der nackten Installation (Habe ja ein Image in dem iobroker und Influx frisch installiert wurden) also influx setup durchgeführt:pi@Raspberry:~ $ influx setup > Welcome to InfluxDB 2.0! ? Please type your primary username admin ? Please type your password ************ ? Please type your password again ************ ? Please type your primary organization name DM ? Please type your primary bucket name iobroker ? Please type your retention period in hours, or 0 for infinite 0 ? Setup with these parameters? Username: admin Organization: DM Bucket: iobroker Retention Period: infinite Yes User Organization Bucket admin DM iobrokerJetzt im iobroker den Infuxadapter runtergeladen und eingerichtet:
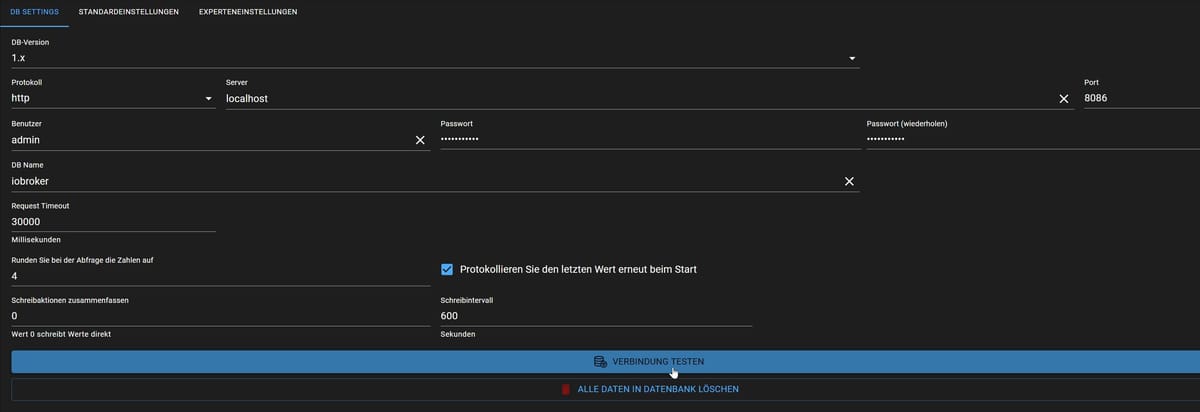
Beim Verbindungstest dies hier:
"Error: {"code":"unauthorized","message":"Unauthorized"}"Und im Adapter wird wie bereits beschrieben das hier gemeldet:
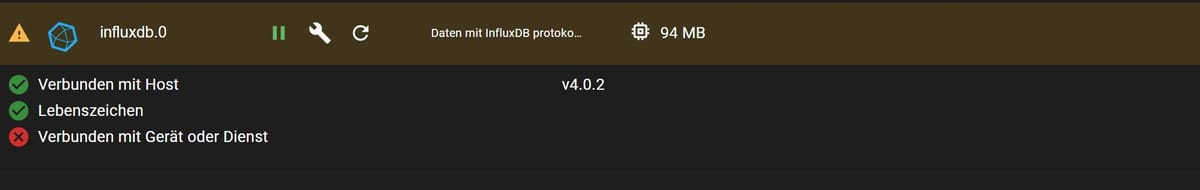
Name und Passwort passen, ich find es einfach nicht. Bin gerade am verzweifeln da dies ja eigentlich ohne Probleme zu bewerkstelligen sein sollte, ich meine damals habe ich es ja hin bekommen.
-
Hallo, ich wieder.
Habe jetzt schon mehrere Tage versucht meine Influxdb mit dem iobroker zu Verbinden. Mir fehlt aber immer "Verbunden mit Gerät oder Dienst" im Adapter.
Zuerst habe ich mein Influx und Iobroker backup zurück geholt (Backitup). iobroker hat eigentlich keine Probleme gemacht, das Influx Backup hat mir im Logger keine Fehler gebracht und mitgeteil succesfull. Konnte es bis jetzt aber nicht überprüfen ob die Daten wirklich vorhanden sind. Das ist eigentlich mein zweites Problem. Aber jetzt erstmal zur Verbindung.
Ich habe jetzt die Sache mal so probiert, wie wenn ich es komplett neu installiert hätte, d.h. ich hole mir kein Backup her, sondern versuch einfach mit der nackten Installation (Habe ja ein Image in dem iobroker und Influx frisch installiert wurden) also influx setup durchgeführt:pi@Raspberry:~ $ influx setup > Welcome to InfluxDB 2.0! ? Please type your primary username admin ? Please type your password ************ ? Please type your password again ************ ? Please type your primary organization name DM ? Please type your primary bucket name iobroker ? Please type your retention period in hours, or 0 for infinite 0 ? Setup with these parameters? Username: admin Organization: DM Bucket: iobroker Retention Period: infinite Yes User Organization Bucket admin DM iobrokerJetzt im iobroker den Infuxadapter runtergeladen und eingerichtet:
Beim Verbindungstest dies hier:
"Error: {"code":"unauthorized","message":"Unauthorized"}"Und im Adapter wird wie bereits beschrieben das hier gemeldet:
Name und Passwort passen, ich find es einfach nicht. Bin gerade am verzweifeln da dies ja eigentlich ohne Probleme zu bewerkstelligen sein sollte, ich meine damals habe ich es ja hin bekommen.
Bist du wirklich noch mit influxdb 1.x unterwegs?
-
Hallo Thomas,
ja, habe damals die 1.x auch benutzt. mit der 2er kann man anscheindend noch mehr. Mein Backup basiert ja auch auf der 1. und ich weis nicht ob ich das von der 1 zur 2 emigrieren kann. Wenn es natürlich sinnvoller wäre die 2.x zu benutzen und ihr sagt das (ich bin in diesem Thema leider noch so versiert und bewundere euch wie ihr immer die Befehle raushaut), werde ich die 2er nehmen. Mittlerweile wird mir meinBackup der Influx immer egaler, will einfach nur wieder Grafan mit meinem Senec und andere Sachen wieder angezeigt haben. -
Hallo Thomas,
ja, habe damals die 1.x auch benutzt. mit der 2er kann man anscheindend noch mehr. Mein Backup basiert ja auch auf der 1. und ich weis nicht ob ich das von der 1 zur 2 emigrieren kann. Wenn es natürlich sinnvoller wäre die 2.x zu benutzen und ihr sagt das (ich bin in diesem Thema leider noch so versiert und bewundere euch wie ihr immer die Befehle raushaut), werde ich die 2er nehmen. Mittlerweile wird mir meinBackup der Influx immer egaler, will einfach nur wieder Grafan mit meinem Senec und andere Sachen wieder angezeigt haben.Mir ist immer noch nicht klar, wie groß da jeweils die Versionssprünge sind.
influx hat im Altsystem? Und im neuen System?
Gleiches für Grafana und was da sonst noch installiert ist. -
Bist du wirklich noch mit influxdb 1.x unterwegs?
Bist du wirklich noch mit influxdb 1.x unterwegs?
Warum nicht, damit kann man bei InfluxQl bleiben, ohne auf die jungfräuliche 3er-Version schwenken zu müssen. Bis diese soweit ist, kann man auch die 1.x aus meiner Sicht weiter nutzen.
Der Wechsel auf InfluxDB2 (ich habe ihn gemacht) bedeutet ja, dass alle Queries auf Flux überarbeitet werden müssen.
Ich bleibe jetzt erstmal bei v2.x und finde nebenbei die Entwicklungsstrategie von InfluxDB gelinde gesagt fragwürdig.
Proxmox und HA - dank KI/AI endlich "blocklyfrei"
Hey! Du scheinst an dieser Unterhaltung interessiert zu sein, hast aber noch kein Konto.
Hast du es satt, bei jedem Besuch durch die gleichen Beiträge zu scrollen? Wenn du dich für ein Konto anmeldest, kommst du immer genau dorthin zurück, wo du zuvor warst, und kannst dich über neue Antworten benachrichtigen lassen (entweder per E-Mail oder Push-Benachrichtigung). Du kannst auch Lesezeichen speichern und Beiträge positiv bewerten, um anderen Community-Mitgliedern deine Wertschätzung zu zeigen.
Mit deinem Input könnte dieser Beitrag noch besser werden 💗
Registrieren AnmeldenSupport us
455
Online33.0k
Benutzer83.4k
Themen1.3m
Beiträge