NEWS

Skript zur dynamischen Generierung Batterie/Akku Symbol
-
@ro75 Ich stoße auf einen Fehler, wenn ich ein SVG generiere mit "showBolt = true;".
XML-Verarbeitungsfehler: Präfix nicht an einen Namespace gebunden Adresse: file:///Z:/Dokumentationen/ioBroker/ro75_BattSymb2a.svg Zeile Nr. 49, Spalte 7: <use xlink:href="#boltSymbol-b-arf2f44" class="" transform="translate(184, 90) ------^@rene55 funktioniert nur via Datenpunkt. Als Datei speichern und dann öffnen geht nicht, da bekomme ich auch nur Meldungen.
Zeige mal bitte den dazugehörigen Code, also den von der Funktion.Ro75.
SERVER = Beelink U59 16GB DDR4 RAM 512GB SSD, FB 7490, FritzDect 200+301+440, ConBee II, Zigbee Aqara Sensoren + NOUS A1Z, NOUS A1T, Philips Hue ** ioBroker, REDIS, influxdb2, Grafana, PiHole, Plex-Mediaserver, paperless-ngx (Docker), MariaDB + phpmyadmin *** VIS-Runtime = Intel NUC 8GB RAM 128GB SSD + 24" Touchscreen
-
@rene55 funktioniert nur via Datenpunkt. Als Datei speichern und dann öffnen geht nicht, da bekomme ich auch nur Meldungen.
Zeige mal bitte den dazugehörigen Code, also den von der Funktion.Ro75.
-
Noch ne Frage: wie wird das Skript getriggert? Mein Datenpunkt hat sich geändert, das tolle Bild leider nicht.
Grüße -
@ro75 sagte in Skript zur dynamischen Generierung Batterie/Akku Symbol:
@maxtor62 schaue bitte Post #20.
Ro75.
Ok, habe wie im Post #20 die Zeile
on({ id: dValue, change: 'ne' }, dp => {
    setState(ZielDP, generateBatterySvg(dp.state.val, decimalPlaces, labelSuffix, customLabel, showPercent, strongColors, colorScheme, showBolt, boltPos, blinkBolt), true);
});
noch eingebaut.
script.js.Test.Batterie: Error by subscription (trigger): Wrong ID of type boolean or number.Sorry, ich bin halt kein Coder.
Wer meint er ist was, hat aufgehört was zu werden
-
@ro75 sagte in Skript zur dynamischen Generierung Batterie/Akku Symbol:
@maxtor62 schaue bitte Post #20.
Ro75.
Ok, habe wie im Post #20 die Zeile
on({ id: dValue, change: 'ne' }, dp => {
    setState(ZielDP, generateBatterySvg(dp.state.val, decimalPlaces, labelSuffix, customLabel, showPercent, strongColors, colorScheme, showBolt, boltPos, blinkBolt), true);
});
noch eingebaut.
script.js.Test.Batterie: Error by subscription (trigger): Wrong ID of type boolean or number.Sorry, ich bin halt kein Coder.
-
@ro75
Das ist der richtige Datenpunkt. Sorry, ich kann das halt nicht.
Aber ist ok.
Danke -
Ich habe mal das Skript für das widget aus dem adapter jsontemplate umgesetzt
https://forum.iobroker.net/topic/31521/test-widget-json-template/33?_=1762980256778
Damit kann man dann ohne Datenpunkt, um das Bild zwischenzuspeichern, das Bild verwenden. Das Widget reagiert auch direkt auf veränderungen.
-
@rene55 funktioniert nur via Datenpunkt. Als Datei speichern und dann öffnen geht nicht, da bekomme ich auch nur Meldungen.
Zeige mal bitte den dazugehörigen Code, also den von der Funktion.Ro75.
@ro75 Ich habe das SVG in einem Datenpunkt abgelegt, und den Inhalt dann als Datei (.svg) gespeichert. Das konnte ich ohne Probleme im Firefox öffnen. Als ich in einem zweiten Versuch dann den Blitz eingeschaltet hatte, kam diese Meldung. Meintest du mit Code den SVG-Code?
Hierin habe ich auch ein "{1}" gesehen. Ist das so richtig?
Host: Fujitsu Intel(R) Pentium(R) CPU G4560T, 32 GB RAM, Proxmox 8.x + lxc Ubuntu 22.04
ioBroker (8 GB RAM) Node.js: 20.19.1, NPM: 10.8.2, js-Controller: 7.0.6, Admin: 7.6.3
Wetterstation: Froggit WH3000SE V1.6.6 -
@ro75 Ich habe das SVG in einem Datenpunkt abgelegt, und den Inhalt dann als Datei (.svg) gespeichert. Das konnte ich ohne Probleme im Firefox öffnen. Als ich in einem zweiten Versuch dann den Blitz eingeschaltet hatte, kam diese Meldung. Meintest du mit Code den SVG-Code?
Hierin habe ich auch ein "{1}" gesehen. Ist das so richtig?
@rene55 als Datei ist nicht vorgesehen.
Ro75
SERVER = Beelink U59 16GB DDR4 RAM 512GB SSD, FB 7490, FritzDect 200+301+440, ConBee II, Zigbee Aqara Sensoren + NOUS A1Z, NOUS A1T, Philips Hue ** ioBroker, REDIS, influxdb2, Grafana, PiHole, Plex-Mediaserver, paperless-ngx (Docker), MariaDB + phpmyadmin *** VIS-Runtime = Intel NUC 8GB RAM 128GB SSD + 24" Touchscreen
-
@ro75 Mag sein. Mich wundert dann nur, dass es ohne Blitz geht! Hab halt aktuell keine VIS.
Host: Fujitsu Intel(R) Pentium(R) CPU G4560T, 32 GB RAM, Proxmox 8.x + lxc Ubuntu 22.04
ioBroker (8 GB RAM) Node.js: 20.19.1, NPM: 10.8.2, js-Controller: 7.0.6, Admin: 7.6.3
Wetterstation: Froggit WH3000SE V1.6.6 -
@ro75 Mag sein. Mich wundert dann nur, dass es ohne Blitz geht! Hab halt aktuell keine VIS.
@rene55 SVG Code muss sich ja auch in andere Visualisierungen einfügen lassen.
Ro75
SERVER = Beelink U59 16GB DDR4 RAM 512GB SSD, FB 7490, FritzDect 200+301+440, ConBee II, Zigbee Aqara Sensoren + NOUS A1Z, NOUS A1T, Philips Hue ** ioBroker, REDIS, influxdb2, Grafana, PiHole, Plex-Mediaserver, paperless-ngx (Docker), MariaDB + phpmyadmin *** VIS-Runtime = Intel NUC 8GB RAM 128GB SSD + 24" Touchscreen
-
@rene55 @Ro75
Nur zur Info falls es weiterhilft.
Mit der Version 1.0.3 funktioniert es auch (zumindest bei mir) tadellos mit dem Speichern in eine Datei (mit und ohne Blitz) für die Nutzung im Energiefluss-erweitert-Adapter. Klappt perfekt. Mit Version 1.0.6 bekomme ich da leider auch die gleichen Probleme wenn ich's in eine Datei wegspeichere und dann über den Browser aufrufen möchte. Mir persönlich reichen aber die Einstellmöglichkeiten der "alten" Version voll und ganz. -
@OliverIO wenn ich dann den korrigierten und erweiterten Code einstelle, passt du dann dein Beispiel an?
Ro75.
SERVER = Beelink U59 16GB DDR4 RAM 512GB SSD, FB 7490, FritzDect 200+301+440, ConBee II, Zigbee Aqara Sensoren + NOUS A1Z, NOUS A1T, Philips Hue ** ioBroker, REDIS, influxdb2, Grafana, PiHole, Plex-Mediaserver, paperless-ngx (Docker), MariaDB + phpmyadmin *** VIS-Runtime = Intel NUC 8GB RAM 128GB SSD + 24" Touchscreen
-
@OliverIO wenn ich dann den korrigierten und erweiterten Code einstelle, passt du dann dein Beispiel an?
Ro75.
Version 1.0.8 mit Fehlerkorrektur ist raus. Die SVG-Codes können nun ohne Probleme in eine Datei gepackt werden. Weiterer Parameter für Farbschema Ladesymbol.


Ro75.
SERVER = Beelink U59 16GB DDR4 RAM 512GB SSD, FB 7490, FritzDect 200+301+440, ConBee II, Zigbee Aqara Sensoren + NOUS A1Z, NOUS A1T, Philips Hue ** ioBroker, REDIS, influxdb2, Grafana, PiHole, Plex-Mediaserver, paperless-ngx (Docker), MariaDB + phpmyadmin *** VIS-Runtime = Intel NUC 8GB RAM 128GB SSD + 24" Touchscreen
-
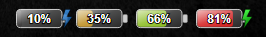
Hallo. Hier ein neues Skript von mir. Ich verwende in meiner Visualisierung (VIS 1) an diversen Stellen den (Lade)zustand von Batterie/Akku. Bisher habe ich das mit Grafiken (png, svg) realisiert.
Dieses Skript erzeugt dynamisch ein farbliches Symbol im SVG Format. Diese reicht von rot bis grün. Der Prozentsatz ist zentriert enthalten. Weiterhin können auch kräftiger Farben oder ein Ladesymbol (frei positionierbar) aktiviert werden. Statt % kann auch jede andere Bezeichnung für den Wert, oder ein komplett anderer Text genutzt werden.
Funktioniert mit VIS 1. Sollte aber auch mit VIS 2 oder anderen Modulen laufen.


Mit ein wenig Spielerei und Experimentierfreudigkeit kann man da auch andere Farben verwenden.Der Code generiert einen SVG Code der in einem Datenpunkt (Zeichen) gespeichert wird. Zur Darstellung wird in VIS 1 das String (unescaped) verwendet, das mit dem entsprechenden Datenpunkt verbunden ist.
Der Code:
//Ersteller: Ro75
//Datum: 13.11.2025
//Version: 1.0.8
//Javascript: 8.9.2
//NodeJS: 20.x / 22.x

// dynamische Betterie-Icon Generierung

// -------------------------------------------------------
// Hilfsfunktionen
// -------------------------------------------------------
function clamp(v, a, b) { return Math.max(a, Math.min(b, v)); }
function uid(prefix = 'id') { return `${prefix}-${Math.random().toString(36).slice(2,9)}`; }

function hslToRgb(h, s, l) {
  s /= 100; l /= 100;
  const k = n => (n + h / 30) % 12;
  const a = s * Math.min(l, 1 - l);
  const f = n => l - a * Math.max(-1, Math.min(k(n) - 3, Math.min(9 - k(n), 1)));
  return [Math.round(255 * f(0)), Math.round(255 * f(8)), Math.round(255 * f(4))];
}

function luminance(r, g, b) {
  const srgb = [r, g, b].map(c => {
    c /= 255;
    return (c <= 0.04045) ? c / 12.92 : Math.pow((c + 0.055) / 1.055, 2.4);
  });
  return 0.2126 * srgb[0] + 0.7152 * srgb[1] + 0.0722 * srgb[2];
}

const SAMPLE_POINTS = [
  { p: 0, w: 2 }, { p: 5, w: 10 }, { p: 10, w: 19 }, { p: 15, w: 29 }, { p: 20, w: 38 },
  { p: 25, w: 48 }, { p: 30, w: 58 }, { p: 35, w: 67 }, { p: 40, w: 77 }, { p: 45, w: 86 },
  { p: 50, w: 96 }, { p: 55, w: 106 }, { p: 60, w: 115 }, { p: 65, w: 125 }, { p: 70, w: 134 },
  { p: 75, w: 144 }, { p: 80, w: 154 }, { p: 85, w: 163 }, { p: 90, w: 173 }, { p: 95, w: 182 },
  { p: 100, w: 192 }
];

function interpolatedWidth(percent) {
  const p = clamp(percent, 0, 100);
  for (const s of SAMPLE_POINTS) if (s.p === p) return s.w;
  let lower = SAMPLE_POINTS[0], upper = SAMPLE_POINTS[SAMPLE_POINTS.length - 1];
  for (let i = 0; i < SAMPLE_POINTS.length - 1; i++) {
    const a = SAMPLE_POINTS[i], b = SAMPLE_POINTS[i + 1];
    if (p > a.p && p < b.p) { lower = a; upper = b; break; }
    if (p === b.p) return b.w;
  }
  const t = (p - lower.p) / (upper.p - lower.p);
  return Math.round(lower.w + t * (upper.w - lower.w));
}

// -------------------------------------------------------
// Farb-Schemata mit strongColors-Effekt
// -------------------------------------------------------
function getFillColor(p, strongColors, colorScheme) {
  let hue;
  let saturation;
  let lightness;

  switch ((colorScheme || 'default').toLowerCase()) {
    case 'green':
      hue = 120;
      saturation = strongColors ? 100 : 80;
      lightness = strongColors ? 25 + (p / 100) * 25 : 35 + (p / 100) * 30;
      break;
    case 'yellow':
      hue = 50;
      saturation = strongColors ? 100 : 85;
      lightness = strongColors ? 25 + (p / 100) * 30 : 35 + (p / 100) * 30;
      break;
    case 'blue':
      hue = 210;
      saturation = strongColors ? 100 : 75;
      lightness = strongColors ? 20 + (p / 100) * 25 : 35 + (p / 100) * 30;
      break;
    case 'red':
      hue = 0;
      saturation = strongColors ? 100 : 75;
      lightness = strongColors ? 20 + (p / 100) * 25 : 35 + (p / 100) * 30;
      break;
    case 'orange':
      hue = 30;
      saturation = strongColors ? 100 : 80;
      lightness = strongColors ? 20 + (p / 100) * 25 : 35 + (p / 100) * 30;
      break;
    case 'brown':
      hue = 25;
      saturation = strongColors ? 85 : 65;
      lightness = strongColors ? 20 + (p / 100) * 20 : 25 + (p / 100) * 25;
      break;
    case 'grey':
      hue = 0;
      saturation = strongColors ? 15 : 0;
      lightness = strongColors ? 20 + (p / 100) * 40 : 25 + (p / 100) * 40;
      break;
    case 'purple':
      hue = 275;
      saturation = strongColors ? 95 : 75;
      lightness = strongColors ? 25 + (p / 100) * 25 : 35 + (p / 100) * 30;
      break;
    case 'black':
      hue = 0;
      saturation = strongColors ? 10 : 0;
      lightness = strongColors ? 1 + (p / 100) * 27 : 3 + (p / 100) * 20;
      break;
    default: // Standard: grün → rot Verlauf
      hue = Math.round((p / 100) * 120);
      saturation = strongColors ? 100 : 90;
      lightness = strongColors ? 35 : 50;
      break;
  }

  return `hsl(${hue},${saturation}%,${lightness}%)`;
}

// -------------------------------------------------------
// Blitz-Farbverlauf passend zum Farbschema
// -------------------------------------------------------
function getBoltGradientFromScheme(strongColors, boltColorScheme) {
  const scheme = (boltColorScheme || 'default').toLowerCase();

  if (scheme === 'default') {
    return ['#f7b23b', '#f59e0b'];
  }

  let hue, saturation;
  switch (scheme) {
    case 'green': hue = 120; saturation = strongColors ? 100 : 80; break;
    case 'yellow': hue = 50; saturation = strongColors ? 100 : 85; break;
    case 'blue': hue = 210; saturation = strongColors ? 100 : 75; break;
    case 'red': hue = 0; saturation = strongColors ? 100 : 75; break;
    case 'orange': hue = 30; saturation = strongColors ? 100 : 80; break;
    case 'brown': hue = 25; saturation = strongColors ? 85 : 65; break;
    case 'grey': hue = 0; saturation = strongColors ? 15 : 0; break;
    case 'purple': hue = 275; saturation = strongColors ? 95 : 75; break;
    case 'black': hue = 0; saturation = strongColors ? 10 : 0; break;
    default: hue = 45; saturation = 100; break;
  }

  const lightLow = strongColors ? 25 : 40;
  const lightHigh = strongColors ? 65 : 70;

  return [
    `hsl(${hue},${saturation}%,${lightLow}%)`,
    `hsl(${hue},${saturation}%,${lightHigh}%)`
  ];
}

// -------------------------------------------------------
// Hauptfunktion
// -------------------------------------------------------
function generateBatterySvg(percent, decimalPlaces = 0, labelSuffix = '%', customLabel = null, showPercent = true, strongColors = false, colorScheme = 'default', showBolt = false, boltPos = 100, blinkBolt = false, boltColorScheme = 'default')
{
  const raw = Number(percent);
  const p = clamp(Number.isFinite(raw) ? raw : 0, 0, 100);

  const viewBoxW = 264, viewBoxH = 129;
  const outer = { x: 20, y: 24, w: 200, h: 80, rx: 18 };
  const inner = { x: 24, y: 28, h: 72, rx: 12 };
  const maxInnerWidth = 192;

  const fillW = interpolatedWidth(p);
  const fillColor = getFillColor(p, strongColors, colorScheme);

  const nums = (fillColor.match(/-?\d+(\.\d+)?/g) || []).map(Number);
  const [hVal = 0, sVal = 0, lVal = 50] = nums;
  const [r, g, b] = hslToRgb(hVal, sVal, lVal);
  const lum = luminance(r, g, b);
  const textFill = lum > 0.55 ? '#000' : '#fff';
  const outlineColor = (textFill === '#fff') ? 'rgba(0,0,0,0.85)' : 'rgba(255,255,255,0.95)';

  const formattedValue = Number(p).toFixed(decimalPlaces);
  const formattedTrimmed = (decimalPlaces === 0) ? String(Math.round(Number(formattedValue))) : formattedValue;
  const displayText = customLabel ?? `${formattedTrimmed}${labelSuffix}`;

  const fontSize = Math.max(12, Math.round(inner.h * 0.33 * 2.25));
  const textCenterX = inner.x + maxInnerWidth / 2;
  const textCenterY = inner.y + inner.h / 2;
  const TEXT_DY_EM = 0.35;

  const contact = { x: 224, y: 46, w: 20, h: 36 };
  const contactCenterX = contact.x + contact.w / 2;
  const contactCenterY = contact.y + contact.h / 2;

  const boltViewBox = { w: 102.7, h: 186.8 };
  const boltTargetH = outer.h * 1.7;
  const boltScale = boltTargetH / boltViewBox.h;
  const boltOffsetY = contactCenterY + 26;

  const clampedBoltPos = clamp(boltPos, 0, 100);
  const leftEdge = 0;
  const rightEdge = contactCenterX - 50;
  const baseX = leftEdge + ((rightEdge - leftEdge) * (clampedBoltPos / 100));
  let extraOffset = -30;
  if (clampedBoltPos === 0) extraOffset = -15;
  else if (clampedBoltPos === 100) extraOffset = 0;
  const boltX = baseX + extraOffset;

  const boltTransform = `
    translate(${boltX}, ${boltOffsetY})
    scale(${boltScale})
    translate(${-boltViewBox.w / 2}, ${-boltViewBox.h / 2})
  `.trim();

  const id = uid('b');
  const boltAnimation = blinkBolt ? `
    <style>
      @keyframes blinkBolt-${id} {
        0%, 100% { opacity: 1; }
        50% { opacity: 0.6; }
      }
      .blinking-bolt-${id} {
        animation: blinkBolt-${id} 1.8s ease-in-out infinite;
      }
    </style>` : '';
  const boltClass = blinkBolt ? `blinking-bolt-${id}` : '';

  const [boltColorDark, boltColorLight] = getBoltGradientFromScheme(strongColors, boltColorScheme || colorScheme);

  return `
    <svg xmlns="http://www.w3.org/2000/svg"
         xmlns:xlink="http://www.w3.org/1999/xlink"
         viewBox="0 0 ${viewBoxW} ${viewBoxH}"
         width="100%" height="100%"
         preserveAspectRatio="xMidYMid meet">
      ${boltAnimation}
      <defs>
        <linearGradient id="glass-${id}" x1="0" y1="0" x2="0" y2="1">
          <stop offset="0%" stop-color="#ffffff" stop-opacity="0.80"/>
          <stop offset="100%" stop-color="#ffffff" stop-opacity="0.10"/>
        </linearGradient>
        <linearGradient id="diagGlass-${id}" x1="0" y1="0" x2="1" y2="1">
          <stop offset="0%" stop-color="#ffffff" stop-opacity="0.75"/>
          <stop offset="45%" stop-color="#ffffff" stop-opacity="0.22"/>
          <stop offset="100%" stop-color="#ffffff" stop-opacity="0.03"/>
        </linearGradient>
        <pattern id="stripes-${id}" width="8" height="8" patternUnits="userSpaceOnUse">
          <rect width="8" height="8" fill="transparent"/>
          <path d="M-1,6 l8,-6 M-1,10 l8,-6" stroke="#fff" stroke-opacity="0.08" stroke-width="1"/>
        </pattern>
        <clipPath id="clip-fill-${id}">
          <rect x="${inner.x}" y="${inner.y}" width="${fillW}" height="${inner.h}" rx="${inner.rx}" ry="${inner.rx}"/>
        </clipPath>
        <linearGradient id="boltGradient-${id}" x1="8.7" x2="80.9" y1="17.1" y2="142.1" gradientUnits="userSpaceOnUse">
          <stop offset="0" stop-color="${boltColorLight}"/>
          <stop offset="1" stop-color="${boltColorDark}"/>
        </linearGradient>
        <symbol id="boltSymbol-${id}" viewBox="0 0 102.7 186.8">
          <path fill="url(#boltGradient-${id})" stroke="#000" stroke-width="6" stroke-linejoin="round"
                d="m34.8 2-32 96h32l-16 80 80-112h-48l32-64h-48z"/>
        </symbol>
      </defs>
      <rect x="${outer.x}" y="${outer.y}" width="${outer.w}" height="${outer.h}" rx="${outer.rx}"
            fill="#222" stroke="#ddd" stroke-width="4"/>
      <rect x="${inner.x}" y="${inner.y}" width="${fillW}" height="${inner.h}"
            rx="${inner.rx}" ry="${inner.rx}" fill="${fillColor}"/>
      <g clip-path="url(#clip-fill-${id})">
        <rect x="${inner.x}" y="${inner.y}" width="${fillW}" height="${inner.h}"
              rx="${inner.rx}" fill="url(#stripes-${id})" opacity="0.95"/>
        <rect x="${inner.x}" y="${inner.y}" width="${fillW}" height="${inner.h}"
              rx="${inner.rx}" fill="url(#glass-${id})" opacity="0.25"/>
      </g>
      <rect x="${outer.x}" y="${outer.y}" width="${outer.w}" height="${outer.h}"
            rx="${outer.rx}" fill="url(#diagGlass-${id})" opacity="0.9"/>
      <rect x="224" y="46" width="20" height="36" rx="6" fill="#ccc" stroke="#888" stroke-width="2"/>
      ${showBolt ? `<use href="#boltSymbol-${id}" class="${boltClass}" transform="${boltTransform}"/>` : ''}
      ${showPercent ? `
        <g transform="translate(${textCenterX}, ${textCenterY})">
          <text text-anchor="middle"
                font-family="Arial, Helvetica, sans-serif"
                font-size="${fontSize}" font-weight="700"
                fill="${textFill}" stroke="${outlineColor}"
                stroke-width="${Math.max(2, Math.round(fontSize * 0.15))}"
                paint-order="stroke" dy="${TEXT_DY_EM}em">${displayText}</text>
        </g>` : ''}
    </svg>`.trim();
}
DOKUMENTATION: Prarameterübersicht
Parameter Typ Standardwert Beschreibung percent numbererforderlich Der Ladezustand der Batterie in Prozent ( 0–100). Werte außerhalb werden automatisch auf diesen Bereich begrenzt.decimalPlaces number0Anzahl der Nachkommastellen, die beim Prozentwert angezeigt werden. Beispiel: 1→56.7%.labelSuffix string'%'Text, der hinter dem Zahlenwert angezeigt wird. Kann z. B. '%','V','mAh','W'usw. sein.customLabel string \| nullnullÜberschreibt die Standardanzeige des Werts vollständig. Beispiel: "FULL","LOW","READY","Laden". Wenn gesetzt, werdendecimalPlacesundlabelSuffixignoriert.showPercent booleantrueSteuert, ob der Text (Wert oder Label) in der Batterie angezeigt wird. Bei falsewird keine Beschriftung angezeigt.strongColors booleanfalseAktiviert kräftigere, gesättigtere Farben und stärkeren Kontrast. Sichtbar besonders bei festen Farbschemata ( red,blue,green, etc.).colorScheme string'default'Legt das Farbschema fest. Mögliche Werte siehe unten. showBolt booleanfalseBlendet das Blitzsymbol (  ) zur Anzeige von „Laden“ oder „Energie“ ein.
boltPos number100Horizontale Position des Blitzsymbols von 0–100. 0 = links, 100 = rechts (am Kontakt).blinkBolt booleanfalseAktiviert einen sanften Blinkeffekt für das Blitzsymbol (weiches Pulsieren). boltColorScheme stringdefaultLegt das Farbschema fest. Mögliche Werte siehe unten. DOKUMENTATION: Unterstützte Farbschemata (colorScheme)
Name Beschreibung Verlauf / Charakteristik 'default'Standardverlauf: grün → gelb → rot Farbverlauf abhängig vom Batteriestand 'green'Grüntöne Dunkelgrün → Hellgrün 'yellow'Gelbtöne Ocker → Hellgelb 'blue'Blautöne Marineblau → Hellblau 'red'Rottöne Dunkelrot → Hellrot 'orange'Orangetöne Dunkelorange → Hellorange 'brown'Brauntöne Dunkelbraun → Mittelbraun 'grey'Graustufen Mittelgrau → Hellgrau 'purple'zwischen Violett und Purpur kräftiges dunkles Lila → helleres Violett 'black'Schwarzschema Links tiefschwarz, rechts dunkelgrau (deutlicher Kontrast) DOKUMENTATION: Unterstützte Farbschemata (boltColorScheme)
Name Beschreibung Verlauf / Charakteristik 'default'Standardverlauf: orange → gelb 'green'Grüntöne Dunkelgrün → Hellgrün 'yellow'Gelbtöne Ocker → Hellgelb 'blue'Blautöne Marineblau → Hellblau 'red'Rottöne Dunkelrot → Hellrot 'orange'Orangetöne Dunkelorange → Hellorange 'brown'Brauntöne Dunkelbraun → Mittelbraun 'grey'Graustufen Mittelgrau → Hellgrau 'purple'zwischen Violett und Purpur kräftiges dunkles Lila → helleres Violett 'black'Schwarzschema von tiefschwarz, bis dunkelgrau (deutlicher Kontrast)  Hinweise zur Farbdarstellung
- Bei strongColors = true werden:
- die Farben satter (höhere Sättigung)
- der Verlauf dunkler und kontrastreicher
- Bei strongColors = false erhält man einen weicheren, neutraleren Verlauf.
DOKUMENTATION: Blitzsymbol (showBolt, boltPos, blinkBolt)
Option Wirkung showBolt: trueZeigt das Blitzsymbol an. boltPosPosition des Blitzes auf der horizontalen Achse. blinkBolt: trueAktiviert ein sanftes „Atmen“ des Blitzsymbols (Opacity zwischen 1  0.6).
0.6).BEISPIEL mit Speicherung des SVG Code in einen Datenpunkt
const ZielDP = '0_userdata.0.Batterie1'; // bitte anpassen

const dValue = getState('fritzdect.0.DECT_099950330172.battery').val; // bitte anpassen
const decimalPlaces = 0; // bitte anpassen
const labelSuffix = '%'; // bitte anpassen
const customLabel = null; // bitte anpassen
const showPercent = true; // bitte anpassen
const strongColors = true; // bitte anpassen
const colorScheme = 'default'; // bitte anpassen
const showBolt = false; // bitte anpassen
const boltPos = 100; // bitte anpassen
const blinkBolt = false; // bitte anpassen
const boltColorScheme = 'default'; // bitte anpassen

//Funktionsaufruf mit Speicherung der SVG in einen Datenpunkt
setState(ZielDP, generateBatterySvg(dValue, decimalPlaces, labelSuffix, customLabel, showPercent, strongColors, colorScheme, showBolt, boltPos, blinkBolt, boltColorScheme), true);
Viel Spaß beim testen und benutzen.
Ro75.
1.0.1: Korrekturen
1.0.3: wahlweise kräftiger Farben und Ladesymbol
1.0.5: Ladesymbol frei beweglich, freier Suffix (% oder z.B. V) oder komplett freier Text, Wert mit X Kommastellen
1.0.6: Sortierung der Parameter, Ladesymbol kann auf Wunsch sanft blinken, Dokumentation und Beispiel angepasst
1.0.8: Korrekt vom erstellten SVG-Code. Dieser kann nun in Dateien verwendet werden - ohne Fehler. Weiterer Parameter zur Steuerung des Farbschemas vom Ladesymbol.@ro75 sagte in Skript zur dynamischen Generierung Batterie/Akku Symbol:
Sollte aber auch mit VIS 2 oder anderen Modulen laufen.
Ja, aber für VIS-2 gibt es ein eigenes Widget.
Vis 2 - Messgeräte - Batterie
Für VIS1 aber ausgezeichnet!
- Bei strongColors = true werden:
-
Version 1.0.8 mit Fehlerkorrektur ist raus. Die SVG-Codes können nun ohne Probleme in eine Datei gepackt werden. Weiterer Parameter für Farbschema Ladesymbol.
Ro75.
-
Version 1.0.8 mit Fehlerkorrektur ist raus. Die SVG-Codes können nun ohne Probleme in eine Datei gepackt werden. Weiterer Parameter für Farbschema Ladesymbol.
Ro75.

Support us
719
Online32.4k
Users81.4k
Topics1.3m
Posts