

Jarvis v3.1.8, Datenpunkte in Diagramm ohne history möglich?
-
Hallo zusammen, vielleicht kann jemand meinen Knoten im Kopf lösen:
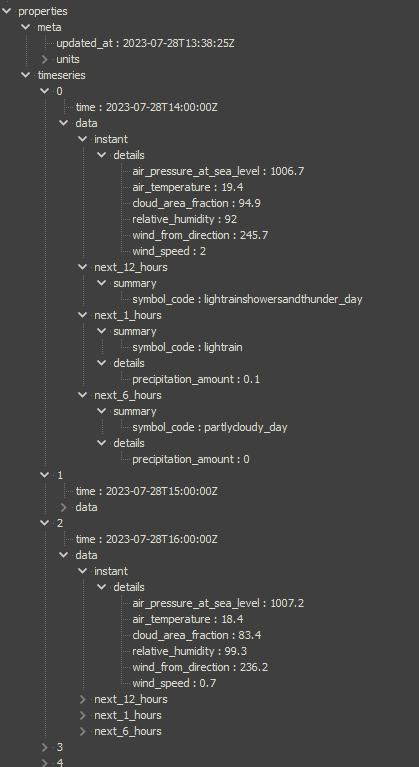
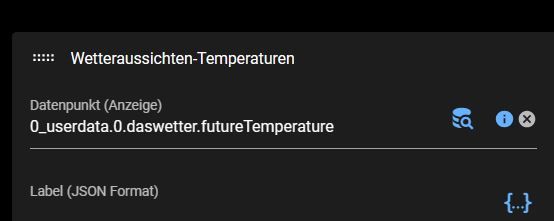
Der YR-Wetteradapter bietet eine Vielzahl an Forecast-Datenpunkte, siehe Bild als Beispiel. Kann ich aus diesen Werten ein Diagramm erstellen, ohne diese in history zu aktivieren?
Mir fehlt hier der Schubs in die richtige Richtung, bin für jeden Tipp dankbar. Habe auch schon in Richtung echarts geschaut, mit diesem Tool habe ich mich aber noch nicht operativ auseinandergesetzt.
Danke!

-
Hallo zusammen, vielleicht kann jemand meinen Knoten im Kopf lösen:
Der YR-Wetteradapter bietet eine Vielzahl an Forecast-Datenpunkte, siehe Bild als Beispiel. Kann ich aus diesen Werten ein Diagramm erstellen, ohne diese in history zu aktivieren?
Mir fehlt hier der Schubs in die richtige Richtung, bin für jeden Tipp dankbar. Habe auch schon in Richtung echarts geschaut, mit diesem Tool habe ich mich aber noch nicht operativ auseinandergesetzt.
Danke!
@flkontakt Das Bild kommt von Grafana?
Also eChart ist eine Möglichkeit zur Darstellung, für die man auch einen history-DP benötigt.
Ohne DP mit history, sql, influxdb-Logging geht es nicht.
Muss evtl angepasst werden?
https://mcuiobroker.gitbook.io/jarvis-infos/tipps/scripte-blockly-javascript/javascript/history-adapter/daswetter-futurehistoryNUC i7 64GB mit Proxmox ---- Jarvis Infos Aktualisierungen der Doku auf Instagram verfolgen -> mcuiobroker Instagram
Wenn Euch mein Vorschlag geholfen hat, bitte rechts "^" klicken. -
@flkontakt Das Bild kommt von Grafana?
Also eChart ist eine Möglichkeit zur Darstellung, für die man auch einen history-DP benötigt.
Ohne DP mit history, sql, influxdb-Logging geht es nicht.
Muss evtl angepasst werden?
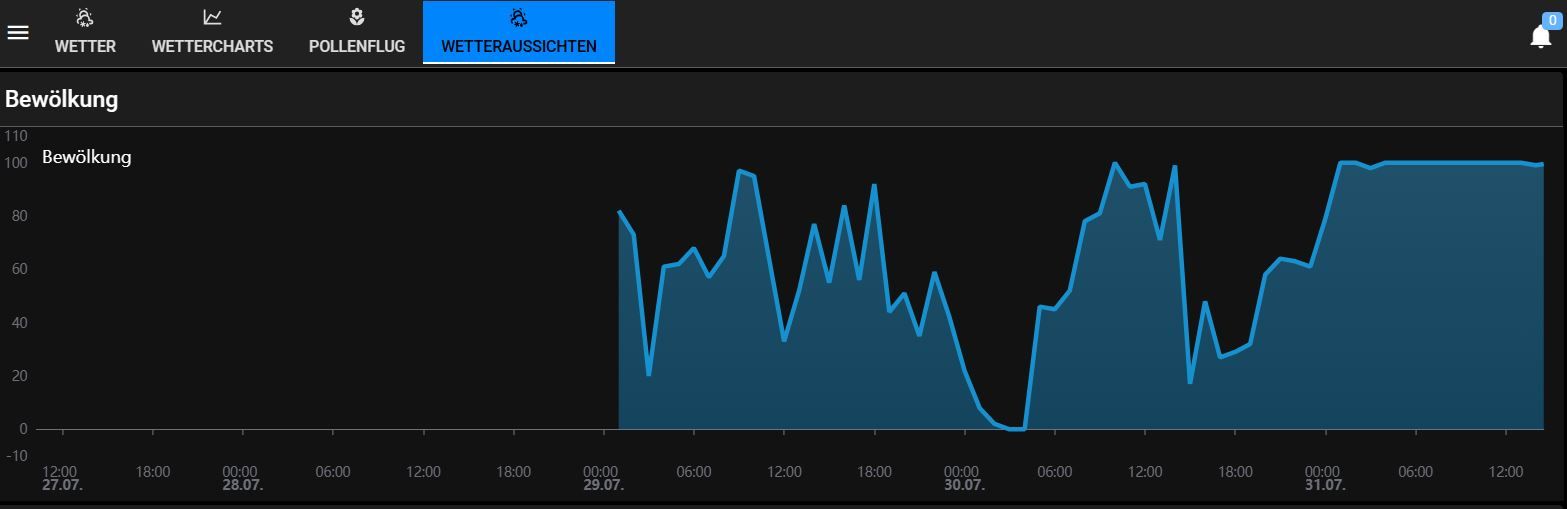
https://mcuiobroker.gitbook.io/jarvis-infos/tipps/scripte-blockly-javascript/javascript/history-adapter/daswetter-futurehistory@mcu hallo, Bild Diagramm ist aus Jarvis (historygraph), hier nur ein Datenpunkt. Meine Idee bzw. Wunsch war ist ein Diagramm am Beispiel der Bewölkung der nächsten 48 Stunden aus z.B. dem YR-Wetteradapter, Dann müsste ich aber eine Vielzahl von Datenpunkten in history packen.
Oder könnte man die vielen Datenpunkte in einem anderen Format sammeln und dann grafisch darstellen? JSON, HTML-Tabelle oder ähnliches?
-
@mcu hallo, Bild Diagramm ist aus Jarvis (historygraph), hier nur ein Datenpunkt. Meine Idee bzw. Wunsch war ist ein Diagramm am Beispiel der Bewölkung der nächsten 48 Stunden aus z.B. dem YR-Wetteradapter, Dann müsste ich aber eine Vielzahl von Datenpunkten in history packen.
Oder könnte man die vielen Datenpunkte in einem anderen Format sammeln und dann grafisch darstellen? JSON, HTML-Tabelle oder ähnliches?
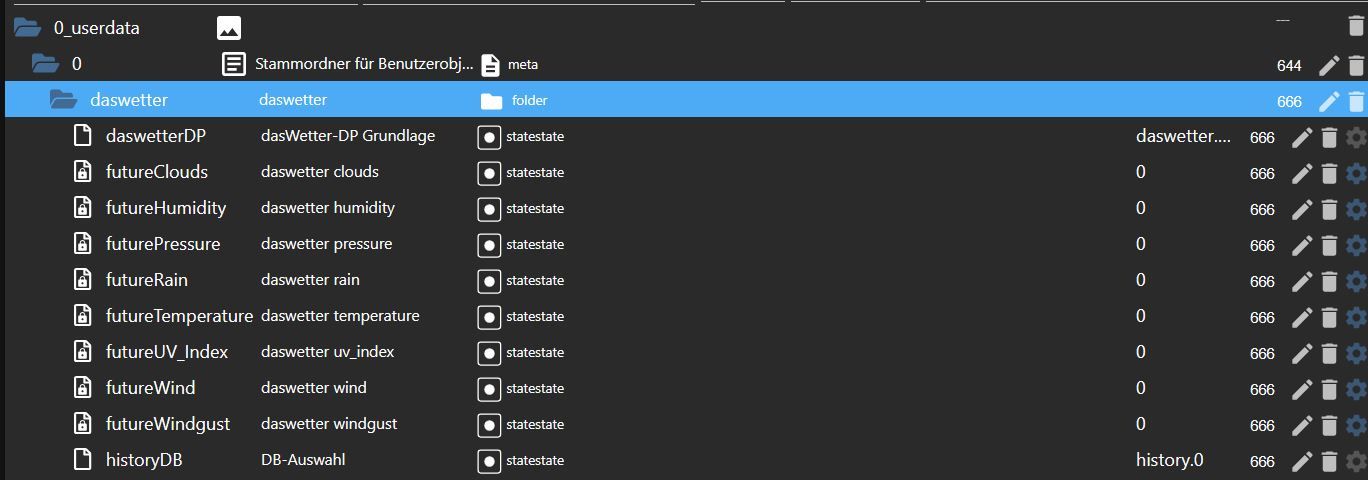
@flkontakt Ja kann man , muss man aber halt programmieren. Für den dasWetter-Adapter habe ich das ja schon gemacht siehe Link.
Was soll man da nehmen?
NUC i7 64GB mit Proxmox ---- Jarvis Infos Aktualisierungen der Doku auf Instagram verfolgen -> mcuiobroker Instagram
Wenn Euch mein Vorschlag geholfen hat, bitte rechts "^" klicken. -
@flkontakt Ja kann man , muss man aber halt programmieren. Für den dasWetter-Adapter habe ich das ja schon gemacht siehe Link.
Was soll man da nehmen?
-
@mcu Hallo, sorry für die doofen Fragen: Wo füge ich dein Script ein, wie sieht dann das Ergebnis aus, welches Widget wird benutzt? Ich sehe in deinem Script die Datenpunkte des YR-Adapters, ist das bereits auf diesen Adapter angepasst?
Danke!
@flkontakt
https://mcuiobroker.gitbook.io/jarvis-infos/tipps/scripte-blockly-javascript/javascript/history-adapter/daswetter-futurehistory#todo
Wo siehst du DPs vom YR?
Der Wert soll als Future angezeigt werden?NUC i7 64GB mit Proxmox ---- Jarvis Infos Aktualisierungen der Doku auf Instagram verfolgen -> mcuiobroker Instagram
Wenn Euch mein Vorschlag geholfen hat, bitte rechts "^" klicken. -
@mcu habe das Script getestet, Ergebnis sieht gut aus, tolles Script!!! Könntest du noch 2 Datenpunkte ergänzen? clouds_value und windgust_value?
Vielen Dank!
@flkontakt Versuch mal das neue v1.0.7.
Zunächst als Extra Script
https://mcuiobroker.gitbook.io/jarvis-infos/tipps/scripte-blockly-javascript/javascript/history-adapter/daswetter-futurehistory/javascript-setfuturehistory-v1.0.7Bitte die Einstellungen vom HistoryGraph reinstellen. Danke.
Gibt es gravierende Unterschiede zum yr? Muss man yr als Alternative anbieten?
NUC i7 64GB mit Proxmox ---- Jarvis Infos Aktualisierungen der Doku auf Instagram verfolgen -> mcuiobroker Instagram
Wenn Euch mein Vorschlag geholfen hat, bitte rechts "^" klicken. -
@flkontakt Versuch mal das neue v1.0.7.
Zunächst als Extra Script
https://mcuiobroker.gitbook.io/jarvis-infos/tipps/scripte-blockly-javascript/javascript/history-adapter/daswetter-futurehistory/javascript-setfuturehistory-v1.0.7Bitte die Einstellungen vom HistoryGraph reinstellen. Danke.
Gibt es gravierende Unterschiede zum yr? Muss man yr als Alternative anbieten?
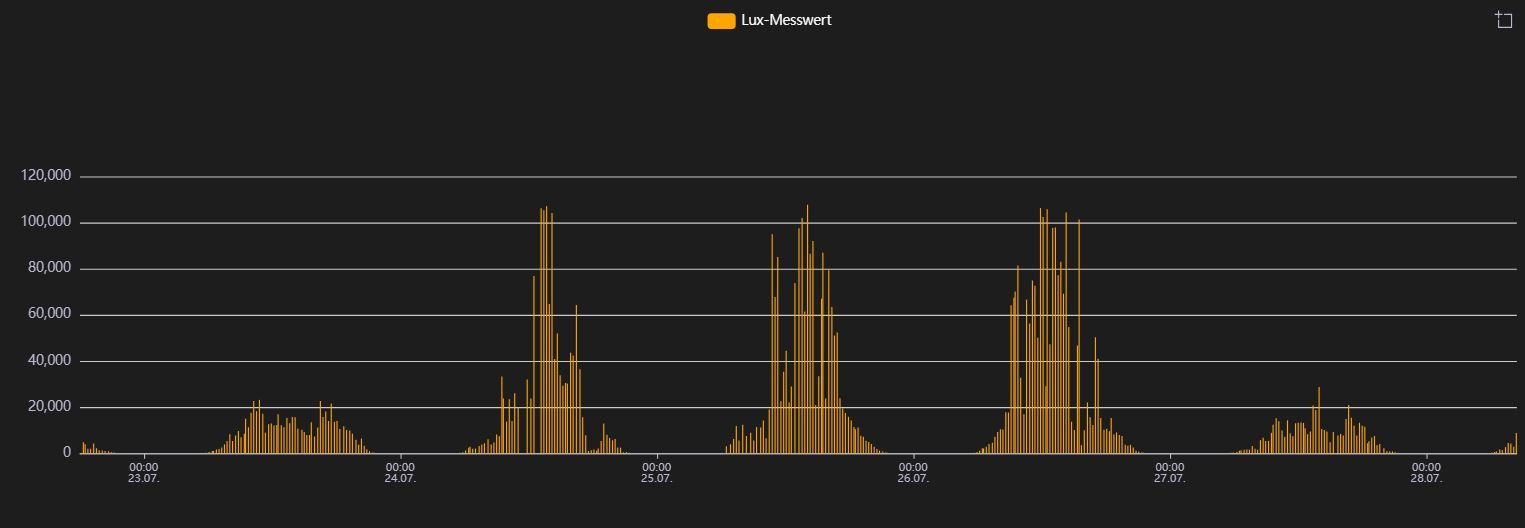
@mcu Hallo, Test durchgeführt, Werte stehen in eCharts auch zur Verfügung. Habe ein Preset in Jarvis integriert (iframe), Ergebnis passt auch soweit, werde noch optische Anpassungen vornehmen. Eine Nutzung direkt im Jarvis-Widget wäre super, dann hat man einen einheitlichen Look, Preset per iframe hat kurze Ladezeiten, dass Jarvis-Widget ist etwas schneller.
Mir ist aufgefallen, dass in den aus dem Script angelegten Datenpunkten keine Werte stehen.
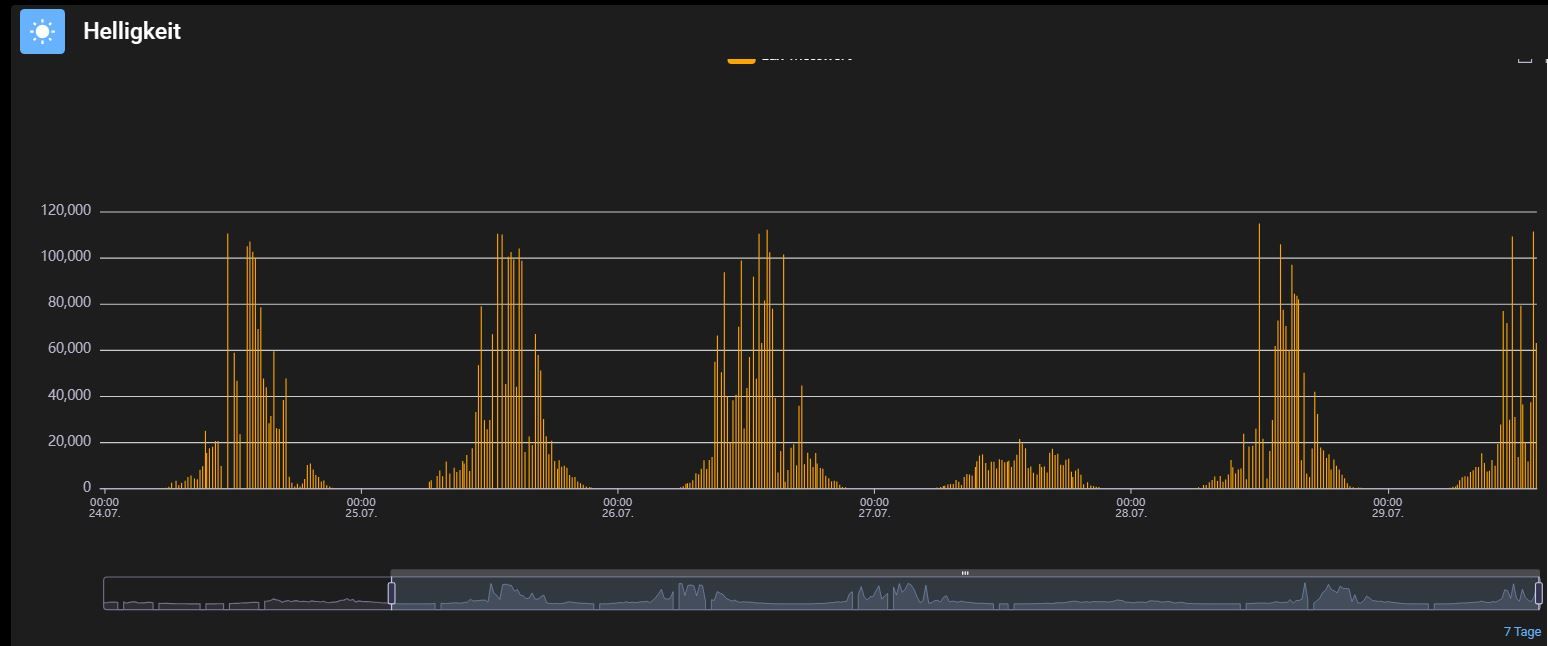
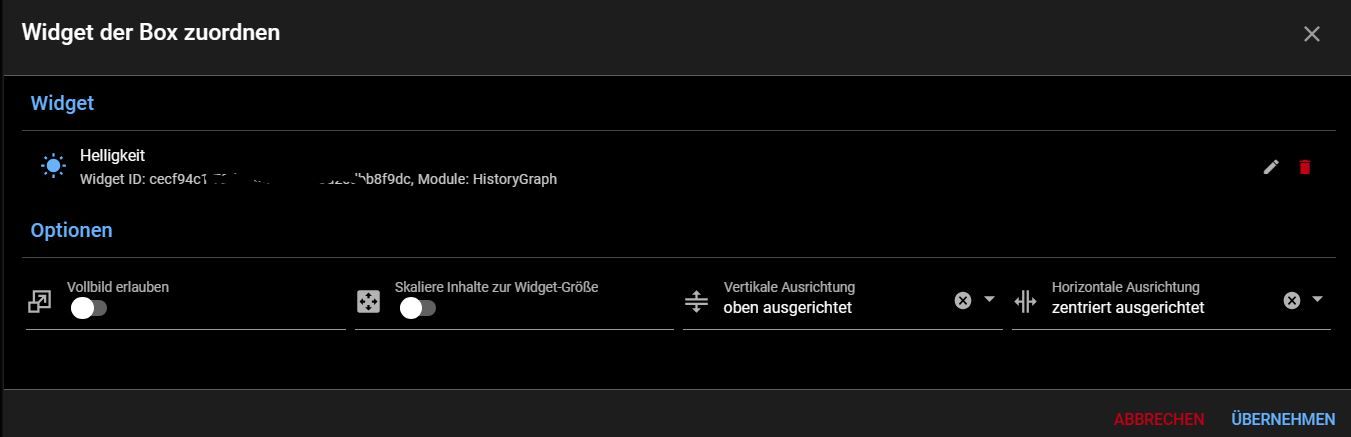
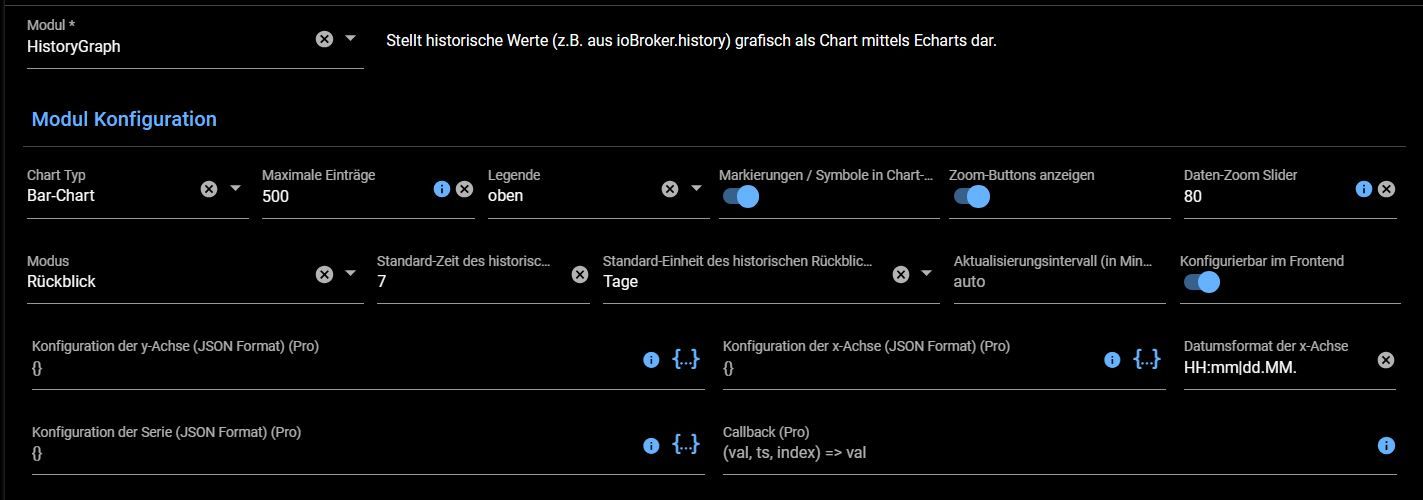
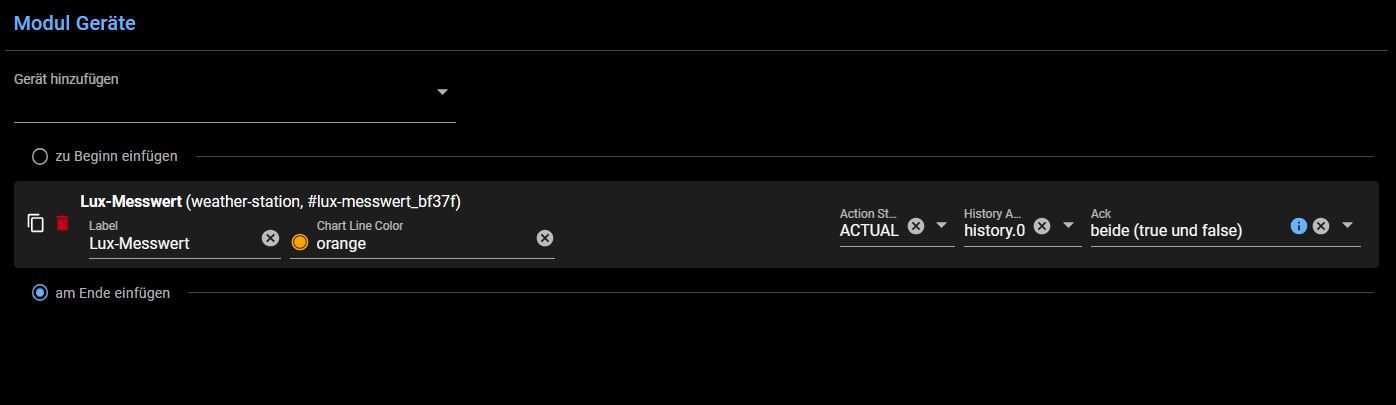
Welche Einstellungen von HistoryGraph benötigst du? Ich stelle hier ein paar Screenshots meiner Lux-Messung ein, bitte melden wenn etwas fehlen sollte.
Vielen Dank für die Unterstützung!
-
@flkontakt sagte in Jarvis v3.1.8, Datenpunkte in Diagramm ohne history möglich?:
Mir ist aufgefallen, dass in den aus dem Script angelegten Datenpunkten keine Werte stehen
Die Werte sollen ja auch nur in der History vom DP stehen.
Bewölkung ist jetzt ein iFrame? eCharts?NUC i7 64GB mit Proxmox ---- Jarvis Infos Aktualisierungen der Doku auf Instagram verfolgen -> mcuiobroker Instagram
Wenn Euch mein Vorschlag geholfen hat, bitte rechts "^" klicken. -
@flkontakt sagte in Jarvis v3.1.8, Datenpunkte in Diagramm ohne history möglich?:
Mir ist aufgefallen, dass in den aus dem Script angelegten Datenpunkten keine Werte stehen
Die Werte sollen ja auch nur in der History vom DP stehen.
Bewölkung ist jetzt ein iFrame? eCharts? -
@flkontakt Und das hättest du gerne als HistoryGraph?
NUC i7 64GB mit Proxmox ---- Jarvis Infos Aktualisierungen der Doku auf Instagram verfolgen -> mcuiobroker Instagram
Wenn Euch mein Vorschlag geholfen hat, bitte rechts "^" klicken. -
@flkontakt Und das hättest du gerne als HistoryGraph?
-
@flkontakt Du hast Pro?
NUC i7 64GB mit Proxmox ---- Jarvis Infos Aktualisierungen der Doku auf Instagram verfolgen -> mcuiobroker Instagram
Wenn Euch mein Vorschlag geholfen hat, bitte rechts "^" klicken. -
@flkontakt Du hast Pro?
-
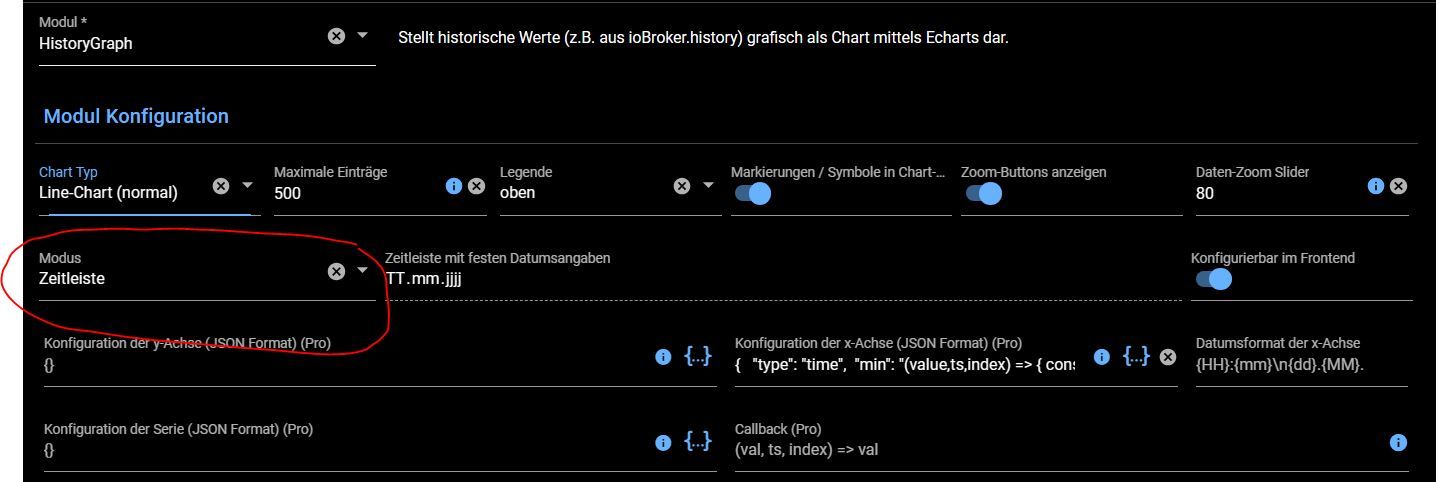
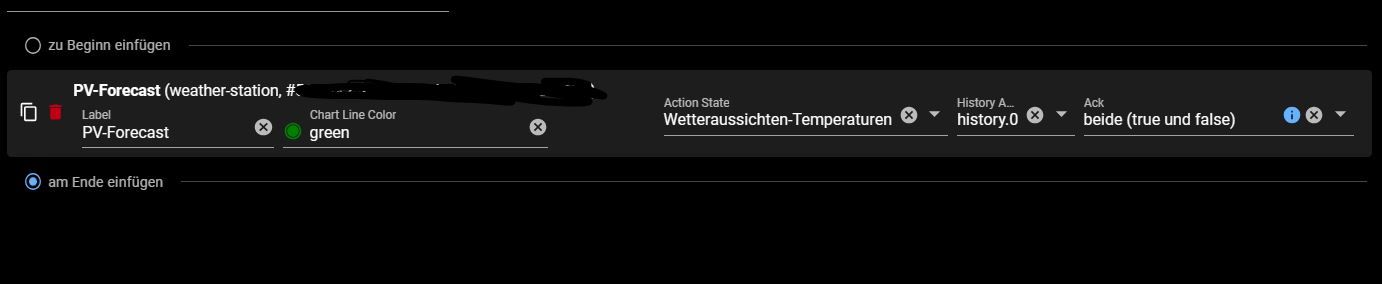
@flkontakt Ok dann nimm mal ein HistoryGraph mit dem furtureDP und setze dies in die x-Achse.
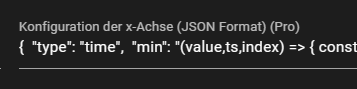
{
  "type": "time",
  "min": "(value,ts,index) => { const now = new Date(new Date().getTime()); return new Date(now.getFullYear(), now.getMonth(), now.getDate()).getTime()}",
  "max": "(value,ts,index) => { const now = new Date(new Date().getTime()); return new Date(now.getFullYear(), now.getMonth(), now.getDate()+6).getTime()}"
}
Bitte Ergebnis posten.
NUC i7 64GB mit Proxmox ---- Jarvis Infos Aktualisierungen der Doku auf Instagram verfolgen -> mcuiobroker Instagram
Wenn Euch mein Vorschlag geholfen hat, bitte rechts "^" klicken. -
@flkontakt Ok dann nimm mal ein HistoryGraph mit dem furtureDP und setze dies in die x-Achse.
{
  "type": "time",
  "min": "(value,ts,index) => { const now = new Date(new Date().getTime()); return new Date(now.getFullYear(), now.getMonth(), now.getDate()).getTime()}",
  "max": "(value,ts,index) => { const now = new Date(new Date().getTime()); return new Date(now.getFullYear(), now.getMonth(), now.getDate()+6).getTime()}"
}
Bitte Ergebnis posten.
-
@mcu Hallo, siehe Bilder, bleibt leider leer. In den Widgeteinstellungen kann ich zwischen Modus Rückblick und Zeitleiste wählen, in beiden Fällen werden keine Werte angezeigt. Anwenderfehler?
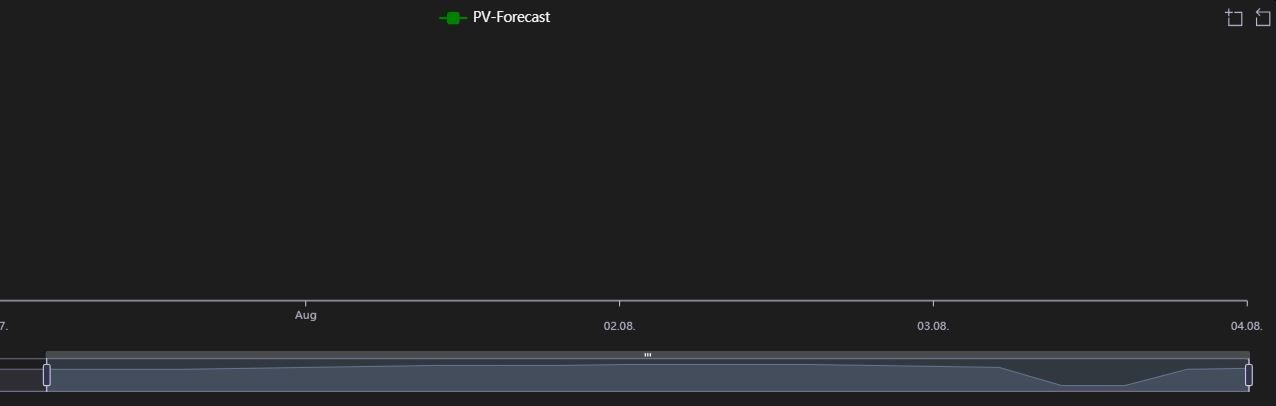
@flkontakt Nee, dann ist es doch noch intern nur für die Vergangenheit eingestellt. Tja, dann muss beim eChart bleiben.
NUC i7 64GB mit Proxmox ---- Jarvis Infos Aktualisierungen der Doku auf Instagram verfolgen -> mcuiobroker Instagram
Wenn Euch mein Vorschlag geholfen hat, bitte rechts "^" klicken. -
@flkontakt Nee, dann ist es doch noch intern nur für die Vergangenheit eingestellt. Tja, dann muss beim eChart bleiben.
Hey! Du scheinst an dieser Unterhaltung interessiert zu sein, hast aber noch kein Konto.
Hast du es satt, bei jedem Besuch durch die gleichen Beiträge zu scrollen? Wenn du dich für ein Konto anmeldest, kommst du immer genau dorthin zurück, wo du zuvor warst, und kannst dich über neue Antworten benachrichtigen lassen (entweder per E-Mail oder Push-Benachrichtigung). Du kannst auch Lesezeichen speichern und Beiträge positiv bewerten, um anderen Community-Mitgliedern deine Wertschätzung zu zeigen.
Mit deinem Input könnte dieser Beitrag noch besser werden 💗
Registrieren AnmeldenSupport us
445
Online33.0k
Benutzer83.3k
Themen1.3m
Beiträge