NEWS


Solarprognose
-
Entschuldige bitte wenn ich hier die Begrifflichkeiten nicht korrekt verwende.
Ja, absolut korrekt. Zum Testen habe ich manuell einen Datenpunkt angelegt:"name": "Solar Prognose", "role": "table", "type": "object", "read": true, "write": true "_id": "0_userdata.0.Solar.objekt", "type": "state"und als Wert den von dir genannten Strin (?) hinterlegt. Diesen neuen Datensatz dann im "JSON Graph Widget" hinterlegt.
Heraus kam genau der gewünschte Prognose Graph.@streit187 sagte: Ja, absolut korrekt.
Dann versuche es mal so:
const url = 'hier die komplette URL eintragen'; const path = '0_userdata.0.Solar.'; const idLeistung = path + 'Leistung'; const idEnergie = path + 'Energie'; var Leistung = { "axisLabels": ["8", "9", "10", "11", "12", "13", "14", "15", "16", "17", "18", "8", "9", "10", "11", "12", "13", "14", "15", "16", "17", "18"], "graphs": { "data": [0, 0, 0, 0, 0, 0, 0, 0, 0, 0, 0, 0, 0, 0, 0, 0, 0, 0, 0, 0, 0, 0], "type": "line", "yAxis_min": 0, "yAxis_max": 10, "yAxis_step": 1, "yAxis_position": "left", "yAxis_appendix": " kW", "datalabel_show": false } }; var Energie = { "axisLabels": ["8", "9", "10", "11", "12", "13", "14", "15", "16", "17", "18", "8", "9", "10", "11", "12", "13", "14", "15", "16", "17", "18"], "graphs": { "data": [0, 0, 0, 0, 0, 0, 0, 0, 0, 0, 0, 0, 0, 0, 0, 0, 0, 0, 0, 0, 0, 0], "type": "line", "yAxis_min": 0, "yAxis_max": 10, "yAxis_step": 1, "yAxis_position": "left", "yAxis_appendix": " kWh", "datalabel_show": false } }; if(!existsState(idLeistung)) createState(idLeistung, JSON.stringify(Leistung), {type: 'string', name: 'Leistung', role: 'table'}); if(!existsState(idEnergie)) createState(idEnergie, JSON.stringify(Energie), {type: 'string', name: 'Energie', role: 'table'}); schedule('16 4-22 * * *', function() { request(url, function (error, response, result) { if(error) log(error, 'error'); else { let obj = JSON.parse(result); if(obj.status) log('Fehler: ' + obj.status, 'warn'); else { let data = obj.data; Leistung.axisLabels = []; Leistung.graphs.data = []; Energie.axisLabels = []; Energie.graphs.data = []; for(let entry in data) { let time = formatDate(parseInt(entry), 'hh'); Leistung.axisLabels.push(time); Energie.axisLabels.push(time); Leistung.graphs.data.push(data[entry][0]); Energie.graphs.data.push(data[entry][1]); } setState(idLeistung, JSON.stringify(Leistung), true); setState(idEnergie, JSON.stringify(Energie), true); } } }); }); -
@streit187 sagte: Ja, absolut korrekt.
Dann versuche es mal so:
const url = 'hier die komplette URL eintragen'; const path = '0_userdata.0.Solar.'; const idLeistung = path + 'Leistung'; const idEnergie = path + 'Energie'; var Leistung = { "axisLabels": ["8", "9", "10", "11", "12", "13", "14", "15", "16", "17", "18", "8", "9", "10", "11", "12", "13", "14", "15", "16", "17", "18"], "graphs": { "data": [0, 0, 0, 0, 0, 0, 0, 0, 0, 0, 0, 0, 0, 0, 0, 0, 0, 0, 0, 0, 0, 0], "type": "line", "yAxis_min": 0, "yAxis_max": 10, "yAxis_step": 1, "yAxis_position": "left", "yAxis_appendix": " kW", "datalabel_show": false } }; var Energie = { "axisLabels": ["8", "9", "10", "11", "12", "13", "14", "15", "16", "17", "18", "8", "9", "10", "11", "12", "13", "14", "15", "16", "17", "18"], "graphs": { "data": [0, 0, 0, 0, 0, 0, 0, 0, 0, 0, 0, 0, 0, 0, 0, 0, 0, 0, 0, 0, 0, 0], "type": "line", "yAxis_min": 0, "yAxis_max": 10, "yAxis_step": 1, "yAxis_position": "left", "yAxis_appendix": " kWh", "datalabel_show": false } }; if(!existsState(idLeistung)) createState(idLeistung, JSON.stringify(Leistung), {type: 'string', name: 'Leistung', role: 'table'}); if(!existsState(idEnergie)) createState(idEnergie, JSON.stringify(Energie), {type: 'string', name: 'Energie', role: 'table'}); schedule('16 4-22 * * *', function() { request(url, function (error, response, result) { if(error) log(error, 'error'); else { let obj = JSON.parse(result); if(obj.status) log('Fehler: ' + obj.status, 'warn'); else { let data = obj.data; Leistung.axisLabels = []; Leistung.graphs.data = []; Energie.axisLabels = []; Energie.graphs.data = []; for(let entry in data) { let time = formatDate(parseInt(entry), 'hh'); Leistung.axisLabels.push(time); Energie.axisLabels.push(time); Leistung.graphs.data.push(data[entry][0]); Energie.graphs.data.push(data[entry][1]); } setState(idLeistung, JSON.stringify(Leistung), true); setState(idEnergie, JSON.stringify(Energie), true); } } }); });@paul53
Ein Traum! Du bist der Beste. Ich habe noch den Schedule angepasst und eine [] eingefügt beim Graphen. Läuft super.const url = 'hier die komplette URL eintragen'; const path = '0_userdata.0.Solar.'; const idLeistung = path + 'Leistung'; const idEnergie = path + 'Energie'; var Leistung = { "axisLabels": ["8", "9", "10", "11", "12", "13", "14", "15", "16", "17", "18", "8", "9", "10", "11", "12", "13", "14", "15", "16", "17", "18"], "graphs": [{ "data": [0, 0, 0, 0, 0, 0, 0, 0, 0, 0, 0, 0, 0, 0, 0, 0, 0, 0, 0, 0, 0, 0], "type": "line", "yAxis_min": 0, "yAxis_max": 10, "yAxis_step": 1, "yAxis_position": "left", "yAxis_appendix": " kW", "datalabel_show": false } ] }; var Energie = { "axisLabels": ["8", "9", "10", "11", "12", "13", "14", "15", "16", "17", "18", "8", "9", "10", "11", "12", "13", "14", "15", "16", "17", "18"], "graphs": [{ "data": [0, 0, 0, 0, 0, 0, 0, 0, 0, 0, 0, 0, 0, 0, 0, 0, 0, 0, 0, 0, 0, 0], "type": "line", "yAxis_min": 0, "yAxis_max": 10, "yAxis_step": 1, "yAxis_position": "left", "yAxis_appendix": " kWh", "datalabel_show": false } ] }; if(!existsState(idLeistung)) createState(idLeistung, JSON.stringify(Leistung), {type: 'string', name: 'Leistung', role: 'table'}); if(!existsState(idEnergie)) createState(idEnergie, JSON.stringify(Energie), {type: 'string', name: 'Energie', role: 'table'}); schedule('5 7-19 * * *', function() { request(url, function (error, response, result) { if(error) log(error, 'error'); else { let obj = JSON.parse(result); if(obj.status) log('Fehler: ' + obj.status, 'warn'); else { let data = obj.data; Leistung.axisLabels = []; Leistung.graphs.data = []; Energie.axisLabels = []; Energie.graphs.data = []; for(let entry in data) { let time = formatDate(parseInt(entry), 'hh'); Leistung.axisLabels.push(time); Energie.axisLabels.push(time); Leistung.graphs.data.push(data[entry][0]); Energie.graphs.data.push(data[entry][1]); } setState(idLeistung, JSON.stringify(Leistung), true); setState(idEnergie, JSON.stringify(Energie), true); } } }); });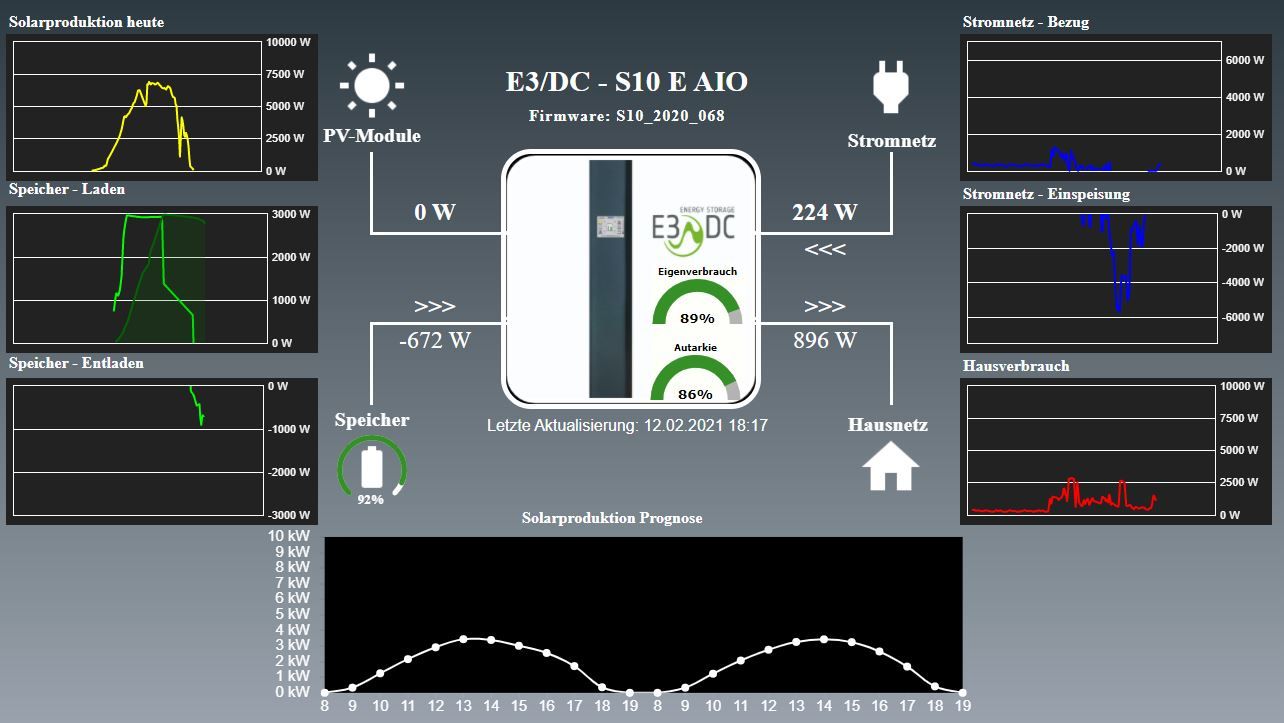
Vielen Dank
-
@paul53
Ein Traum! Du bist der Beste. Ich habe noch den Schedule angepasst und eine [] eingefügt beim Graphen. Läuft super.const url = 'hier die komplette URL eintragen'; const path = '0_userdata.0.Solar.'; const idLeistung = path + 'Leistung'; const idEnergie = path + 'Energie'; var Leistung = { "axisLabels": ["8", "9", "10", "11", "12", "13", "14", "15", "16", "17", "18", "8", "9", "10", "11", "12", "13", "14", "15", "16", "17", "18"], "graphs": [{ "data": [0, 0, 0, 0, 0, 0, 0, 0, 0, 0, 0, 0, 0, 0, 0, 0, 0, 0, 0, 0, 0, 0], "type": "line", "yAxis_min": 0, "yAxis_max": 10, "yAxis_step": 1, "yAxis_position": "left", "yAxis_appendix": " kW", "datalabel_show": false } ] }; var Energie = { "axisLabels": ["8", "9", "10", "11", "12", "13", "14", "15", "16", "17", "18", "8", "9", "10", "11", "12", "13", "14", "15", "16", "17", "18"], "graphs": [{ "data": [0, 0, 0, 0, 0, 0, 0, 0, 0, 0, 0, 0, 0, 0, 0, 0, 0, 0, 0, 0, 0, 0], "type": "line", "yAxis_min": 0, "yAxis_max": 10, "yAxis_step": 1, "yAxis_position": "left", "yAxis_appendix": " kWh", "datalabel_show": false } ] }; if(!existsState(idLeistung)) createState(idLeistung, JSON.stringify(Leistung), {type: 'string', name: 'Leistung', role: 'table'}); if(!existsState(idEnergie)) createState(idEnergie, JSON.stringify(Energie), {type: 'string', name: 'Energie', role: 'table'}); schedule('5 7-19 * * *', function() { request(url, function (error, response, result) { if(error) log(error, 'error'); else { let obj = JSON.parse(result); if(obj.status) log('Fehler: ' + obj.status, 'warn'); else { let data = obj.data; Leistung.axisLabels = []; Leistung.graphs.data = []; Energie.axisLabels = []; Energie.graphs.data = []; for(let entry in data) { let time = formatDate(parseInt(entry), 'hh'); Leistung.axisLabels.push(time); Energie.axisLabels.push(time); Leistung.graphs.data.push(data[entry][0]); Energie.graphs.data.push(data[entry][1]); } setState(idLeistung, JSON.stringify(Leistung), true); setState(idEnergie, JSON.stringify(Energie), true); } } }); });Vielen Dank
@streit187 sagte: eine [] eingefügt beim Graphen.
Wenn graphs ein Array mit einem Element ist, müssten Zeilen 47, 49, 54 und 55 angepasst werden.
Leistung.graphs[0].data.push(data[entry][0]); Energie.graphs[0].data.push(data[entry][1]); -
@streit187 sagte: eine [] eingefügt beim Graphen.
Wenn graphs ein Array mit einem Element ist, müssten Zeilen 47, 49, 54 und 55 angepasst werden.
Leistung.graphs[0].data.push(data[entry][0]); Energie.graphs[0].data.push(data[entry][1]);@paul53
Sehr gut. Erfolgreich getestet. Dann nur der Vollständigkeit halber nochmal das ganz Skriptconst url = 'hier die komplette URL eintragen'; const path = '0_userdata.0.Solar.'; const idLeistung = path + 'Leistung'; const idEnergie = path + 'Energie'; var Leistung = { "axisLabels": ["8", "9", "10", "11", "12", "13", "14", "15", "16", "17", "18", "8", "9", "10", "11", "12", "13", "14", "15", "16", "17", "18"], "graphs": [{ "data": [0, 0, 0, 0, 0, 0, 0, 0, 0, 0, 0, 0, 0, 0, 0, 0, 0, 0, 0, 0, 0, 0], "type": "line", "yAxis_min": 0, "yAxis_max": 10, "yAxis_step": 1, "yAxis_position": "left", "yAxis_appendix": " kW", "datalabel_show": false } ] }; var Energie = { "axisLabels": ["8", "9", "10", "11", "12", "13", "14", "15", "16", "17", "18", "8", "9", "10", "11", "12", "13", "14", "15", "16", "17", "18"], "graphs": [{ "data": [0, 0, 0, 0, 0, 0, 0, 0, 0, 0, 0, 0, 0, 0, 0, 0, 0, 0, 0, 0, 0, 0], "type": "line", "yAxis_min": 0, "yAxis_max": 10, "yAxis_step": 1, "yAxis_position": "left", "yAxis_appendix": " kWh", "datalabel_show": false } ] }; if(!existsState(idLeistung)) createState(idLeistung, JSON.stringify(Leistung), {type: 'string', name: 'Leistung', role: 'table'}); if(!existsState(idEnergie)) createState(idEnergie, JSON.stringify(Energie), {type: 'string', name: 'Energie', role: 'table'}); schedule('5 7-19 * * *', function() { request(url, function (error, response, result) { if(error) log(error, 'error'); else { let obj = JSON.parse(result); if(obj.status) log('Fehler: ' + obj.status, 'warn'); else { let data = obj.data; Leistung.axisLabels = []; Leistung.graphs[0].data = []; Energie.axisLabels = []; Energie.graphs[0].data = []; for(let entry in data) { let time = formatDate(parseInt(entry), 'hh'); Leistung.axisLabels.push(time); Energie.axisLabels.push(time); Leistung.graphs[0].data.push(data[entry][0]); Energie.graphs[0].data.push(data[entry][1]); } setState(idEnergie, JSON.stringify(Energie), true); setState(idLeistung, JSON.stringify(Leistung), true); } } }); }); -
@paul53
Sehr gut. Erfolgreich getestet. Dann nur der Vollständigkeit halber nochmal das ganz Skriptconst url = 'hier die komplette URL eintragen'; const path = '0_userdata.0.Solar.'; const idLeistung = path + 'Leistung'; const idEnergie = path + 'Energie'; var Leistung = { "axisLabels": ["8", "9", "10", "11", "12", "13", "14", "15", "16", "17", "18", "8", "9", "10", "11", "12", "13", "14", "15", "16", "17", "18"], "graphs": [{ "data": [0, 0, 0, 0, 0, 0, 0, 0, 0, 0, 0, 0, 0, 0, 0, 0, 0, 0, 0, 0, 0, 0], "type": "line", "yAxis_min": 0, "yAxis_max": 10, "yAxis_step": 1, "yAxis_position": "left", "yAxis_appendix": " kW", "datalabel_show": false } ] }; var Energie = { "axisLabels": ["8", "9", "10", "11", "12", "13", "14", "15", "16", "17", "18", "8", "9", "10", "11", "12", "13", "14", "15", "16", "17", "18"], "graphs": [{ "data": [0, 0, 0, 0, 0, 0, 0, 0, 0, 0, 0, 0, 0, 0, 0, 0, 0, 0, 0, 0, 0, 0], "type": "line", "yAxis_min": 0, "yAxis_max": 10, "yAxis_step": 1, "yAxis_position": "left", "yAxis_appendix": " kWh", "datalabel_show": false } ] }; if(!existsState(idLeistung)) createState(idLeistung, JSON.stringify(Leistung), {type: 'string', name: 'Leistung', role: 'table'}); if(!existsState(idEnergie)) createState(idEnergie, JSON.stringify(Energie), {type: 'string', name: 'Energie', role: 'table'}); schedule('5 7-19 * * *', function() { request(url, function (error, response, result) { if(error) log(error, 'error'); else { let obj = JSON.parse(result); if(obj.status) log('Fehler: ' + obj.status, 'warn'); else { let data = obj.data; Leistung.axisLabels = []; Leistung.graphs[0].data = []; Energie.axisLabels = []; Energie.graphs[0].data = []; for(let entry in data) { let time = formatDate(parseInt(entry), 'hh'); Leistung.axisLabels.push(time); Energie.axisLabels.push(time); Leistung.graphs[0].data.push(data[entry][0]); Energie.graphs[0].data.push(data[entry][1]); } setState(idEnergie, JSON.stringify(Energie), true); setState(idLeistung, JSON.stringify(Leistung), true); } } }); });@streit187 sagte in Solarprognose:
const url = 'hier die komplette URL eintragen';
Welche URL kommt denn in das aktuelle Script?
-
@streit187 sagte in Solarprognose:
const url = 'hier die komplette URL eintragen';
Welche URL kommt denn in das aktuelle Script?
@wendy2702
Nach einer kostenlosen Registrierung und Eingabe der Daten deiner PV Anlage (Ort, Neigung, Ausrichtung) auf www.solarprognose.de bekommst du eine URL die so aussieht mit deinem eigenen Token:
http://www.solarprognose.de/web/solarprediction/api/v1?_format=json&access-token=CZCCYr2Iucnx5Exxxxxxxxx&item=location&id=160&type=hourly -
@wendy2702
Nach einer kostenlosen Registrierung und Eingabe der Daten deiner PV Anlage (Ort, Neigung, Ausrichtung) auf www.solarprognose.de bekommst du eine URL die so aussieht mit deinem eigenen Token:
http://www.solarprognose.de/web/solarprediction/api/v1?_format=json&access-token=CZCCYr2Iucnx5Exxxxxxxxx&item=location&id=160&type=hourly@streit187 Danke!
-
@streit187 Danke!
@wendy2702
Falls deine Prognosedaten viel zu gering sind füge deiner URL noch "&algorithm=mosmix" hinzu. Das hat wenigstens bei mir zu wesentlich realistischeren Werten geführt.@apollon77
Darf ich dich hier nochmal um deiner Unterstützung bitten. Ich steige beim auswerten der JSON Daten einfach nicht durch.
Ich hätte gerne zwei weitere Datenpunkte welche als Wert den jeweils letzten und damit höchsten Wert aus dem zweiten Array(?) enthält. Ich glaube im Skript werden die beiden Array mit 0 und 1 unterschieden. Dann wäre es von 1.
Einmal von heute 18 Uhr (13er Wert) und einen von morgen 18 Uhr (26er Wert).
path=0_userdata.0.Solar
name=Gesamt kWh heute / Gesamt kWh morgen
Das darf gerne im gleichen Skript passieren damit die Daten nicht noch Einmal abgerufen werden und den gleichen schedule nutzen. -
@wendy2702
Falls deine Prognosedaten viel zu gering sind füge deiner URL noch "&algorithm=mosmix" hinzu. Das hat wenigstens bei mir zu wesentlich realistischeren Werten geführt.@apollon77
Darf ich dich hier nochmal um deiner Unterstützung bitten. Ich steige beim auswerten der JSON Daten einfach nicht durch.
Ich hätte gerne zwei weitere Datenpunkte welche als Wert den jeweils letzten und damit höchsten Wert aus dem zweiten Array(?) enthält. Ich glaube im Skript werden die beiden Array mit 0 und 1 unterschieden. Dann wäre es von 1.
Einmal von heute 18 Uhr (13er Wert) und einen von morgen 18 Uhr (26er Wert).
path=0_userdata.0.Solar
name=Gesamt kWh heute / Gesamt kWh morgen
Das darf gerne im gleichen Skript passieren damit die Daten nicht noch Einmal abgerufen werden und den gleichen schedule nutzen.@streit187 Danke!
-
@wendy2702
Falls deine Prognosedaten viel zu gering sind füge deiner URL noch "&algorithm=mosmix" hinzu. Das hat wenigstens bei mir zu wesentlich realistischeren Werten geführt.@apollon77
Darf ich dich hier nochmal um deiner Unterstützung bitten. Ich steige beim auswerten der JSON Daten einfach nicht durch.
Ich hätte gerne zwei weitere Datenpunkte welche als Wert den jeweils letzten und damit höchsten Wert aus dem zweiten Array(?) enthält. Ich glaube im Skript werden die beiden Array mit 0 und 1 unterschieden. Dann wäre es von 1.
Einmal von heute 18 Uhr (13er Wert) und einen von morgen 18 Uhr (26er Wert).
path=0_userdata.0.Solar
name=Gesamt kWh heute / Gesamt kWh morgen
Das darf gerne im gleichen Skript passieren damit die Daten nicht noch Einmal abgerufen werden und den gleichen schedule nutzen.Das ist vermutlich nicht schön aber es tut was es soll. Leider nur an einem Tag weil das Objekt direkt aufgerufen wird.
Wie kann ich denn hier die Objekt Nummer aufrufen ähnlich der Eigenschaft mit [0[ bzw. [1]?const url = 'http://www.solarprognose.de/web/solarprediction/api/v1?_format=json&......'; const path = '0_userdata.0.Solar.'; const idLeistung = path + 'Leistung'; const idEnergie = path + 'Energie'; const idEnergieMaxHeute = path + 'EnergieMaxHeute'; const idEnergieMaxMorgen = path + 'EnergieMaxMorgen'; var Leistung = { "axisLabels": ["8", "9", "10", "11", "12", "13", "14", "15", "16", "17", "18", "8", "9", "10", "11", "12", "13", "14", "15", "16", "17", "18"], "graphs": [{ "data": [0, 0, 0, 0, 0, 0, 0, 0, 0, 0, 0, 0, 0, 0, 0, 0, 0, 0, 0, 0, 0, 0], "type": "line", "yAxis_min": 0, "yAxis_max": 10, "yAxis_step": 1, "yAxis_position": "left", "yAxis_appendix": " kW", "datalabel_show": false } ] }; var Energie = { "axisLabels": ["8", "9", "10", "11", "12", "13", "14", "15", "16", "17", "18", "8", "9", "10", "11", "12", "13", "14", "15", "16", "17", "18"], "graphs": [{ "data": [0, 0, 0, 0, 0, 0, 0, 0, 0, 0, 0, 0, 0, 0, 0, 0, 0, 0, 0, 0, 0, 0], "type": "line", "yAxis_min": 0, "yAxis_max": 10, "yAxis_step": 1, "yAxis_position": "left", "yAxis_appendix": " kWh", "datalabel_show": false } ] }; if(!existsState(idLeistung)) createState(idLeistung, JSON.stringify(Leistung), {type: 'string', name: 'Leistung', role: 'table'}); if(!existsState(idEnergie)) createState(idEnergie, JSON.stringify(Energie), {type: 'string', name: 'Energie', role: 'table'}); schedule('5 7-19 * * *', function() { request(url, function (error, response, result) { if(error) log(error, 'error'); else { let obj = JSON.parse(result); if(obj.status) log('Fehler: ' + obj.status, 'warn'); else { let data = obj.data; Leistung.axisLabels = []; Leistung.graphs[0].data = []; Energie.axisLabels = []; Energie.graphs[0].data = []; for(let entry in data) { let time = formatDate(parseInt(entry), 'hh'); Leistung.axisLabels.push(time); Energie.axisLabels.push(time); Leistung.graphs[0].data.push(data[entry][0]); Energie.graphs[0].data.push(data[entry][1]); if(existsState(idEnergieMaxHeute)) setState(idEnergieMaxHeute, data[1614621600][1], true); else createState(idEnergieMaxHeute, data[1614621600][1], { type: 'number', role: 'value', name: 'EnergieMaxHeute', read: true, write: false, unit: 'kWh' }); if(existsState(idEnergieMaxMorgen)) setState(idEnergieMaxMorgen, data[1614708000][1], true); else createState(idEnergieMaxMorgen, data[1614708000][1], { type: 'number', role: 'value', name: 'EnergieMaxMorgen', read: true, write: false, unit: 'kWh' }); } setState(idEnergie, JSON.stringify(Energie), true); setState(idLeistung, JSON.stringify(Leistung), true); } } }); }); -
Das ist vermutlich nicht schön aber es tut was es soll. Leider nur an einem Tag weil das Objekt direkt aufgerufen wird.
Wie kann ich denn hier die Objekt Nummer aufrufen ähnlich der Eigenschaft mit [0[ bzw. [1]?const url = 'http://www.solarprognose.de/web/solarprediction/api/v1?_format=json&......'; const path = '0_userdata.0.Solar.'; const idLeistung = path + 'Leistung'; const idEnergie = path + 'Energie'; const idEnergieMaxHeute = path + 'EnergieMaxHeute'; const idEnergieMaxMorgen = path + 'EnergieMaxMorgen'; var Leistung = { "axisLabels": ["8", "9", "10", "11", "12", "13", "14", "15", "16", "17", "18", "8", "9", "10", "11", "12", "13", "14", "15", "16", "17", "18"], "graphs": [{ "data": [0, 0, 0, 0, 0, 0, 0, 0, 0, 0, 0, 0, 0, 0, 0, 0, 0, 0, 0, 0, 0, 0], "type": "line", "yAxis_min": 0, "yAxis_max": 10, "yAxis_step": 1, "yAxis_position": "left", "yAxis_appendix": " kW", "datalabel_show": false } ] }; var Energie = { "axisLabels": ["8", "9", "10", "11", "12", "13", "14", "15", "16", "17", "18", "8", "9", "10", "11", "12", "13", "14", "15", "16", "17", "18"], "graphs": [{ "data": [0, 0, 0, 0, 0, 0, 0, 0, 0, 0, 0, 0, 0, 0, 0, 0, 0, 0, 0, 0, 0, 0], "type": "line", "yAxis_min": 0, "yAxis_max": 10, "yAxis_step": 1, "yAxis_position": "left", "yAxis_appendix": " kWh", "datalabel_show": false } ] }; if(!existsState(idLeistung)) createState(idLeistung, JSON.stringify(Leistung), {type: 'string', name: 'Leistung', role: 'table'}); if(!existsState(idEnergie)) createState(idEnergie, JSON.stringify(Energie), {type: 'string', name: 'Energie', role: 'table'}); schedule('5 7-19 * * *', function() { request(url, function (error, response, result) { if(error) log(error, 'error'); else { let obj = JSON.parse(result); if(obj.status) log('Fehler: ' + obj.status, 'warn'); else { let data = obj.data; Leistung.axisLabels = []; Leistung.graphs[0].data = []; Energie.axisLabels = []; Energie.graphs[0].data = []; for(let entry in data) { let time = formatDate(parseInt(entry), 'hh'); Leistung.axisLabels.push(time); Energie.axisLabels.push(time); Leistung.graphs[0].data.push(data[entry][0]); Energie.graphs[0].data.push(data[entry][1]); if(existsState(idEnergieMaxHeute)) setState(idEnergieMaxHeute, data[1614621600][1], true); else createState(idEnergieMaxHeute, data[1614621600][1], { type: 'number', role: 'value', name: 'EnergieMaxHeute', read: true, write: false, unit: 'kWh' }); if(existsState(idEnergieMaxMorgen)) setState(idEnergieMaxMorgen, data[1614708000][1], true); else createState(idEnergieMaxMorgen, data[1614708000][1], { type: 'number', role: 'value', name: 'EnergieMaxMorgen', read: true, write: false, unit: 'kWh' }); } setState(idEnergie, JSON.stringify(Energie), true); setState(idLeistung, JSON.stringify(Leistung), true); } } }); });@streit187 sagte in Solarprognose:
Das ist vermutlich nicht schön aber es tut was es soll. Leider nur an einem Tag weil das Objekt direkt aufgerufen wird.
Wie kann ich denn hier die Objekt Nummer aufrufen ähnlich der Eigenschaft mit [0[ bzw. [1]?Dank an alle - ich habe mir hier für ein interessantes Thema viel abgeschaut und beide Grafen in ein Diagramm zusammengefasst:
Hier eine Lösung für die zwei weiteren DP; ob sie auf Dauer funktioniert, sehe ich dann morgen mit neuen Daten.
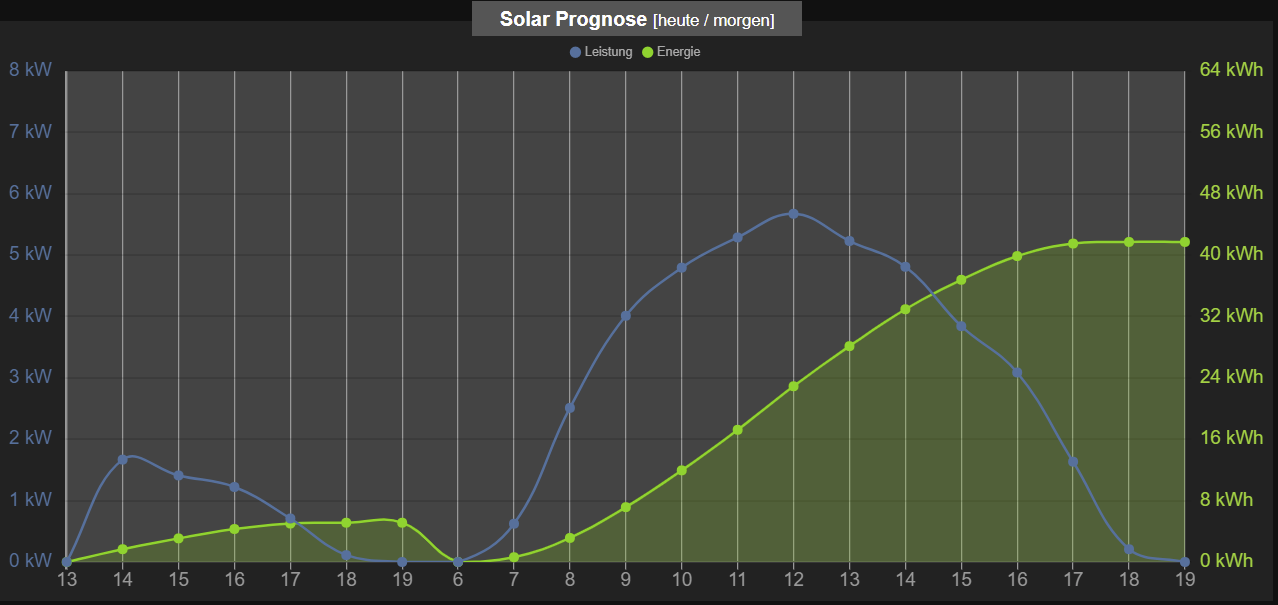
const url = 'http://www.solarprognose.de/web/solarprediction/api/v1?_format=json&access-token=....&item=inverter&id=412&type=hourly'; const path = '0_userdata.0.SolarGraph.'; const idLeistung_Energie = path + 'Leistung_Energie'; const idEnergieMaxHeute = path + 'EnergieMaxHeute'; const idEnergieMaxMorgen = path + 'EnergieMaxMorgen'; var Leistung_Energie = { "axisLabels": ["8", "9", "10", "11", "12", "13", "14", "15", "16", "17", "18", "8", "9", "10", "11", "12", "13", "14", "15", "16", "17", "18"], "graphs": [{ "data": [0, 0, 0, 0, 0, 0, 0, 0, 0, 0, 0, 0, 0, 0, 0, 0, 0, 0, 0, 0, 0, 0], "type": "line", "legendText":"Leistung", "yAxis_min": 0, "yAxis_max": 8, "yAxis_step": 1, "yAxis_position": "left", "yAxis_appendix": " kW", "datalabel_show": false }, { "data": [0, 0, 0, 0, 0, 0, 0, 0, 0, 0, 0, 0, 0, 0, 0, 0, 0, 0, 0, 0, 0, 0], "type": "line", "line_UseFillColor": true, "legendText":"Energie", "yAxis_min": 0, "yAxis_max": 64, "yAxis_step": 8, "yAxis_position": "right", "yAxis_appendix": " kWh", "yAxis_color": "#91d430", "datalabel_show": false } ] }; createState(idLeistung_Energie, JSON.stringify(Leistung_Energie), {type: 'string', name: 'Leistung_Energie', role: 'table'}); createState(idEnergieMaxHeute, 0, {type: 'number', role: 'value', name: 'EnergieMaxHeute', read: true, write: false, unit: 'kWh'}); createState(idEnergieMaxMorgen, 0, {type: 'number', role: 'value', name: 'EnergieMaxMorgen', read: true, write: false, unit: 'kWh'}); schedule('5 7,9,12,14,16,18 * * *', function() { request(url, function (error, response, result) { if(error) log(error, 'error'); else { let obj = JSON.parse(result); if(obj.status) log('Fehler: ' + obj.status, 'warn'); else { let data = obj.data; Leistung_Energie.axisLabels = []; Leistung_Energie.graphs[0].data = []; Leistung_Energie.graphs[1].data = []; let i = 0; for(let entry in data) { let time = formatDate(parseInt(entry), 'hh'); Leistung_Energie.axisLabels.push(time); Leistung_Energie.graphs[0].data.push(data[entry][0]); Leistung_Energie.graphs[1].data.push(data[entry][1]); if (time == '19') if (i == 0) { setState(idEnergieMaxHeute, data[entry][1], true); i = i+1 } else setState(idEnergieMaxMorgen, data[entry][1], true); } setState(idLeistung_Energie, JSON.stringify(Leistung_Energie), true); } } }); }); -
@streit187 sagte in Solarprognose:
Das ist vermutlich nicht schön aber es tut was es soll. Leider nur an einem Tag weil das Objekt direkt aufgerufen wird.
Wie kann ich denn hier die Objekt Nummer aufrufen ähnlich der Eigenschaft mit [0[ bzw. [1]?Dank an alle - ich habe mir hier für ein interessantes Thema viel abgeschaut und beide Grafen in ein Diagramm zusammengefasst:
Hier eine Lösung für die zwei weiteren DP; ob sie auf Dauer funktioniert, sehe ich dann morgen mit neuen Daten.
const url = 'http://www.solarprognose.de/web/solarprediction/api/v1?_format=json&access-token=....&item=inverter&id=412&type=hourly'; const path = '0_userdata.0.SolarGraph.'; const idLeistung_Energie = path + 'Leistung_Energie'; const idEnergieMaxHeute = path + 'EnergieMaxHeute'; const idEnergieMaxMorgen = path + 'EnergieMaxMorgen'; var Leistung_Energie = { "axisLabels": ["8", "9", "10", "11", "12", "13", "14", "15", "16", "17", "18", "8", "9", "10", "11", "12", "13", "14", "15", "16", "17", "18"], "graphs": [{ "data": [0, 0, 0, 0, 0, 0, 0, 0, 0, 0, 0, 0, 0, 0, 0, 0, 0, 0, 0, 0, 0, 0], "type": "line", "legendText":"Leistung", "yAxis_min": 0, "yAxis_max": 8, "yAxis_step": 1, "yAxis_position": "left", "yAxis_appendix": " kW", "datalabel_show": false }, { "data": [0, 0, 0, 0, 0, 0, 0, 0, 0, 0, 0, 0, 0, 0, 0, 0, 0, 0, 0, 0, 0, 0], "type": "line", "line_UseFillColor": true, "legendText":"Energie", "yAxis_min": 0, "yAxis_max": 64, "yAxis_step": 8, "yAxis_position": "right", "yAxis_appendix": " kWh", "yAxis_color": "#91d430", "datalabel_show": false } ] }; createState(idLeistung_Energie, JSON.stringify(Leistung_Energie), {type: 'string', name: 'Leistung_Energie', role: 'table'}); createState(idEnergieMaxHeute, 0, {type: 'number', role: 'value', name: 'EnergieMaxHeute', read: true, write: false, unit: 'kWh'}); createState(idEnergieMaxMorgen, 0, {type: 'number', role: 'value', name: 'EnergieMaxMorgen', read: true, write: false, unit: 'kWh'}); schedule('5 7,9,12,14,16,18 * * *', function() { request(url, function (error, response, result) { if(error) log(error, 'error'); else { let obj = JSON.parse(result); if(obj.status) log('Fehler: ' + obj.status, 'warn'); else { let data = obj.data; Leistung_Energie.axisLabels = []; Leistung_Energie.graphs[0].data = []; Leistung_Energie.graphs[1].data = []; let i = 0; for(let entry in data) { let time = formatDate(parseInt(entry), 'hh'); Leistung_Energie.axisLabels.push(time); Leistung_Energie.graphs[0].data.push(data[entry][0]); Leistung_Energie.graphs[1].data.push(data[entry][1]); if (time == '19') if (i == 0) { setState(idEnergieMaxHeute, data[entry][1], true); i = i+1 } else setState(idEnergieMaxMorgen, data[entry][1], true); } setState(idLeistung_Energie, JSON.stringify(Leistung_Energie), true); } } }); }); -
@tobi19 Kannst du bitte beschreiben, wie du den Graph erstellt hast? Mit Flot oder Grafana?
-
@streit187 sagte in Solarprognose:
Das ist vermutlich nicht schön aber es tut was es soll. Leider nur an einem Tag weil das Objekt direkt aufgerufen wird.
Wie kann ich denn hier die Objekt Nummer aufrufen ähnlich der Eigenschaft mit [0[ bzw. [1]?Dank an alle - ich habe mir hier für ein interessantes Thema viel abgeschaut und beide Grafen in ein Diagramm zusammengefasst:
Hier eine Lösung für die zwei weiteren DP; ob sie auf Dauer funktioniert, sehe ich dann morgen mit neuen Daten.
const url = 'http://www.solarprognose.de/web/solarprediction/api/v1?_format=json&access-token=....&item=inverter&id=412&type=hourly'; const path = '0_userdata.0.SolarGraph.'; const idLeistung_Energie = path + 'Leistung_Energie'; const idEnergieMaxHeute = path + 'EnergieMaxHeute'; const idEnergieMaxMorgen = path + 'EnergieMaxMorgen'; var Leistung_Energie = { "axisLabels": ["8", "9", "10", "11", "12", "13", "14", "15", "16", "17", "18", "8", "9", "10", "11", "12", "13", "14", "15", "16", "17", "18"], "graphs": [{ "data": [0, 0, 0, 0, 0, 0, 0, 0, 0, 0, 0, 0, 0, 0, 0, 0, 0, 0, 0, 0, 0, 0], "type": "line", "legendText":"Leistung", "yAxis_min": 0, "yAxis_max": 8, "yAxis_step": 1, "yAxis_position": "left", "yAxis_appendix": " kW", "datalabel_show": false }, { "data": [0, 0, 0, 0, 0, 0, 0, 0, 0, 0, 0, 0, 0, 0, 0, 0, 0, 0, 0, 0, 0, 0], "type": "line", "line_UseFillColor": true, "legendText":"Energie", "yAxis_min": 0, "yAxis_max": 64, "yAxis_step": 8, "yAxis_position": "right", "yAxis_appendix": " kWh", "yAxis_color": "#91d430", "datalabel_show": false } ] }; createState(idLeistung_Energie, JSON.stringify(Leistung_Energie), {type: 'string', name: 'Leistung_Energie', role: 'table'}); createState(idEnergieMaxHeute, 0, {type: 'number', role: 'value', name: 'EnergieMaxHeute', read: true, write: false, unit: 'kWh'}); createState(idEnergieMaxMorgen, 0, {type: 'number', role: 'value', name: 'EnergieMaxMorgen', read: true, write: false, unit: 'kWh'}); schedule('5 7,9,12,14,16,18 * * *', function() { request(url, function (error, response, result) { if(error) log(error, 'error'); else { let obj = JSON.parse(result); if(obj.status) log('Fehler: ' + obj.status, 'warn'); else { let data = obj.data; Leistung_Energie.axisLabels = []; Leistung_Energie.graphs[0].data = []; Leistung_Energie.graphs[1].data = []; let i = 0; for(let entry in data) { let time = formatDate(parseInt(entry), 'hh'); Leistung_Energie.axisLabels.push(time); Leistung_Energie.graphs[0].data.push(data[entry][0]); Leistung_Energie.graphs[1].data.push(data[entry][1]); if (time == '19') if (i == 0) { setState(idEnergieMaxHeute, data[entry][1], true); i = i+1 } else setState(idEnergieMaxMorgen, data[entry][1], true); } setState(idLeistung_Energie, JSON.stringify(Leistung_Energie), true); } } }); });@tobi19 Und? Was sagen die Zahlen heute? Hat es geklappt?
Ihr könnt übrigens noch die Daten für 7 und 19 sowohl für heute als auch für morgen hinzufügen die Bestandteil der Daten von Solarprognose sind.
Dazu einfach bei axisLabels zwei Mal "7" und "19" einfügen und bei Data noch 4x 0, einfügen. -
@tobi19 Und? Was sagen die Zahlen heute? Hat es geklappt?
Ihr könnt übrigens noch die Daten für 7 und 19 sowohl für heute als auch für morgen hinzufügen die Bestandteil der Daten von Solarprognose sind.
Dazu einfach bei axisLabels zwei Mal "7" und "19" einfügen und bei Data noch 4x 0, einfügen.@streit187 sagte in Solarprognose:
@tobi19 Und? Was sagen die Zahlen heute? Hat es geklappt?
JA, ich habe heute Daten von 6 Uhr bis 19 Uhr für 2 Tage bekommen.
Das Javascript scheint dies zu verarbeiten. Bin aber kein Kenner der Sprache und weiß daher nicht wieso diese Erweiterung der Datenraums funktioniert.
Da ich den Datenpunkt Time == 19 filtere, klappt es, wenn der Datenpunkt 19Uhr dabei ist. -
@martybr sagte in Solarprognose:
@tobi19 Kannst du bitte beschreiben, wie du den Graph erstellt hast? Mit Flot oder Grafana?
Der Graf ist wie oben erwähnt mit dem JSON Chart Widget aus dem Material-Design Adapter erstellt. Widget Export anbei.
-
Hallo,
ich muß jetzt auch mal etwas fragen.
Ich versuche mich an diesem Skript:
const url = 'hier die komplette URL eintragen';
const path = '0_userdata.0.Solar.';
const idLeistung = path + 'Leistung.';
const idEnergie  = path + 'Energie.';

schedule('16 4-22 * * *', function() {
    request(url, function (error, response, result) {
        if(error) log(error, 'error');
        else {
            let obj = JSON.parse(result);
            if(obj.status) log('Fehler: ' + obj.status, 'warn');
            else {
                let data = obj.data;
                let wdHeute = new Date().getDay();
                for(let entry in data) {
                    let wd = new Date(1000 * parseInt(entry)).getDay();
                    let time = formatDate(parseInt(entry), 'hh:mm');
                    if(wd == wdHeute) time = 'heute_' + time;
                    else time = 'morgen_' + time;
                    if(existsState(idLeistung + time)) setState(idLeistung + time, data[entry][0]);
                    else createState(idLeistung + time, data[entry][0], {
                        type: 'number',
                        role: 'value',
                        name: 'Solarleistung ' + time,
                        read: true,
                        write: false,
                        unit: 'kW'
                    });
                    if(existsState(idEnergie + time)) setState(idEnergie + time, data[entry][1]);
                    else createState(idEnergie + time, data[entry][1], {
                        type: 'number',
                        role: 'value',
                        name: 'Solarenergie ' + time,
                        read: true,
                        write: false,
                        unit: 'kWh'
                    });
                }
            }
        }
    });
});
Über den Link von Solarprognose bekomme ich folgenden Output am Browser:
{"status":0,"iLastPredictionGenerationEpochTime":1615222151,"weather_source_text":"<a target=\"_blank\" href=\"https://darksky.net/poweredby/\"><img src=\"{assetWeather}/images/darksky.png\" alt=\"Powered by Darksky\" style=\"width: 500px\"></a>","datalinename":"Germany > Gieben","data":{"1615215600":[0,0],"1615219200":[0.221,0.221],"1615222800":[0.029,0.25],"1615226400":[0,0.25],"1615266000":[0,0],"1615269600":[0.056,0.056],"1615273200":[0.23,0.286],"1615276800":[0.4,0.686],"1615280400":[0.512,1.198],"1615284000":[0.581,1.779],"1615287600":[0.641,2.42],"1615291200":[0.597,3.017],"1615294800":[0.525,3.542],"1615298400":[0.435,3.977],"1615302000":[0.326,4.303],"1615305600":[0.19,4.493],"1615309200":[0.026,4.519],"1615312800":[0,4.519]}}Wenn ich nun meinen Link in das Skript einfüge und es starte, dann sehe ich zwar, dass der Cronjob eingerichtet wird, es werden aber die Datenpunkte nicht erzeugt, Fehlermeldungen gibt es auch keine. Was läuft denn da falsch?
@palm_maniac sagte in Solarprognose:
0_userdata.0.Solar.
Und du bist sicher das es in diesem Ordner auch nach neu laden der Object Seite keine Objecte gibt?
Stell doch mal das loggen fuer die Javascript Instanz auf Debug und starte das Script neu.
-
Ganz sicher, hab schon mehrfach neu geladen. Auf Debug hatte ich die Instanz auch schon ohne Fehlermeldungen oder anderes.
525
Online32.7k
Users82.4k
Topics1.3m
Posts