

Solarprognose
-
@martybr so ich denke mal das wars jetzt endgültig mit der seite, da leider nicht mehr erreichbar und wenn ist die config seite für den server vorgeschaltet. ich habe mich auf die suche begeben und bin bei solcast hängen geblieben, bietet auch 20 api abfragen an und für kleine hausbesitzer einer pv anlage kostenlos, nur paßt jetzt das script nicht mehr. Mal schauen, alle die dieses script laufen haben setzt es mal auf pause, denn so habt ihr error einträge im log, da ja die url nicht mehr abgefragt werden kann, sorry dafür.
Update: Es geht wieder, aber wie lange weiß ich nicht.
Hier der Link zum neuen Anbieter
https://solcast.com/rooftop-solar/Gruß
@babl
Hey, vielen Dank. Das ist mir noch nicht aufgefallen. Ich habe am Wochenende bei Proxmox-Hosts komplett neu aufgesetzt, da ich die Platten (SSDs) gegen größere getauscht habe. Nun laufen alle Hosts und VMs wieder.
Ich schaue mir den Link mal an und generiere schon mal einen Account. -
@babl
Hey, vielen Dank. Das ist mir noch nicht aufgefallen. Ich habe am Wochenende bei Proxmox-Hosts komplett neu aufgesetzt, da ich die Platten (SSDs) gegen größere getauscht habe. Nun laufen alle Hosts und VMs wieder.
Ich schaue mir den Link mal an und generiere schon mal einen Account. -
Hier mal das Script:
const url = 'http://www.solarprognose.de/web/solarprediction/api/v1?_format=json&access-token=CZCCYr2Iucnx5Exxxxxxxxx&item=location&id=160&type=hourly'; const path = '0_userdata.0.Solar.'; const idLeistung = path + 'Leistung.'; const idEnergie = path + 'Energie.'; schedule('16 4-22 * * *', function() { // schedule('* * * * *', function() { request(url, function (error, response, result) { if(error) log(error, 'error'); else { let obj = JSON.parse(result); if(obj.status) log('Fehler: ' + obj.status, 'warn'); else { let data = obj.data; let wdHeute = new Date().getDay(); for(let entry in data) { let wd = new Date(1000 * parseInt(entry)).getDay(); let time = formatDate(parseInt(entry), 'hh:mm'); if(wd == wdHeute) time = 'heute_' + time; else time = 'morgen_' + time; if(existsState(idLeistung + time)) setState(idLeistung + time, data[entry][0]); else createState(idLeistung + time, data[entry][0], { type: 'number', role: 'value', name: 'Solarleistung ' + time, read: true, write: false, unit: 'kW' }); if(existsState(idEnergie + time)) setState(idEnergie + time, data[entry][1]); else createState(idEnergie + time, data[entry][1], { type: 'number', role: 'value', name: 'Solarenergie ' + time, read: true, write: false, unit: 'kWh' }); } } } }); });Hallo zusammen,
ich habe mich bereits verzweifelt daran versucht deshalb die Frage ob hier jemand ist, der das vorhandene Skript so abändert, dass nicht für jede Uhrzeit jeweils ein Datenpunkt erstellt wird sondern nur noch insgesamt zwei Stück. Einer für Leistung und einer für Energie.
Genau müsste dann das dabei rauskommen:
1.
Neuen Datenpunkt anlegen:
in: 0_userdata.0/Solar/Energie
Name: Energie
Rolle: table
Art: Objekt
Typ: State
Wert: Die Response der bekannten URL in dieser Form:
{ "axisLabels": ["8", "9", "10", "11", "12", "13", "14", "15", "16", "17", "18", "8", "9", "10", "11", "12", "13", "14", "15", "16", "17", "18"],
"graphs": <erster Wert>
z.B.: [{"data": [0, 0.01, 0.588, 1.392, 1.484, 1.1, 1.05, 0.95, 0.7, 0.22, 0, 0, 0.02, 0.45, 0.82, 0.98, 1.1, 1.05, 0.95, 0.7, 0.22, 0],
"type": "line",
"yAxis_min": 0,
"yAxis_max": 10,
"yAxis_step": 1,
"yAxis_position": "left",
"yAxis_appendix": " kW",
"datalabel_show": false}]}Neuen Datenpunkt anlegen:
in: 0_userdata.0/Solar/Leistung
Name: Leistung
Rolle: table
Art: Objekt
Typ: State
Wert: Die Response der bekannten URL in dieser Form:
{ "axisLabels": ["8", "9", "10", "11", "12", "13", "14", "15", "16", "17", "18", "8", "9", "10", "11", "12", "13", "14", "15", "16", "17", "18"],
"graphs": <zweiter Wert>,
"type": "line",
"yAxis_min": 0,
"yAxis_max": 10,
"yAxis_step": 1,
"yAxis_position": "left",
"yAxis_appendix": " kW",
"datalabel_show": false}]}Unter Verwendung von diesen beiden Datenpunkten kann man dann jeweils einen JSON Graph Widget (Material Design) erstellen und sich so die Prognose anzeigen lassen.
Herzlichen Dank schonmal vorab.
-
Hallo zusammen,
ich habe mich bereits verzweifelt daran versucht deshalb die Frage ob hier jemand ist, der das vorhandene Skript so abändert, dass nicht für jede Uhrzeit jeweils ein Datenpunkt erstellt wird sondern nur noch insgesamt zwei Stück. Einer für Leistung und einer für Energie.
Genau müsste dann das dabei rauskommen:
1.
Neuen Datenpunkt anlegen:
in: 0_userdata.0/Solar/Energie
Name: Energie
Rolle: table
Art: Objekt
Typ: State
Wert: Die Response der bekannten URL in dieser Form:
{ "axisLabels": ["8", "9", "10", "11", "12", "13", "14", "15", "16", "17", "18", "8", "9", "10", "11", "12", "13", "14", "15", "16", "17", "18"],
"graphs": <erster Wert>
z.B.: [{"data": [0, 0.01, 0.588, 1.392, 1.484, 1.1, 1.05, 0.95, 0.7, 0.22, 0, 0, 0.02, 0.45, 0.82, 0.98, 1.1, 1.05, 0.95, 0.7, 0.22, 0],
"type": "line",
"yAxis_min": 0,
"yAxis_max": 10,
"yAxis_step": 1,
"yAxis_position": "left",
"yAxis_appendix": " kW",
"datalabel_show": false}]}Neuen Datenpunkt anlegen:
in: 0_userdata.0/Solar/Leistung
Name: Leistung
Rolle: table
Art: Objekt
Typ: State
Wert: Die Response der bekannten URL in dieser Form:
{ "axisLabels": ["8", "9", "10", "11", "12", "13", "14", "15", "16", "17", "18", "8", "9", "10", "11", "12", "13", "14", "15", "16", "17", "18"],
"graphs": <zweiter Wert>,
"type": "line",
"yAxis_min": 0,
"yAxis_max": 10,
"yAxis_step": 1,
"yAxis_position": "left",
"yAxis_appendix": " kW",
"datalabel_show": false}]}Unter Verwendung von diesen beiden Datenpunkten kann man dann jeweils einen JSON Graph Widget (Material Design) erstellen und sich so die Prognose anzeigen lassen.
Herzlichen Dank schonmal vorab.
für Solarcast gibt es ein Script. Ich probiere es gerade aus.
Siehe:
https://forum.iobroker.net/topic/32675/pv-prognosebasierte-ladung-von-sma-bat-wr-awattar?_=1612532940005
-> https://github.com/Maverick78de/SMA_forecast_charging -
@streit187 sagte: Skript ein bisschen anpassen?
Dazu müsste ich erst verstehen, was das Ergebnis sein soll. Es gibt einen Widerspruch zwischen
@streit187 sagte: Art: Objekt
und dem Aussehen als JSON und "JSON Graph Widget (Material Design)". Ein JSON ist kein Objekt, sondern ein String.Soll das alles in den Wert (als JSON)?
{   "axisLabels": ["8", "9", "10", "11", "12", "13", "14", "15", "16", "17", "18", "8", "9", "10", "11", "12", "13", "14", "15", "16", "17", "18"],
    "graphs": {
        "data": [0, 0.01, 0.588, 1.392, 1.484, 1.1, 1.05, 0.95, 0.7, 0.22, 0, 0, 0.02, 0.45, 0.82, 0.98, 1.1, 1.05, 0.95, 0.7, 0.22, 0],
        "type": "line",
        "yAxis_min": 0,
        "yAxis_max": 10,
        "yAxis_step": 1,
        "yAxis_position": "left",
        "yAxis_appendix": " kW",
        "datalabel_show": false
    }
}
und ist das so korrekt?
-
@streit187 sagte: Skript ein bisschen anpassen?
Dazu müsste ich erst verstehen, was das Ergebnis sein soll. Es gibt einen Widerspruch zwischen
@streit187 sagte: Art: Objekt
und dem Aussehen als JSON und "JSON Graph Widget (Material Design)". Ein JSON ist kein Objekt, sondern ein String.Soll das alles in den Wert (als JSON)?
{   "axisLabels": ["8", "9", "10", "11", "12", "13", "14", "15", "16", "17", "18", "8", "9", "10", "11", "12", "13", "14", "15", "16", "17", "18"],
    "graphs": {
        "data": [0, 0.01, 0.588, 1.392, 1.484, 1.1, 1.05, 0.95, 0.7, 0.22, 0, 0, 0.02, 0.45, 0.82, 0.98, 1.1, 1.05, 0.95, 0.7, 0.22, 0],
        "type": "line",
        "yAxis_min": 0,
        "yAxis_max": 10,
        "yAxis_step": 1,
        "yAxis_position": "left",
        "yAxis_appendix": " kW",
        "datalabel_show": false
    }
}
und ist das so korrekt?
Entschuldige bitte wenn ich hier die Begrifflichkeiten nicht korrekt verwende.
Ja, absolut korrekt. Zum Testen habe ich manuell einen Datenpunkt angelegt:"name": "Solar Prognose", "role": "table", "type": "object", "read": true, "write": true "_id": "0_userdata.0.Solar.objekt", "type": "state"und als Wert den von dir genannten Strin (?) hinterlegt. Diesen neuen Datensatz dann im "JSON Graph Widget" hinterlegt.
Heraus kam genau der gewünschte Prognose Graph. -
Entschuldige bitte wenn ich hier die Begrifflichkeiten nicht korrekt verwende.
Ja, absolut korrekt. Zum Testen habe ich manuell einen Datenpunkt angelegt:"name": "Solar Prognose", "role": "table", "type": "object", "read": true, "write": true "_id": "0_userdata.0.Solar.objekt", "type": "state"und als Wert den von dir genannten Strin (?) hinterlegt. Diesen neuen Datensatz dann im "JSON Graph Widget" hinterlegt.
Heraus kam genau der gewünschte Prognose Graph.@streit187 sagte: Ja, absolut korrekt.
Dann versuche es mal so:
const url = 'hier die komplette URL eintragen'; const path = '0_userdata.0.Solar.'; const idLeistung = path + 'Leistung'; const idEnergie = path + 'Energie'; var Leistung = { "axisLabels": ["8", "9", "10", "11", "12", "13", "14", "15", "16", "17", "18", "8", "9", "10", "11", "12", "13", "14", "15", "16", "17", "18"], "graphs": { "data": [0, 0, 0, 0, 0, 0, 0, 0, 0, 0, 0, 0, 0, 0, 0, 0, 0, 0, 0, 0, 0, 0], "type": "line", "yAxis_min": 0, "yAxis_max": 10, "yAxis_step": 1, "yAxis_position": "left", "yAxis_appendix": " kW", "datalabel_show": false } }; var Energie = { "axisLabels": ["8", "9", "10", "11", "12", "13", "14", "15", "16", "17", "18", "8", "9", "10", "11", "12", "13", "14", "15", "16", "17", "18"], "graphs": { "data": [0, 0, 0, 0, 0, 0, 0, 0, 0, 0, 0, 0, 0, 0, 0, 0, 0, 0, 0, 0, 0, 0], "type": "line", "yAxis_min": 0, "yAxis_max": 10, "yAxis_step": 1, "yAxis_position": "left", "yAxis_appendix": " kWh", "datalabel_show": false } }; if(!existsState(idLeistung)) createState(idLeistung, JSON.stringify(Leistung), {type: 'string', name: 'Leistung', role: 'table'}); if(!existsState(idEnergie)) createState(idEnergie, JSON.stringify(Energie), {type: 'string', name: 'Energie', role: 'table'}); schedule('16 4-22 * * *', function() { request(url, function (error, response, result) { if(error) log(error, 'error'); else { let obj = JSON.parse(result); if(obj.status) log('Fehler: ' + obj.status, 'warn'); else { let data = obj.data; Leistung.axisLabels = []; Leistung.graphs.data = []; Energie.axisLabels = []; Energie.graphs.data = []; for(let entry in data) { let time = formatDate(parseInt(entry), 'hh'); Leistung.axisLabels.push(time); Energie.axisLabels.push(time); Leistung.graphs.data.push(data[entry][0]); Energie.graphs.data.push(data[entry][1]); } setState(idLeistung, JSON.stringify(Leistung), true); setState(idEnergie, JSON.stringify(Energie), true); } } }); }); -
@streit187 sagte: Ja, absolut korrekt.
Dann versuche es mal so:
const url = 'hier die komplette URL eintragen'; const path = '0_userdata.0.Solar.'; const idLeistung = path + 'Leistung'; const idEnergie = path + 'Energie'; var Leistung = { "axisLabels": ["8", "9", "10", "11", "12", "13", "14", "15", "16", "17", "18", "8", "9", "10", "11", "12", "13", "14", "15", "16", "17", "18"], "graphs": { "data": [0, 0, 0, 0, 0, 0, 0, 0, 0, 0, 0, 0, 0, 0, 0, 0, 0, 0, 0, 0, 0, 0], "type": "line", "yAxis_min": 0, "yAxis_max": 10, "yAxis_step": 1, "yAxis_position": "left", "yAxis_appendix": " kW", "datalabel_show": false } }; var Energie = { "axisLabels": ["8", "9", "10", "11", "12", "13", "14", "15", "16", "17", "18", "8", "9", "10", "11", "12", "13", "14", "15", "16", "17", "18"], "graphs": { "data": [0, 0, 0, 0, 0, 0, 0, 0, 0, 0, 0, 0, 0, 0, 0, 0, 0, 0, 0, 0, 0, 0], "type": "line", "yAxis_min": 0, "yAxis_max": 10, "yAxis_step": 1, "yAxis_position": "left", "yAxis_appendix": " kWh", "datalabel_show": false } }; if(!existsState(idLeistung)) createState(idLeistung, JSON.stringify(Leistung), {type: 'string', name: 'Leistung', role: 'table'}); if(!existsState(idEnergie)) createState(idEnergie, JSON.stringify(Energie), {type: 'string', name: 'Energie', role: 'table'}); schedule('16 4-22 * * *', function() { request(url, function (error, response, result) { if(error) log(error, 'error'); else { let obj = JSON.parse(result); if(obj.status) log('Fehler: ' + obj.status, 'warn'); else { let data = obj.data; Leistung.axisLabels = []; Leistung.graphs.data = []; Energie.axisLabels = []; Energie.graphs.data = []; for(let entry in data) { let time = formatDate(parseInt(entry), 'hh'); Leistung.axisLabels.push(time); Energie.axisLabels.push(time); Leistung.graphs.data.push(data[entry][0]); Energie.graphs.data.push(data[entry][1]); } setState(idLeistung, JSON.stringify(Leistung), true); setState(idEnergie, JSON.stringify(Energie), true); } } }); });@paul53
Ein Traum! Du bist der Beste. Ich habe noch den Schedule angepasst und eine [] eingefügt beim Graphen. Läuft super.const url = 'hier die komplette URL eintragen'; const path = '0_userdata.0.Solar.'; const idLeistung = path + 'Leistung'; const idEnergie = path + 'Energie'; var Leistung = { "axisLabels": ["8", "9", "10", "11", "12", "13", "14", "15", "16", "17", "18", "8", "9", "10", "11", "12", "13", "14", "15", "16", "17", "18"], "graphs": [{ "data": [0, 0, 0, 0, 0, 0, 0, 0, 0, 0, 0, 0, 0, 0, 0, 0, 0, 0, 0, 0, 0, 0], "type": "line", "yAxis_min": 0, "yAxis_max": 10, "yAxis_step": 1, "yAxis_position": "left", "yAxis_appendix": " kW", "datalabel_show": false } ] }; var Energie = { "axisLabels": ["8", "9", "10", "11", "12", "13", "14", "15", "16", "17", "18", "8", "9", "10", "11", "12", "13", "14", "15", "16", "17", "18"], "graphs": [{ "data": [0, 0, 0, 0, 0, 0, 0, 0, 0, 0, 0, 0, 0, 0, 0, 0, 0, 0, 0, 0, 0, 0], "type": "line", "yAxis_min": 0, "yAxis_max": 10, "yAxis_step": 1, "yAxis_position": "left", "yAxis_appendix": " kWh", "datalabel_show": false } ] }; if(!existsState(idLeistung)) createState(idLeistung, JSON.stringify(Leistung), {type: 'string', name: 'Leistung', role: 'table'}); if(!existsState(idEnergie)) createState(idEnergie, JSON.stringify(Energie), {type: 'string', name: 'Energie', role: 'table'}); schedule('5 7-19 * * *', function() { request(url, function (error, response, result) { if(error) log(error, 'error'); else { let obj = JSON.parse(result); if(obj.status) log('Fehler: ' + obj.status, 'warn'); else { let data = obj.data; Leistung.axisLabels = []; Leistung.graphs.data = []; Energie.axisLabels = []; Energie.graphs.data = []; for(let entry in data) { let time = formatDate(parseInt(entry), 'hh'); Leistung.axisLabels.push(time); Energie.axisLabels.push(time); Leistung.graphs.data.push(data[entry][0]); Energie.graphs.data.push(data[entry][1]); } setState(idLeistung, JSON.stringify(Leistung), true); setState(idEnergie, JSON.stringify(Energie), true); } } }); });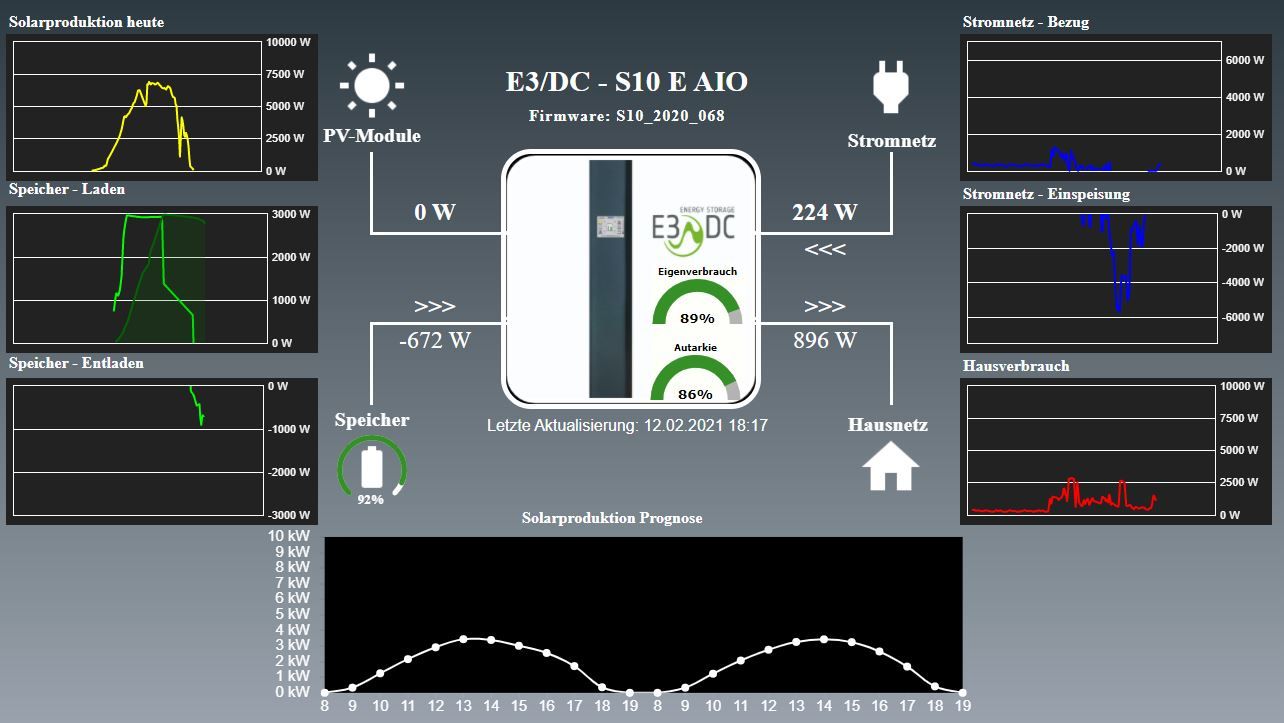
Vielen Dank
-
@paul53
Ein Traum! Du bist der Beste. Ich habe noch den Schedule angepasst und eine [] eingefügt beim Graphen. Läuft super.const url = 'hier die komplette URL eintragen'; const path = '0_userdata.0.Solar.'; const idLeistung = path + 'Leistung'; const idEnergie = path + 'Energie'; var Leistung = { "axisLabels": ["8", "9", "10", "11", "12", "13", "14", "15", "16", "17", "18", "8", "9", "10", "11", "12", "13", "14", "15", "16", "17", "18"], "graphs": [{ "data": [0, 0, 0, 0, 0, 0, 0, 0, 0, 0, 0, 0, 0, 0, 0, 0, 0, 0, 0, 0, 0, 0], "type": "line", "yAxis_min": 0, "yAxis_max": 10, "yAxis_step": 1, "yAxis_position": "left", "yAxis_appendix": " kW", "datalabel_show": false } ] }; var Energie = { "axisLabels": ["8", "9", "10", "11", "12", "13", "14", "15", "16", "17", "18", "8", "9", "10", "11", "12", "13", "14", "15", "16", "17", "18"], "graphs": [{ "data": [0, 0, 0, 0, 0, 0, 0, 0, 0, 0, 0, 0, 0, 0, 0, 0, 0, 0, 0, 0, 0, 0], "type": "line", "yAxis_min": 0, "yAxis_max": 10, "yAxis_step": 1, "yAxis_position": "left", "yAxis_appendix": " kWh", "datalabel_show": false } ] }; if(!existsState(idLeistung)) createState(idLeistung, JSON.stringify(Leistung), {type: 'string', name: 'Leistung', role: 'table'}); if(!existsState(idEnergie)) createState(idEnergie, JSON.stringify(Energie), {type: 'string', name: 'Energie', role: 'table'}); schedule('5 7-19 * * *', function() { request(url, function (error, response, result) { if(error) log(error, 'error'); else { let obj = JSON.parse(result); if(obj.status) log('Fehler: ' + obj.status, 'warn'); else { let data = obj.data; Leistung.axisLabels = []; Leistung.graphs.data = []; Energie.axisLabels = []; Energie.graphs.data = []; for(let entry in data) { let time = formatDate(parseInt(entry), 'hh'); Leistung.axisLabels.push(time); Energie.axisLabels.push(time); Leistung.graphs.data.push(data[entry][0]); Energie.graphs.data.push(data[entry][1]); } setState(idLeistung, JSON.stringify(Leistung), true); setState(idEnergie, JSON.stringify(Energie), true); } } }); });Vielen Dank
@streit187 sagte: eine [] eingefügt beim Graphen.
Wenn graphs ein Array mit einem Element ist, müssten Zeilen 47, 49, 54 und 55 angepasst werden.
Leistung.graphs[0].data.push(data[entry][0]); Energie.graphs[0].data.push(data[entry][1]); -
@streit187 sagte: eine [] eingefügt beim Graphen.
Wenn graphs ein Array mit einem Element ist, müssten Zeilen 47, 49, 54 und 55 angepasst werden.
Leistung.graphs[0].data.push(data[entry][0]); Energie.graphs[0].data.push(data[entry][1]);@paul53
Sehr gut. Erfolgreich getestet. Dann nur der Vollständigkeit halber nochmal das ganz Skriptconst url = 'hier die komplette URL eintragen'; const path = '0_userdata.0.Solar.'; const idLeistung = path + 'Leistung'; const idEnergie = path + 'Energie'; var Leistung = { "axisLabels": ["8", "9", "10", "11", "12", "13", "14", "15", "16", "17", "18", "8", "9", "10", "11", "12", "13", "14", "15", "16", "17", "18"], "graphs": [{ "data": [0, 0, 0, 0, 0, 0, 0, 0, 0, 0, 0, 0, 0, 0, 0, 0, 0, 0, 0, 0, 0, 0], "type": "line", "yAxis_min": 0, "yAxis_max": 10, "yAxis_step": 1, "yAxis_position": "left", "yAxis_appendix": " kW", "datalabel_show": false } ] }; var Energie = { "axisLabels": ["8", "9", "10", "11", "12", "13", "14", "15", "16", "17", "18", "8", "9", "10", "11", "12", "13", "14", "15", "16", "17", "18"], "graphs": [{ "data": [0, 0, 0, 0, 0, 0, 0, 0, 0, 0, 0, 0, 0, 0, 0, 0, 0, 0, 0, 0, 0, 0], "type": "line", "yAxis_min": 0, "yAxis_max": 10, "yAxis_step": 1, "yAxis_position": "left", "yAxis_appendix": " kWh", "datalabel_show": false } ] }; if(!existsState(idLeistung)) createState(idLeistung, JSON.stringify(Leistung), {type: 'string', name: 'Leistung', role: 'table'}); if(!existsState(idEnergie)) createState(idEnergie, JSON.stringify(Energie), {type: 'string', name: 'Energie', role: 'table'}); schedule('5 7-19 * * *', function() { request(url, function (error, response, result) { if(error) log(error, 'error'); else { let obj = JSON.parse(result); if(obj.status) log('Fehler: ' + obj.status, 'warn'); else { let data = obj.data; Leistung.axisLabels = []; Leistung.graphs[0].data = []; Energie.axisLabels = []; Energie.graphs[0].data = []; for(let entry in data) { let time = formatDate(parseInt(entry), 'hh'); Leistung.axisLabels.push(time); Energie.axisLabels.push(time); Leistung.graphs[0].data.push(data[entry][0]); Energie.graphs[0].data.push(data[entry][1]); } setState(idEnergie, JSON.stringify(Energie), true); setState(idLeistung, JSON.stringify(Leistung), true); } } }); }); -
@paul53
Sehr gut. Erfolgreich getestet. Dann nur der Vollständigkeit halber nochmal das ganz Skriptconst url = 'hier die komplette URL eintragen'; const path = '0_userdata.0.Solar.'; const idLeistung = path + 'Leistung'; const idEnergie = path + 'Energie'; var Leistung = { "axisLabels": ["8", "9", "10", "11", "12", "13", "14", "15", "16", "17", "18", "8", "9", "10", "11", "12", "13", "14", "15", "16", "17", "18"], "graphs": [{ "data": [0, 0, 0, 0, 0, 0, 0, 0, 0, 0, 0, 0, 0, 0, 0, 0, 0, 0, 0, 0, 0, 0], "type": "line", "yAxis_min": 0, "yAxis_max": 10, "yAxis_step": 1, "yAxis_position": "left", "yAxis_appendix": " kW", "datalabel_show": false } ] }; var Energie = { "axisLabels": ["8", "9", "10", "11", "12", "13", "14", "15", "16", "17", "18", "8", "9", "10", "11", "12", "13", "14", "15", "16", "17", "18"], "graphs": [{ "data": [0, 0, 0, 0, 0, 0, 0, 0, 0, 0, 0, 0, 0, 0, 0, 0, 0, 0, 0, 0, 0, 0], "type": "line", "yAxis_min": 0, "yAxis_max": 10, "yAxis_step": 1, "yAxis_position": "left", "yAxis_appendix": " kWh", "datalabel_show": false } ] }; if(!existsState(idLeistung)) createState(idLeistung, JSON.stringify(Leistung), {type: 'string', name: 'Leistung', role: 'table'}); if(!existsState(idEnergie)) createState(idEnergie, JSON.stringify(Energie), {type: 'string', name: 'Energie', role: 'table'}); schedule('5 7-19 * * *', function() { request(url, function (error, response, result) { if(error) log(error, 'error'); else { let obj = JSON.parse(result); if(obj.status) log('Fehler: ' + obj.status, 'warn'); else { let data = obj.data; Leistung.axisLabels = []; Leistung.graphs[0].data = []; Energie.axisLabels = []; Energie.graphs[0].data = []; for(let entry in data) { let time = formatDate(parseInt(entry), 'hh'); Leistung.axisLabels.push(time); Energie.axisLabels.push(time); Leistung.graphs[0].data.push(data[entry][0]); Energie.graphs[0].data.push(data[entry][1]); } setState(idEnergie, JSON.stringify(Energie), true); setState(idLeistung, JSON.stringify(Leistung), true); } } }); });@streit187 sagte in Solarprognose:
const url = 'hier die komplette URL eintragen';
Welche URL kommt denn in das aktuelle Script?
-
@streit187 sagte in Solarprognose:
const url = 'hier die komplette URL eintragen';
Welche URL kommt denn in das aktuelle Script?
@wendy2702
Nach einer kostenlosen Registrierung und Eingabe der Daten deiner PV Anlage (Ort, Neigung, Ausrichtung) auf www.solarprognose.de bekommst du eine URL die so aussieht mit deinem eigenen Token:
http://www.solarprognose.de/web/solarprediction/api/v1?_format=json&access-token=CZCCYr2Iucnx5Exxxxxxxxx&item=location&id=160&type=hourly -
@wendy2702
Nach einer kostenlosen Registrierung und Eingabe der Daten deiner PV Anlage (Ort, Neigung, Ausrichtung) auf www.solarprognose.de bekommst du eine URL die so aussieht mit deinem eigenen Token:
http://www.solarprognose.de/web/solarprediction/api/v1?_format=json&access-token=CZCCYr2Iucnx5Exxxxxxxxx&item=location&id=160&type=hourly@streit187 Danke!
-
@streit187 Danke!
@wendy2702
Falls deine Prognosedaten viel zu gering sind füge deiner URL noch "&algorithm=mosmix" hinzu. Das hat wenigstens bei mir zu wesentlich realistischeren Werten geführt.@apollon77
Darf ich dich hier nochmal um deiner Unterstützung bitten. Ich steige beim auswerten der JSON Daten einfach nicht durch.
Ich hätte gerne zwei weitere Datenpunkte welche als Wert den jeweils letzten und damit höchsten Wert aus dem zweiten Array(?) enthält. Ich glaube im Skript werden die beiden Array mit 0 und 1 unterschieden. Dann wäre es von 1.
Einmal von heute 18 Uhr (13er Wert) und einen von morgen 18 Uhr (26er Wert).
path=0_userdata.0.Solar
name=Gesamt kWh heute / Gesamt kWh morgen
Das darf gerne im gleichen Skript passieren damit die Daten nicht noch Einmal abgerufen werden und den gleichen schedule nutzen. -
@wendy2702
Falls deine Prognosedaten viel zu gering sind füge deiner URL noch "&algorithm=mosmix" hinzu. Das hat wenigstens bei mir zu wesentlich realistischeren Werten geführt.@apollon77
Darf ich dich hier nochmal um deiner Unterstützung bitten. Ich steige beim auswerten der JSON Daten einfach nicht durch.
Ich hätte gerne zwei weitere Datenpunkte welche als Wert den jeweils letzten und damit höchsten Wert aus dem zweiten Array(?) enthält. Ich glaube im Skript werden die beiden Array mit 0 und 1 unterschieden. Dann wäre es von 1.
Einmal von heute 18 Uhr (13er Wert) und einen von morgen 18 Uhr (26er Wert).
path=0_userdata.0.Solar
name=Gesamt kWh heute / Gesamt kWh morgen
Das darf gerne im gleichen Skript passieren damit die Daten nicht noch Einmal abgerufen werden und den gleichen schedule nutzen.@streit187 Danke!
-
@wendy2702
Falls deine Prognosedaten viel zu gering sind füge deiner URL noch "&algorithm=mosmix" hinzu. Das hat wenigstens bei mir zu wesentlich realistischeren Werten geführt.@apollon77
Darf ich dich hier nochmal um deiner Unterstützung bitten. Ich steige beim auswerten der JSON Daten einfach nicht durch.
Ich hätte gerne zwei weitere Datenpunkte welche als Wert den jeweils letzten und damit höchsten Wert aus dem zweiten Array(?) enthält. Ich glaube im Skript werden die beiden Array mit 0 und 1 unterschieden. Dann wäre es von 1.
Einmal von heute 18 Uhr (13er Wert) und einen von morgen 18 Uhr (26er Wert).
path=0_userdata.0.Solar
name=Gesamt kWh heute / Gesamt kWh morgen
Das darf gerne im gleichen Skript passieren damit die Daten nicht noch Einmal abgerufen werden und den gleichen schedule nutzen.Das ist vermutlich nicht schön aber es tut was es soll. Leider nur an einem Tag weil das Objekt direkt aufgerufen wird.
Wie kann ich denn hier die Objekt Nummer aufrufen ähnlich der Eigenschaft mit [0[ bzw. [1]?const url = 'http://www.solarprognose.de/web/solarprediction/api/v1?_format=json&......'; const path = '0_userdata.0.Solar.'; const idLeistung = path + 'Leistung'; const idEnergie = path + 'Energie'; const idEnergieMaxHeute = path + 'EnergieMaxHeute'; const idEnergieMaxMorgen = path + 'EnergieMaxMorgen'; var Leistung = { "axisLabels": ["8", "9", "10", "11", "12", "13", "14", "15", "16", "17", "18", "8", "9", "10", "11", "12", "13", "14", "15", "16", "17", "18"], "graphs": [{ "data": [0, 0, 0, 0, 0, 0, 0, 0, 0, 0, 0, 0, 0, 0, 0, 0, 0, 0, 0, 0, 0, 0], "type": "line", "yAxis_min": 0, "yAxis_max": 10, "yAxis_step": 1, "yAxis_position": "left", "yAxis_appendix": " kW", "datalabel_show": false } ] }; var Energie = { "axisLabels": ["8", "9", "10", "11", "12", "13", "14", "15", "16", "17", "18", "8", "9", "10", "11", "12", "13", "14", "15", "16", "17", "18"], "graphs": [{ "data": [0, 0, 0, 0, 0, 0, 0, 0, 0, 0, 0, 0, 0, 0, 0, 0, 0, 0, 0, 0, 0, 0], "type": "line", "yAxis_min": 0, "yAxis_max": 10, "yAxis_step": 1, "yAxis_position": "left", "yAxis_appendix": " kWh", "datalabel_show": false } ] }; if(!existsState(idLeistung)) createState(idLeistung, JSON.stringify(Leistung), {type: 'string', name: 'Leistung', role: 'table'}); if(!existsState(idEnergie)) createState(idEnergie, JSON.stringify(Energie), {type: 'string', name: 'Energie', role: 'table'}); schedule('5 7-19 * * *', function() { request(url, function (error, response, result) { if(error) log(error, 'error'); else { let obj = JSON.parse(result); if(obj.status) log('Fehler: ' + obj.status, 'warn'); else { let data = obj.data; Leistung.axisLabels = []; Leistung.graphs[0].data = []; Energie.axisLabels = []; Energie.graphs[0].data = []; for(let entry in data) { let time = formatDate(parseInt(entry), 'hh'); Leistung.axisLabels.push(time); Energie.axisLabels.push(time); Leistung.graphs[0].data.push(data[entry][0]); Energie.graphs[0].data.push(data[entry][1]); if(existsState(idEnergieMaxHeute)) setState(idEnergieMaxHeute, data[1614621600][1], true); else createState(idEnergieMaxHeute, data[1614621600][1], { type: 'number', role: 'value', name: 'EnergieMaxHeute', read: true, write: false, unit: 'kWh' }); if(existsState(idEnergieMaxMorgen)) setState(idEnergieMaxMorgen, data[1614708000][1], true); else createState(idEnergieMaxMorgen, data[1614708000][1], { type: 'number', role: 'value', name: 'EnergieMaxMorgen', read: true, write: false, unit: 'kWh' }); } setState(idEnergie, JSON.stringify(Energie), true); setState(idLeistung, JSON.stringify(Leistung), true); } } }); }); -
Das ist vermutlich nicht schön aber es tut was es soll. Leider nur an einem Tag weil das Objekt direkt aufgerufen wird.
Wie kann ich denn hier die Objekt Nummer aufrufen ähnlich der Eigenschaft mit [0[ bzw. [1]?const url = 'http://www.solarprognose.de/web/solarprediction/api/v1?_format=json&......'; const path = '0_userdata.0.Solar.'; const idLeistung = path + 'Leistung'; const idEnergie = path + 'Energie'; const idEnergieMaxHeute = path + 'EnergieMaxHeute'; const idEnergieMaxMorgen = path + 'EnergieMaxMorgen'; var Leistung = { "axisLabels": ["8", "9", "10", "11", "12", "13", "14", "15", "16", "17", "18", "8", "9", "10", "11", "12", "13", "14", "15", "16", "17", "18"], "graphs": [{ "data": [0, 0, 0, 0, 0, 0, 0, 0, 0, 0, 0, 0, 0, 0, 0, 0, 0, 0, 0, 0, 0, 0], "type": "line", "yAxis_min": 0, "yAxis_max": 10, "yAxis_step": 1, "yAxis_position": "left", "yAxis_appendix": " kW", "datalabel_show": false } ] }; var Energie = { "axisLabels": ["8", "9", "10", "11", "12", "13", "14", "15", "16", "17", "18", "8", "9", "10", "11", "12", "13", "14", "15", "16", "17", "18"], "graphs": [{ "data": [0, 0, 0, 0, 0, 0, 0, 0, 0, 0, 0, 0, 0, 0, 0, 0, 0, 0, 0, 0, 0, 0], "type": "line", "yAxis_min": 0, "yAxis_max": 10, "yAxis_step": 1, "yAxis_position": "left", "yAxis_appendix": " kWh", "datalabel_show": false } ] }; if(!existsState(idLeistung)) createState(idLeistung, JSON.stringify(Leistung), {type: 'string', name: 'Leistung', role: 'table'}); if(!existsState(idEnergie)) createState(idEnergie, JSON.stringify(Energie), {type: 'string', name: 'Energie', role: 'table'}); schedule('5 7-19 * * *', function() { request(url, function (error, response, result) { if(error) log(error, 'error'); else { let obj = JSON.parse(result); if(obj.status) log('Fehler: ' + obj.status, 'warn'); else { let data = obj.data; Leistung.axisLabels = []; Leistung.graphs[0].data = []; Energie.axisLabels = []; Energie.graphs[0].data = []; for(let entry in data) { let time = formatDate(parseInt(entry), 'hh'); Leistung.axisLabels.push(time); Energie.axisLabels.push(time); Leistung.graphs[0].data.push(data[entry][0]); Energie.graphs[0].data.push(data[entry][1]); if(existsState(idEnergieMaxHeute)) setState(idEnergieMaxHeute, data[1614621600][1], true); else createState(idEnergieMaxHeute, data[1614621600][1], { type: 'number', role: 'value', name: 'EnergieMaxHeute', read: true, write: false, unit: 'kWh' }); if(existsState(idEnergieMaxMorgen)) setState(idEnergieMaxMorgen, data[1614708000][1], true); else createState(idEnergieMaxMorgen, data[1614708000][1], { type: 'number', role: 'value', name: 'EnergieMaxMorgen', read: true, write: false, unit: 'kWh' }); } setState(idEnergie, JSON.stringify(Energie), true); setState(idLeistung, JSON.stringify(Leistung), true); } } }); });@streit187 sagte in Solarprognose:
Das ist vermutlich nicht schön aber es tut was es soll. Leider nur an einem Tag weil das Objekt direkt aufgerufen wird.
Wie kann ich denn hier die Objekt Nummer aufrufen ähnlich der Eigenschaft mit [0[ bzw. [1]?Dank an alle - ich habe mir hier für ein interessantes Thema viel abgeschaut und beide Grafen in ein Diagramm zusammengefasst:
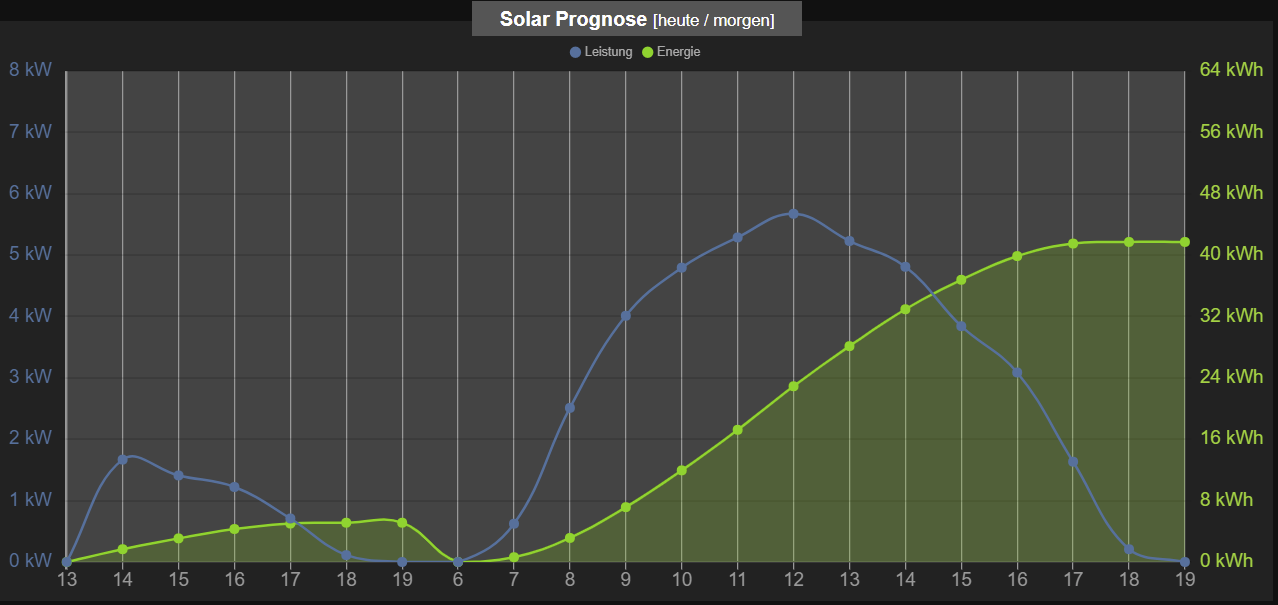
Hier eine Lösung für die zwei weiteren DP; ob sie auf Dauer funktioniert, sehe ich dann morgen mit neuen Daten.
const url = 'http://www.solarprognose.de/web/solarprediction/api/v1?_format=json&access-token=....&item=inverter&id=412&type=hourly'; const path = '0_userdata.0.SolarGraph.'; const idLeistung_Energie = path + 'Leistung_Energie'; const idEnergieMaxHeute = path + 'EnergieMaxHeute'; const idEnergieMaxMorgen = path + 'EnergieMaxMorgen'; var Leistung_Energie = { "axisLabels": ["8", "9", "10", "11", "12", "13", "14", "15", "16", "17", "18", "8", "9", "10", "11", "12", "13", "14", "15", "16", "17", "18"], "graphs": [{ "data": [0, 0, 0, 0, 0, 0, 0, 0, 0, 0, 0, 0, 0, 0, 0, 0, 0, 0, 0, 0, 0, 0], "type": "line", "legendText":"Leistung", "yAxis_min": 0, "yAxis_max": 8, "yAxis_step": 1, "yAxis_position": "left", "yAxis_appendix": " kW", "datalabel_show": false }, { "data": [0, 0, 0, 0, 0, 0, 0, 0, 0, 0, 0, 0, 0, 0, 0, 0, 0, 0, 0, 0, 0, 0], "type": "line", "line_UseFillColor": true, "legendText":"Energie", "yAxis_min": 0, "yAxis_max": 64, "yAxis_step": 8, "yAxis_position": "right", "yAxis_appendix": " kWh", "yAxis_color": "#91d430", "datalabel_show": false } ] }; createState(idLeistung_Energie, JSON.stringify(Leistung_Energie), {type: 'string', name: 'Leistung_Energie', role: 'table'}); createState(idEnergieMaxHeute, 0, {type: 'number', role: 'value', name: 'EnergieMaxHeute', read: true, write: false, unit: 'kWh'}); createState(idEnergieMaxMorgen, 0, {type: 'number', role: 'value', name: 'EnergieMaxMorgen', read: true, write: false, unit: 'kWh'}); schedule('5 7,9,12,14,16,18 * * *', function() { request(url, function (error, response, result) { if(error) log(error, 'error'); else { let obj = JSON.parse(result); if(obj.status) log('Fehler: ' + obj.status, 'warn'); else { let data = obj.data; Leistung_Energie.axisLabels = []; Leistung_Energie.graphs[0].data = []; Leistung_Energie.graphs[1].data = []; let i = 0; for(let entry in data) { let time = formatDate(parseInt(entry), 'hh'); Leistung_Energie.axisLabels.push(time); Leistung_Energie.graphs[0].data.push(data[entry][0]); Leistung_Energie.graphs[1].data.push(data[entry][1]); if (time == '19') if (i == 0) { setState(idEnergieMaxHeute, data[entry][1], true); i = i+1 } else setState(idEnergieMaxMorgen, data[entry][1], true); } setState(idLeistung_Energie, JSON.stringify(Leistung_Energie), true); } } }); }); -
@streit187 sagte in Solarprognose:
Das ist vermutlich nicht schön aber es tut was es soll. Leider nur an einem Tag weil das Objekt direkt aufgerufen wird.
Wie kann ich denn hier die Objekt Nummer aufrufen ähnlich der Eigenschaft mit [0[ bzw. [1]?Dank an alle - ich habe mir hier für ein interessantes Thema viel abgeschaut und beide Grafen in ein Diagramm zusammengefasst:
Hier eine Lösung für die zwei weiteren DP; ob sie auf Dauer funktioniert, sehe ich dann morgen mit neuen Daten.
const url = 'http://www.solarprognose.de/web/solarprediction/api/v1?_format=json&access-token=....&item=inverter&id=412&type=hourly';
const path = '0_userdata.0.SolarGraph.';
const idLeistung_Energie = path + 'Leistung_Energie';
const idEnergieMaxHeute = path + 'EnergieMaxHeute';
const idEnergieMaxMorgen = path + 'EnergieMaxMorgen';

var Leistung_Energie = {
    "axisLabels": ["8", "9", "10", "11", "12", "13", "14", "15", "16", "17", "18", "8", "9", "10", "11", "12", "13", "14", "15", "16", "17", "18"],
    "graphs": [{
        "data": [0, 0, 0, 0, 0, 0, 0, 0, 0, 0, 0, 0, 0, 0, 0, 0, 0, 0, 0, 0, 0, 0],
        "type": "line",
        "legendText":"Leistung",
        "yAxis_min": 0,
        "yAxis_max": 8,
        "yAxis_step": 1,
        "yAxis_position": "left",
        "yAxis_appendix": " kW",
        "datalabel_show": false
    },
    {
        "data": [0, 0, 0, 0, 0, 0, 0, 0, 0, 0, 0, 0, 0, 0, 0, 0, 0, 0, 0, 0, 0, 0],
        "type": "line",
        "line_UseFillColor": true,
        "legendText":"Energie",
        "yAxis_min": 0,
        "yAxis_max": 64,
        "yAxis_step": 8,
        "yAxis_position": "right",
        "yAxis_appendix": " kWh",
        "yAxis_color": "#91d430",
        "datalabel_show": false
    }
    ]
};

createState(idLeistung_Energie, JSON.stringify(Leistung_Energie), {type: 'string', name: 'Leistung_Energie', role: 'table'});
createState(idEnergieMaxHeute, 0, {type: 'number', role: 'value', name: 'EnergieMaxHeute', read: true, write: false, unit: 'kWh'});
createState(idEnergieMaxMorgen, 0, {type: 'number', role: 'value', name: 'EnergieMaxMorgen', read: true, write: false, unit: 'kWh'});

schedule('5 7,9,12,14,16,18 * * *', function() {
    request(url, function (error, response, result) {
        if(error) log(error, 'error');
        else {
            let obj = JSON.parse(result);
            if(obj.status) log('Fehler: ' + obj.status, 'warn');
            else {
                let data = obj.data;
                Leistung_Energie.axisLabels = [];
                Leistung_Energie.graphs[0].data = [];
                Leistung_Energie.graphs[1].data = [];
                let i = 0;
                for(let entry in data) {
                    let time = formatDate(parseInt(entry), 'hh');
                    Leistung_Energie.axisLabels.push(time);
                    Leistung_Energie.graphs[0].data.push(data[entry][0]);
                    Leistung_Energie.graphs[1].data.push(data[entry][1]);
                    if (time == '19')
                       if (i == 0) { setState(idEnergieMaxHeute, data[entry][1], true);  i = i+1 }
                       else         setState(idEnergieMaxMorgen, data[entry][1], true);
                }
                setState(idLeistung_Energie, JSON.stringify(Leistung_Energie), true);
            }
        }
    });
});
Hey! Du scheinst an dieser Unterhaltung interessiert zu sein, hast aber noch kein Konto.
Hast du es satt, bei jedem Besuch durch die gleichen Beiträge zu scrollen? Wenn du dich für ein Konto anmeldest, kommst du immer genau dorthin zurück, wo du zuvor warst, und kannst dich über neue Antworten benachrichtigen lassen (entweder per E-Mail oder Push-Benachrichtigung). Du kannst auch Lesezeichen speichern und Beiträge positiv bewerten, um anderen Community-Mitgliedern deine Wertschätzung zu zeigen.
Mit deinem Input könnte dieser Beitrag noch besser werden 💗
Registrieren Anmelden367
Online33.0k
Benutzer83.5k
Themen1.3m
Beiträge