NEWS


[Major Update] SourceAnalytix v0.4.7-beta.0 released !
-
@fastsonic
So habe ich es auch verstanden.Was ich allerdings nicht verstehe, warum Dutchman in den Current Ordner keine currentMonth rein bringen will. Für Month soll man mit VIS Variablen arbeiten :disappointed: Der Sinn erschließt sich mir noch nicht.
So etwas wäre doch mit currentMonth total einfach zu machen.
-
@JB_Sullivan
das kann ich so nicht bestätigen. Wäre schade wenn es wieder wegkommen würde.
Nur die Einzeln aufgezählen Monate bleiben im Jahresorder. Also
Monat 1 =
Monat 2 =
Current und previous ist drinnen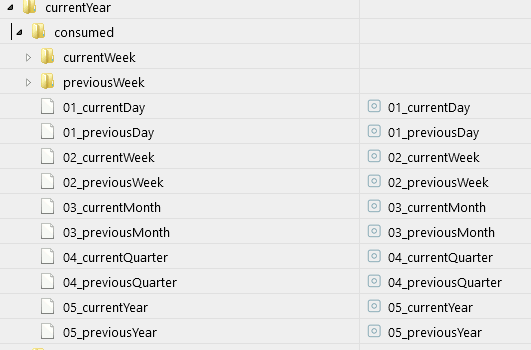
@fastsonic sagte in [Major Update] SourceAnalytix v0.4.7-beta.0 released !:
@JB_Sullivan
das kann ich so nicht bestätigen. Wäre schade wenn es wieder wegkommen würde.
Nur die Einzeln aufgezählen Monate bleiben im Jahresorder. Also
Monat 1 =
Monat 2 =
Current und previous ist drinnen????? - was kannst du nicht bestätigen?
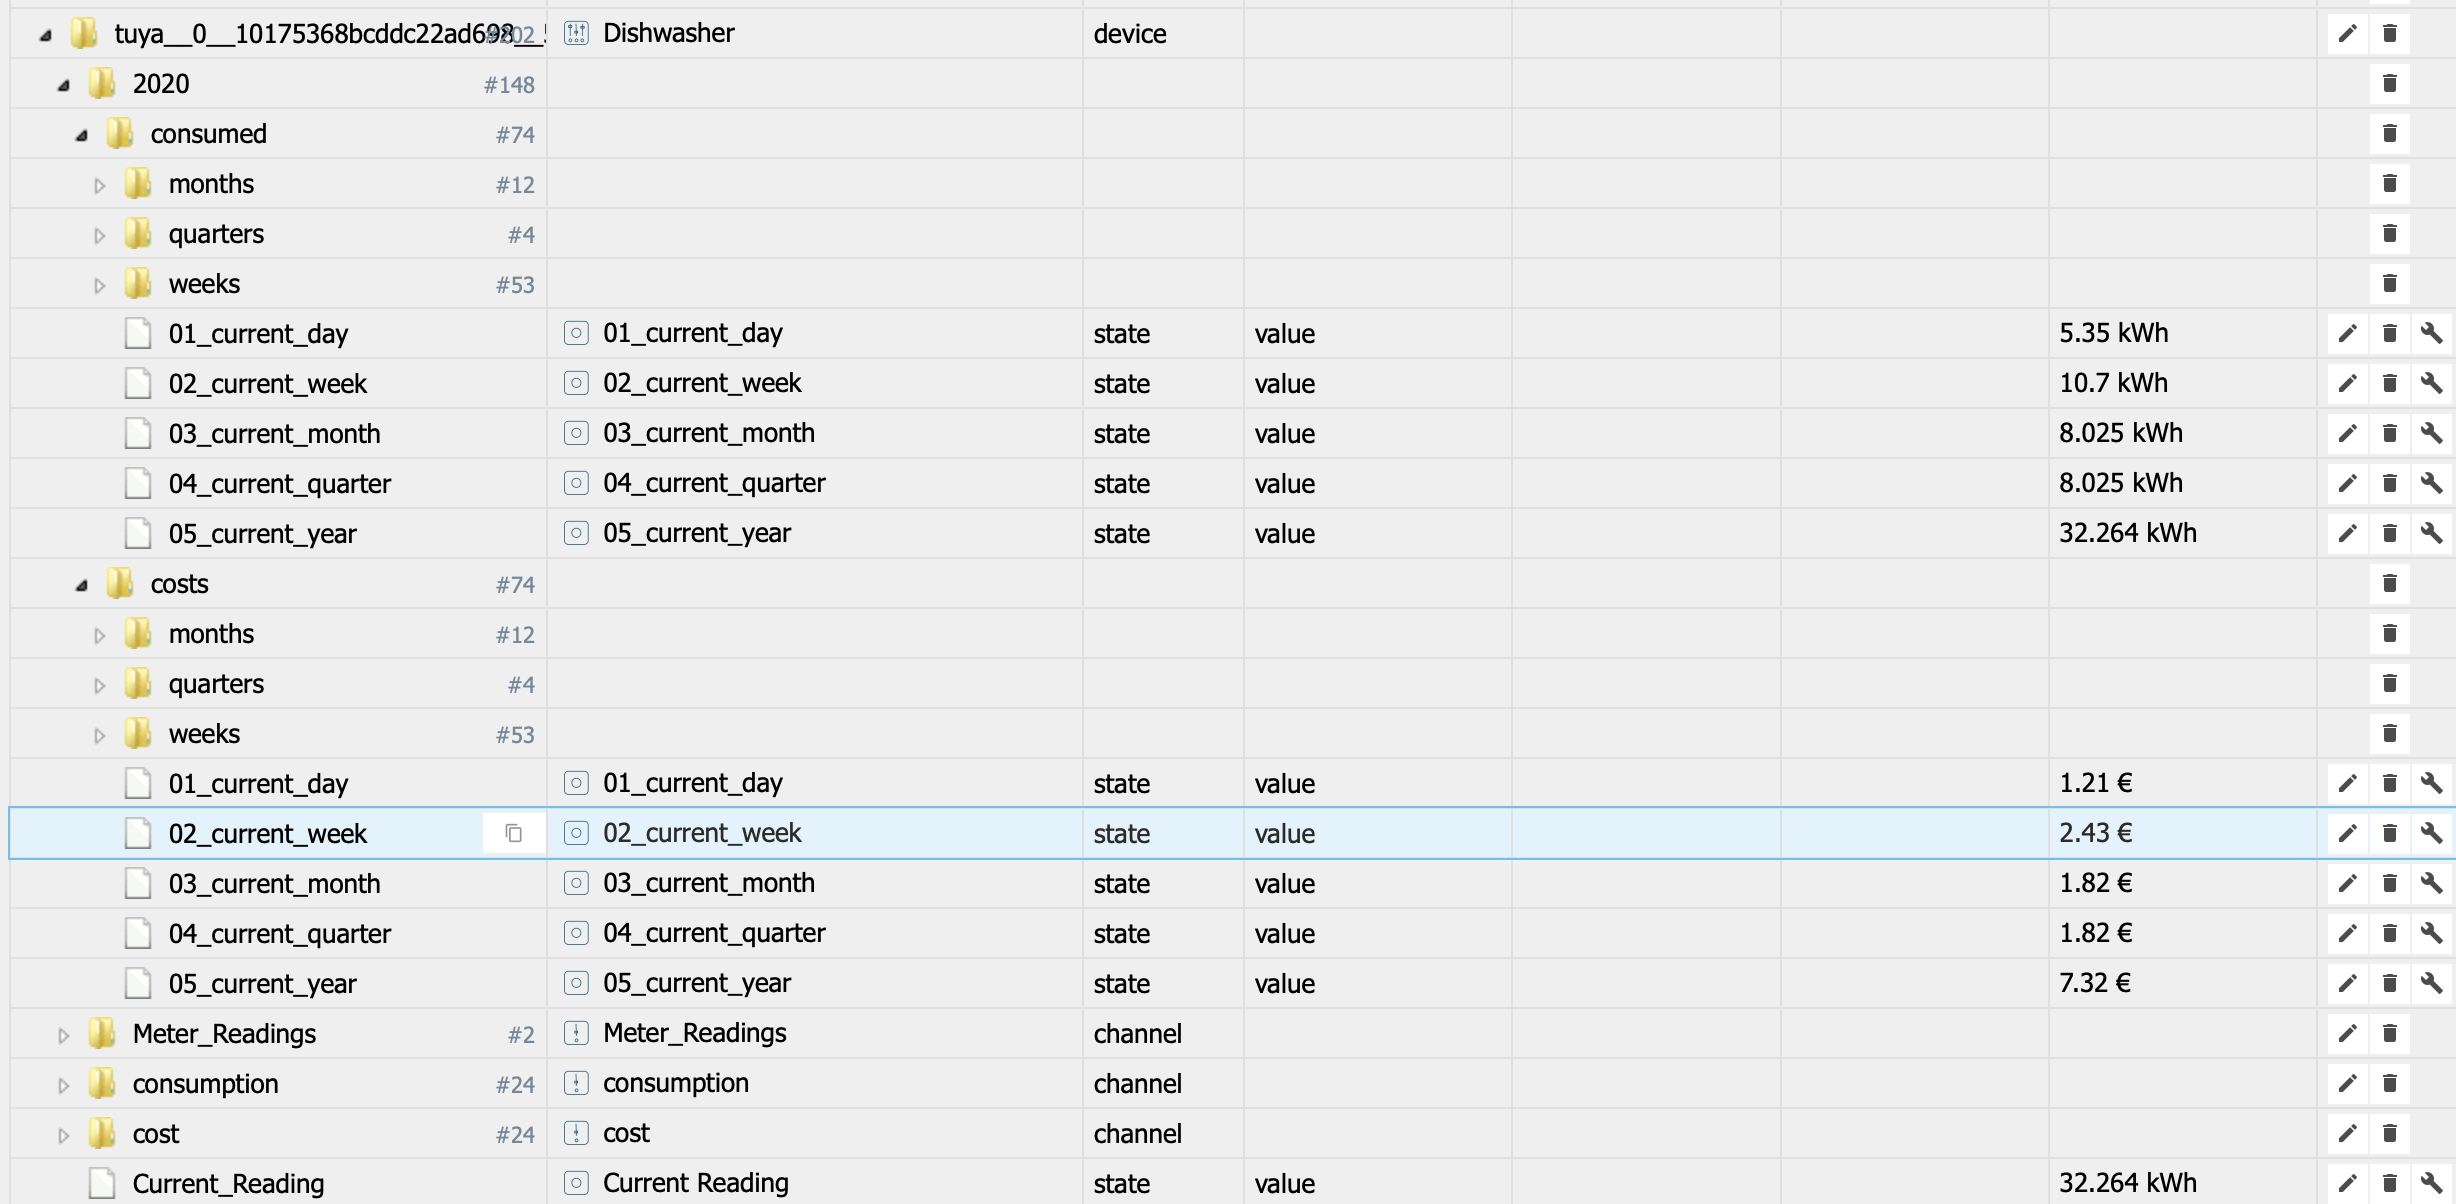
Im Jahr 2020 gibt es den Ordner months
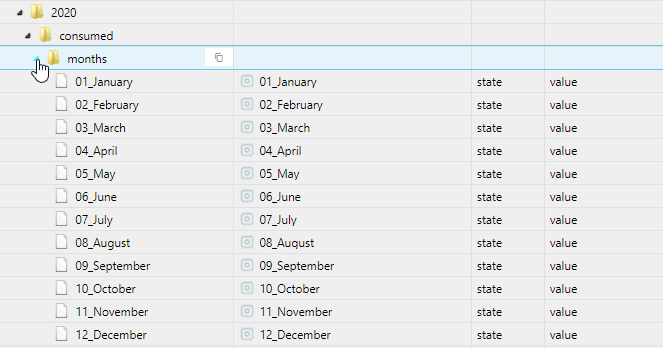
Warum macht man diesem Month Ordner nicht auch Jahresübergreifend in die "Current" Struktur rein?
Hier ist nur eine Summe CurrentMonths drin.
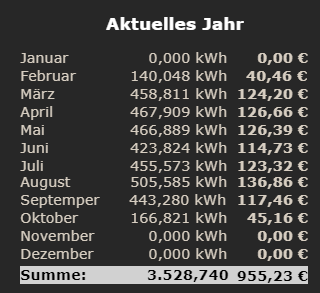
Wenn man jetzt eine Tabelle hat wie ich sie oben gezeigt habe, muss man im VIS mit jedem Jahreswechsel die DP`s anpassen. Mit einem "currentMonth" könnte die VIS Tabelle immer gleich bleiben.
-
@fastsonic sagte in [Major Update] SourceAnalytix v0.4.7-beta.0 released !:
@JB_Sullivan
das kann ich so nicht bestätigen. Wäre schade wenn es wieder wegkommen würde.
Nur die Einzeln aufgezählen Monate bleiben im Jahresorder. Also
Monat 1 =
Monat 2 =
Current und previous ist drinnen????? - was kannst du nicht bestätigen?
Im Jahr 2020 gibt es den Ordner months
Warum macht man diesem Month Ordner nicht auch Jahresübergreifend in die "Current" Struktur rein?
Hier ist nur eine Summe CurrentMonths drin.
Wenn man jetzt eine Tabelle hat wie ich sie oben gezeigt habe, muss man im VIS mit jedem Jahreswechsel die DP`s anpassen. Mit einem "currentMonth" könnte die VIS Tabelle immer gleich bleiben.
@JB_Sullivan
Ok du willst genau die Liste ;)
Ich arbeite das über die Influxdb ab.
Ich logge eigentlich immer nur die current Werte und mache den Rest in der Datenbank.
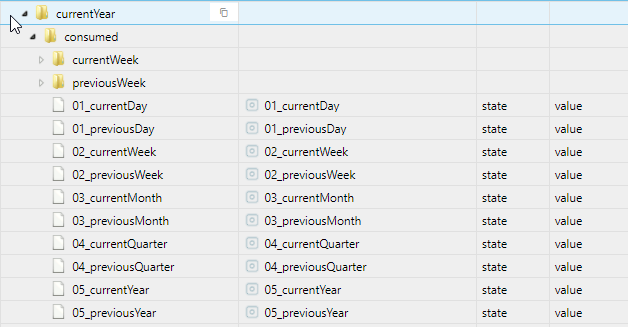
Logisch gesehen machen Current und previous Werte im Current Year sinn.
Beim Jahreswechseln würde das ja komplett verschwinden wenn Current geleert wird.
Deswegen stehen diese Werte im Jeweiligen Jahresordner.
Aber klar hier kannst du nochmal nachfragen ob es nicht doch mit in den current Ordner kommt. -
macht es dann nicht auch sinn die Bennenung nicht 2020 zu machen sonder current und last year; dann könnte man immer die gleichen states anpacken und muss nix verändern wenn man zum letzten jahr vergleichen will?
@Adnim
und nach last Year lastlastyear ?
Zum vergleichen würde ich current( für tagesübersichten previous) Werte loggen und schön auswerten lassen. Das spart eine Menge Platz in der aktiven Instanz und in seinem Plugin ( Performance )
z.B.
Da kannst du Tage, Wochen, Jahre alles schön auf Knopfdruck ansehen und vergleichen und auch in die Vis einbinden.
Somit musst du nicht alles einzeln einbauen, sondern kannst das einfach in der Grafik auswählen.Das Plugin selber wird massiv entlastet.
P.S.
Wenn es euch dann um die Datenanzeige geht, könnt ihr ja eine Variable nehmen, anstatt fest auf den Jahreordner zu zeigen. Dann könnt ihr nur die Variable (auswahl) in der vis ändern und bekommt das jeweilige jahr das ihr sehen möchtet. -
@hg6806
in der letzten 0.4.8-alph2 ist er aber noch drin. Ich habe Dutchman aber auch so verstanden, das die Jahresordner fortlaufend weiter erhalten bleiben. Vielleicht wird es in der Instanz Config ja noch eine Einstellmöglichkeit geben, wie viele Jahre mit DP`s man behalten möchte (ACHTUNG Verbesserungsvorschlag ;) )@JB_Sullivan sagte in [Major Update] SourceAnalytix v0.4.7-beta.0 released !:
@hg6806
in der letzten 0.4.8-alph2 ist er aber noch drin. Ich habe Dutchman aber auch so verstanden, das die Jahresordner fortlaufend weiter erhalten bleiben. Vielleicht wird es in der Instanz Config ja noch eine Einstellmöglichkeit geben, wie viele Jahre mit DP`s man behalten möchte (ACHTUNG Verbesserungsvorschlag ;) )Dann wäre ja alles gut und ich hätte was ich brauche und kann Vergleich machen.
-
@Adnim
und nach last Year lastlastyear ?
Zum vergleichen würde ich current( für tagesübersichten previous) Werte loggen und schön auswerten lassen. Das spart eine Menge Platz in der aktiven Instanz und in seinem Plugin ( Performance )
z.B.
Da kannst du Tage, Wochen, Jahre alles schön auf Knopfdruck ansehen und vergleichen und auch in die Vis einbinden.
Somit musst du nicht alles einzeln einbauen, sondern kannst das einfach in der Grafik auswählen.Das Plugin selber wird massiv entlastet.
P.S.
Wenn es euch dann um die Datenanzeige geht, könnt ihr ja eine Variable nehmen, anstatt fest auf den Jahreordner zu zeigen. Dann könnt ihr nur die Variable (auswahl) in der vis ändern und bekommt das jeweilige jahr das ihr sehen möchtet.@fastsonic Du loggst die current Werte von sourceanalytix?
So:?
Als was für einen Datenpunkt Typ muss der in InfuxDB angelegt werden - number? Influx ist ja ein bisschen zickig wenn der falsche Typ hinterlegt ist.
Kannst du bitte deine Grafana Diagramme zum Import zur Verfügung stellen? Ich bin noch nicht so lange mit Grafana unterwegs und tue mich noch ein bisschen schwer. Das ich in den Diagrammen die DP`s dann austauschen muss ist klar, aber ich kann mir noch nicht ganz vorstellen, wie man jetzt mehrere Wochen(tage) über einen längeren Zeitraum als 7 Tage mit einander vergleichen kann. Da muss man doch irgend welche Rechen Aktionen durchführen - oder?
-
@Dutchman
Sag mal, wie wäre es eigentlich wenn man doch den 2020 Ordner noch parallel hätte und den dann auch belässt, dann könnte man schön über die Jahre Werte sammeln.
Hintergrund ist jetzt kein Jahresvergleich, das man man sowieso, sondern eher z.B. Woche 1 in 2020 mit Woche 1 in 2021 zu vergleichen und z.B. in Bar Charts dann mit +/- Vorjahr anzuzeigen.
Ich fände es bei Heizungsverbrauchswerten schon interessant was ich im in der Woche oder Monat im Vorjahr verbraucht habe.
Das Vorjahr wäre ja dann beim CurrentYear Ordner weg, oder?@hg6806 sagte in [Major Update] SourceAnalytix v0.4.7-beta.0 released !:
@Dutchman
Sag mal, wie wäre es eigentlich wenn man doch den 2020 Ordner noch parallel hätte und den dann auch belässt, dann könnte man schön über die Jahre Werte sammeln.
Hintergrund ist jetzt kein Jahresvergleich, das man man sowieso, sondern eher z.B. Woche 1 in 2020 mit Woche 1 in 2021 zu vergleichen und z.B. in Bar Charts dann mit +/- Vorjahr anzuzeigen.
Ich fände es bei Heizungsverbrauchswerten schon interessant was ich im in der Woche oder Monat im Vorjahr verbraucht habe.
Das Vorjahr wäre ja dann beim CurrentYear Ordner weg, oder?Nein ! der Ordner fuers ja ist so wie er ist und darin werden wochen/monats daten usw gespeichert daran hat sich nichts geaendert und somit kannste 2020 mit 2021 vergleichen. Nur die current und Tages werte sind nach Murren year gewandelt
Jetzige Auswertung = current year
Statistieken zum Jahr = im Jahres Ordner@fastsonic sagte in [Major Update] SourceAnalytix v0.4.7-beta.0 released !:
Der Ordner 2020 ist doch erstellt und wird dann im neuen Jahr mit 2021 ergänzt. Nur stehen halt darin nicht current Werte.
Sondern nur die Hautwerte der einzelnen Wochen Monate ....genau damit stehen die entwerte vom Monat Januar, Februar, Woche 1, 2 usw richtig verstanden :)
@hg6806 sagte in [Major Update] SourceAnalytix v0.4.7-beta.0 released !:
den 2020 Ordner soll es ja ab 0.4.8 nicht mehr geben.
wer hat das behauptet, definitiv Wohl warum mache ich sonst im admin ne separate Konfiguration fuer Jahres Statistiken und current ? :kissing_heart:
@JB_Sullivan sagte in [Major Update] SourceAnalytix v0.4.7-beta.0 released !:
Was ich allerdings nicht verstehe, warum Dutchman in den Current Ordner keine currentMonth rein bringen will. Für Month soll man mit VIS Variablen arbeiten Der Sinn erschließt sich mir noch nicht.
weil es keinen sinn macht diese werte doppelt zu schreiben... bedeutet fuer jeden geraet 12 extra Datenpunkte, bei 10 geraten 120 und bei 50 Geräten usw.... die daten sind ja da
@JB_Sullivan sagte in [Major Update] SourceAnalytix v0.4.7-beta.0 released !:
Wenn man jetzt eine Tabelle hat wie ich sie oben gezeigt habe, muss man im VIS mit jedem Jahreswechsel die DP`s anpassen. Mit einem "currentMonth" könnte die VIS Tabelle immer gleich bleiben.
Nein muss man nicht, man sollte problem A nicht loesen durch Problem B zu erstellen.
In vis kan man eenfach mit einer datums variable arbeiten und damit hat man dasselbe Resultat ohne unnötige/doppelte Strukturen
Thema "clean Programming and resource management"@Adnim sagte in [Major Update] SourceAnalytix v0.4.7-beta.0 released !:
macht es dann nicht auch sinn die Bennenung nicht 2020 zu machen sonder current und last year; dann könnte man immer die gleichen states anpacken und muss nix verändern wenn man zum letzten jahr vergleichen will?
nein, den dan sind die werte in 2 jähren weck vom jähr davor und haben wir wieder dasselbe problem, der Ordner Yearxxx ist sehr bewusst und wohl überwogen entstanden.
@fastsonic sagte in [Major Update] SourceAnalytix v0.4.7-beta.0 released !:
Zum vergleichen würde ich current Werte loggen und schön auswerten lassen. Das spart eine Menge Platz in der aktiven Instanz und in seinem Plugin ( Performance )
richtig :)
@hg6806 sagte in [Major Update] SourceAnalytix v0.4.7-beta.0 released !:
Dann wäre ja alles gut und ich hätte was ich brauche und kann Vergleich machen.
es gibt viele Wege nach Rome :)
@JB_Sullivan sagte in [Major Update] SourceAnalytix v0.4.7-beta.0 released !:
Als was für einen Datenpunkt Typ muss der in InfuxDB angelegt werden - number? Influx ist ja ein bisschen zickig wenn der falsche Typ hinterlegt ist.
der DP ist eine number, kannst also auf automatisch lassen das wird Influxdb richtig verarbeiten
@JB_Sullivan sagte in [Major Update] SourceAnalytix v0.4.7-beta.0 released !:
Kannst du bitte deine Grafana Diagramme zum Import zur Verfügung stellen? Ich bin noch nicht so lange mit Grafana unterwegs und tue mich noch ein bisschen schwer.
gute idee, wen erlaubt wuerde ich das spaeter auch gerne als ne best-practise nutzen und auf git zeigen ?
-
@fastsonic Du loggst die current Werte von sourceanalytix?
So:?
Als was für einen Datenpunkt Typ muss der in InfuxDB angelegt werden - number? Influx ist ja ein bisschen zickig wenn der falsche Typ hinterlegt ist.
Kannst du bitte deine Grafana Diagramme zum Import zur Verfügung stellen? Ich bin noch nicht so lange mit Grafana unterwegs und tue mich noch ein bisschen schwer. Das ich in den Diagrammen die DP`s dann austauschen muss ist klar, aber ich kann mir noch nicht ganz vorstellen, wie man jetzt mehrere Wochen(tage) über einen längeren Zeitraum als 7 Tage mit einander vergleichen kann. Da muss man doch irgend welche Rechen Aktionen durchführen - oder?
@JB_Sullivan
hi, wenn ich immer die Wochentage direkt vergleichen will, dann ja hier loggen.
Oder die Monate direkt so wie du das vor hast.
Ich logge die current Day, current Week, current month .....
Und die privious um einen direkten Vergleich von davor zu haben.
Alle anderen Werte kannst du über die Zeitauswahl auswählen.
In Grafana bau ich mir das dann zusammen. Da kann ich dir gerne ( soweit ich mich da auskenne ) helfen.
Profi bin ich keiner. Ich schreib dich per PN an. -
@JB_Sullivan
hi, wenn ich immer die Wochentage direkt vergleichen will, dann ja hier loggen.
Oder die Monate direkt so wie du das vor hast.
Ich logge die current Day, current Week, current month .....
Und die privious um einen direkten Vergleich von davor zu haben.
Alle anderen Werte kannst du über die Zeitauswahl auswählen.
In Grafana bau ich mir das dann zusammen. Da kann ich dir gerne ( soweit ich mich da auskenne ) helfen.
Profi bin ich keiner. Ich schreib dich per PN an.OK, dann aktiviere ich jetzt erstmal die DP`s, damit ich dann morgen eine kleine Datenbasis habe (hoffe ich).
Wie gesagt, wenn du magst, kannst du dein Dashboard auch exportieren und hier zum Download zur Verfügung stellen. Stehen ja keine Geheimen Sachen drin - ist dann für mich immer "lernen durch abgucken", wenn ich erstmal weiß wie man es anfangen muss ;)
-
OK, dann aktiviere ich jetzt erstmal die DP`s, damit ich dann morgen eine kleine Datenbasis habe (hoffe ich).
Wie gesagt, wenn du magst, kannst du dein Dashboard auch exportieren und hier zum Download zur Verfügung stellen. Stehen ja keine Geheimen Sachen drin - ist dann für mich immer "lernen durch abgucken", wenn ich erstmal weiß wie man es anfangen muss ;)
@JB_Sullivan
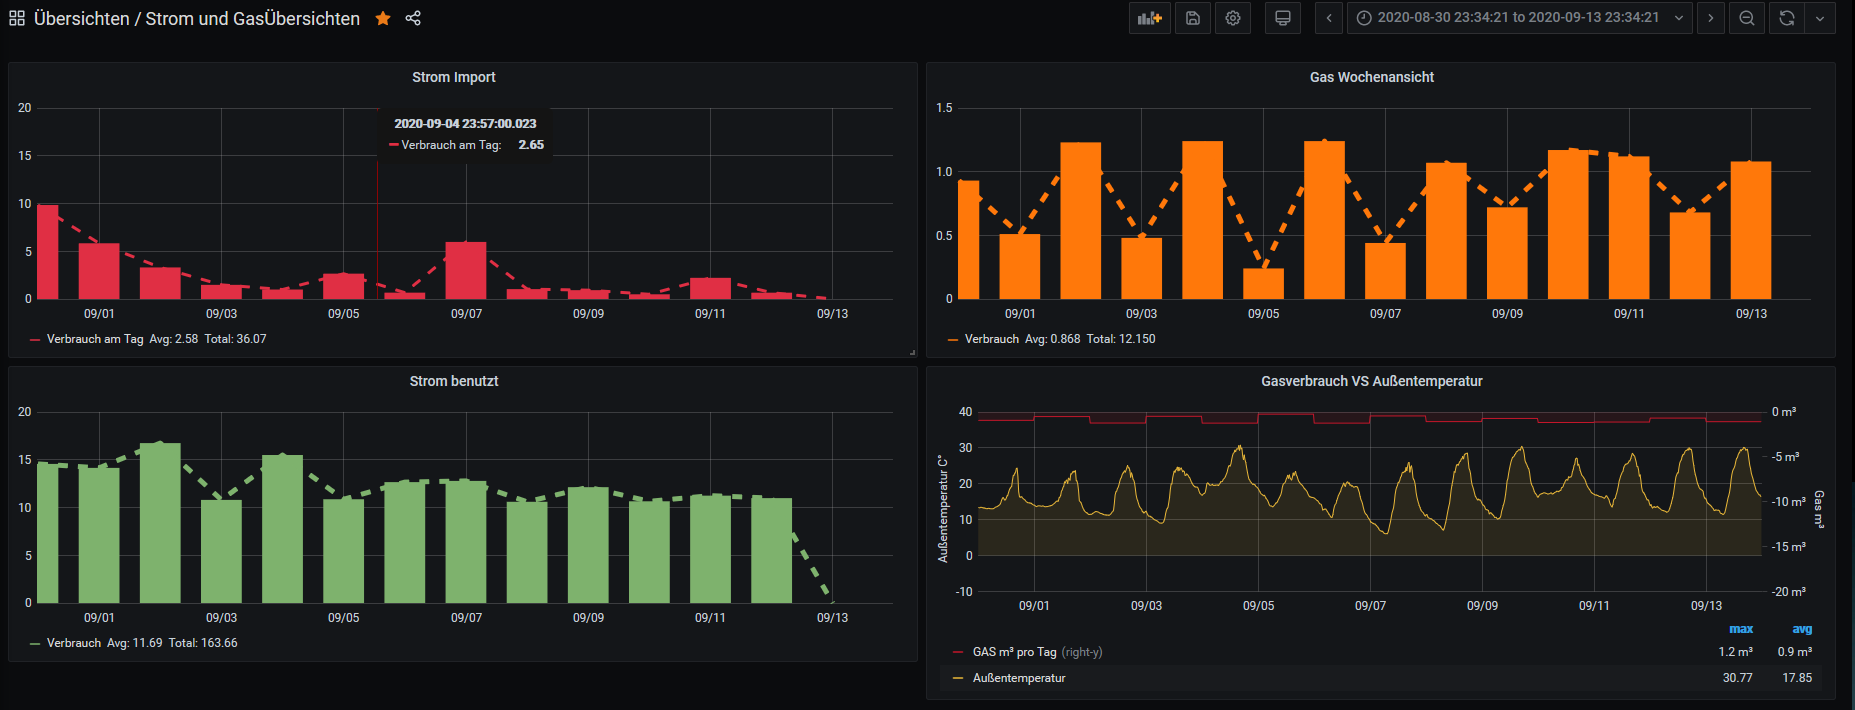
Hier mal ein paar Beispiele. Aber Achtung das Dashboard arbeitet mit previous Datenpunkte da der current sich ja dauernt verändert !
Und die funktionieren im moment noch nicht. da warte ich auf die Alph 3 :)Das direkt von oben:
{ "annotations": { "list": [ { "builtIn": 1, "datasource": "-- Grafana --", "enable": true, "hide": true, "iconColor": "rgba(0, 211, 255, 1)", "name": "Annotations & Alerts", "type": "dashboard" } ] }, "editable": true, "gnetId": null, "graphTooltip": 0, "id": 4, "links": [], "panels": [ { "aliasColors": {}, "bars": true, "dashLength": 10, "dashes": false, "datasource": null, "fieldConfig": { "defaults": { "custom": {} }, "overrides": [] }, "fill": 10, "fillGradient": 0, "gridPos": { "h": 8, "w": 12, "x": 0, "y": 0 }, "hiddenSeries": false, "hideTimeOverride": true, "id": 4, "legend": { "avg": true, "current": false, "max": false, "min": false, "show": true, "total": true, "values": true }, "lines": false, "linewidth": 3, "nullPointMode": "connected", "options": { "dataLinks": [] }, "percentage": false, "pluginVersion": "6.7.2", "pointradius": 10, "points": false, "renderer": "flot", "seriesOverrides": [ { "alias": "Verbrauch am Tag", "color": "#E02F44", "dashes": true } ], "spaceLength": 10, "stack": false, "steppedLine": true, "targets": [ { "alias": "Verbrauch am Tag", "groupBy": [ { "params": [ "$__interval" ], "type": "time" }, { "params": [ "none" ], "type": "fill" } ], "measurement": "javascript.0.Intervallwerte.Strom.Strom_kWh_last_day", "orderByTime": "ASC", "policy": "default", "refId": "A", "resultFormat": "time_series", "select": [ [ { "params": [ "value" ], "type": "field" }, { "params": [ "1" ], "type": "top" } ] ], "tags": [] } ], "thresholds": [], "timeFrom": null, "timeRegions": [], "timeShift": "", "title": "Strom Import", "tooltip": { "shared": true, "sort": 0, "value_type": "individual" }, "type": "graph", "xaxis": { "buckets": null, "mode": "time", "name": null, "show": true, "values": [] }, "yaxes": [ { "decimals": null, "format": "short", "label": null, "logBase": 1, "max": "20", "min": "0", "show": true }, { "format": "short", "label": null, "logBase": 1, "max": null, "min": null, "show": false } ], "yaxis": { "align": false, "alignLevel": null } }, { "aliasColors": {}, "bars": true, "dashLength": 10, "dashes": false, "datasource": null, "fieldConfig": { "defaults": { "custom": {} }, "overrides": [] }, "fill": 1, "fillGradient": 0, "gridPos": { "h": 8, "w": 12, "x": 12, "y": 0 }, "hiddenSeries": false, "id": 5, "legend": { "avg": true, "current": false, "max": false, "min": false, "show": true, "total": true, "values": true }, "lines": false, "linewidth": 5, "nullPointMode": "connected", "options": { "dataLinks": [] }, "percentage": false, "pluginVersion": "6.5.2", "pointradius": 6, "points": false, "renderer": "flot", "seriesOverrides": [ { "alias": "Verbrauch", "color": "#FF780A", "dashes": true } ], "spaceLength": 10, "stack": false, "steppedLine": false, "targets": [ { "alias": "Verbrauch", "groupBy": [ { "params": [ "$__interval" ], "type": "time" }, { "params": [ "none" ], "type": "fill" } ], "measurement": "javascript.0.Intervallwerte.GAS.Gas_m³_last_day", "orderByTime": "ASC", "policy": "default", "refId": "A", "resultFormat": "time_series", "select": [ [ { "params": [ "value" ], "type": "field" }, { "params": [ "1" ], "type": "top" } ] ], "tags": [] } ], "thresholds": [], "timeFrom": null, "timeRegions": [], "timeShift": "", "title": "Gas Wochenansicht", "tooltip": { "shared": true, "sort": 0, "value_type": "individual" }, "type": "graph", "xaxis": { "buckets": null, "mode": "time", "name": null, "show": true, "values": [] }, "yaxes": [ { "format": "short", "label": null, "logBase": 1, "max": null, "min": null, "show": true }, { "format": "short", "label": null, "logBase": 1, "max": null, "min": null, "show": false } ], "yaxis": { "align": false, "alignLevel": null } }, { "aliasColors": {}, "bars": true, "dashLength": 10, "dashes": false, "datasource": null, "fieldConfig": { "defaults": { "custom": {} }, "overrides": [] }, "fill": 1, "fillGradient": 0, "gridPos": { "h": 8, "w": 12, "x": 0, "y": 8 }, "hiddenSeries": false, "id": 7, "legend": { "avg": true, "current": false, "max": false, "min": false, "show": true, "total": true, "values": true }, "lines": false, "linewidth": 5, "nullPointMode": "null", "options": { "dataLinks": [] }, "percentage": false, "pluginVersion": "6.5.2", "pointradius": 6, "points": false, "renderer": "flot", "seriesOverrides": [ { "alias": "Verbrauch", "dashes": true } ], "spaceLength": 10, "stack": false, "steppedLine": false, "targets": [ { "alias": "Verbrauch", "groupBy": [ { "params": [ "$__interval" ], "type": "time" }, { "params": [ "none" ], "type": "fill" } ], "measurement": "javascript.0.Intervallwerte.Strom.Strom_benutzt_kWh_last_day", "orderByTime": "ASC", "policy": "default", "refId": "A", "resultFormat": "time_series", "select": [ [ { "params": [ "value" ], "type": "field" }, { "params": [ "1" ], "type": "top" } ] ], "tags": [] } ], "thresholds": [], "timeFrom": null, "timeRegions": [], "timeShift": "", "title": "Strom benutzt", "tooltip": { "shared": true, "sort": 0, "value_type": "individual" }, "type": "graph", "xaxis": { "buckets": null, "mode": "time", "name": null, "show": true, "values": [] }, "yaxes": [ { "decimals": null, "format": "short", "label": null, "logBase": 1, "max": "20", "min": null, "show": true }, { "format": "short", "label": null, "logBase": 1, "max": null, "min": null, "show": false } ], "yaxis": { "align": false, "alignLevel": null } }, { "aliasColors": {}, "bars": false, "dashLength": 10, "dashes": false, "datasource": null, "fieldConfig": { "defaults": { "custom": {} }, "overrides": [] }, "fill": 1, "fillGradient": 0, "gridPos": { "h": 9, "w": 12, "x": 12, "y": 8 }, "hiddenSeries": false, "hideTimeOverride": false, "id": 2, "legend": { "alignAsTable": true, "avg": true, "current": false, "max": true, "min": false, "rightSide": false, "show": true, "total": false, "values": true }, "lines": true, "linewidth": 1, "links": [], "nullPointMode": "null", "options": { "dataLinks": [] }, "percentage": false, "pointradius": 2, "points": false, "renderer": "flot", "seriesOverrides": [ { "alias": "GAS m³ pro Tag", "color": "#C4162A", "transform": "negative-Y", "yaxis": 2 } ], "spaceLength": 10, "stack": false, "steppedLine": false, "targets": [ { "alias": "GAS m³ pro Tag", "groupBy": [ { "params": [ "$__interval" ], "type": "time" }, { "params": [ "previous" ], "type": "fill" } ], "measurement": "javascript.0.Intervallwerte.GAS.Gas_m³_last_day", "orderByTime": "ASC", "policy": "default", "refId": "A", "resultFormat": "time_series", "select": [ [ { "params": [ "value" ], "type": "field" }, { "params": [], "type": "mean" } ] ], "tags": [] }, { "alias": "Außentemperatur", "groupBy": [ { "params": [ "$__interval" ], "type": "time" }, { "params": [ "previous" ], "type": "fill" } ], "measurement": "hm-rega.0.6275", "orderByTime": "ASC", "policy": "default", "query": "SELECT mean(\"value\") FROM \"hm-rega.0.6275\" WHERE $timeFilter GROUP BY time($__interval) fill(null)", "rawQuery": false, "refId": "B", "resultFormat": "time_series", "select": [ [ { "params": [ "value" ], "type": "field" }, { "params": [], "type": "mean" } ] ], "tags": [] } ], "thresholds": [], "timeFrom": null, "timeRegions": [], "timeShift": "", "title": "Gasverbrauch VS Außentemperatur", "tooltip": { "shared": true, "sort": 0, "value_type": "individual" }, "type": "graph", "xaxis": { "buckets": null, "mode": "time", "name": null, "show": true, "values": [] }, "yaxes": [ { "decimals": null, "format": "short", "label": "Außentemperatur C°", "logBase": 1, "max": "40", "min": "-10", "show": true }, { "decimals": 0, "format": "m3", "label": "Gas m³", "logBase": 1, "max": "0", "min": "-20", "show": true } ], "yaxis": { "align": false, "alignLevel": null } } ], "refresh": false, "schemaVersion": 25, "style": "dark", "tags": [], "templating": { "list": [] }, "time": { "from": "now-7d", "to": "now" }, "timepicker": { "refresh_intervals": [ "10s", "30s", "1m", "5m", "15m", "30m", "1h", "2h", "1d" ] }, "timezone": "", "title": "Strom und GasÜbersichten", "uid": "CHcoD0fWz", "version": 41 }Bei Fragen meld dich einfach.
@Dutchman
gerne kannst du das benutzen ! Ich habe einen großen, optiusch schönen Nutzen von deinem Plugin.
Wenn previous noch funktioniert :P
ich bin auch immer für verbesserungsvorschläge zu haben.. -
@JB_Sullivan
Hier mal ein paar Beispiele. Aber Achtung das Dashboard arbeitet mit previous Datenpunkte da der current sich ja dauernt verändert !
Und die funktionieren im moment noch nicht. da warte ich auf die Alph 3 :)Das direkt von oben:
{ "annotations": { "list": [ { "builtIn": 1, "datasource": "-- Grafana --", "enable": true, "hide": true, "iconColor": "rgba(0, 211, 255, 1)", "name": "Annotations & Alerts", "type": "dashboard" } ] }, "editable": true, "gnetId": null, "graphTooltip": 0, "id": 4, "links": [], "panels": [ { "aliasColors": {}, "bars": true, "dashLength": 10, "dashes": false, "datasource": null, "fieldConfig": { "defaults": { "custom": {} }, "overrides": [] }, "fill": 10, "fillGradient": 0, "gridPos": { "h": 8, "w": 12, "x": 0, "y": 0 }, "hiddenSeries": false, "hideTimeOverride": true, "id": 4, "legend": { "avg": true, "current": false, "max": false, "min": false, "show": true, "total": true, "values": true }, "lines": false, "linewidth": 3, "nullPointMode": "connected", "options": { "dataLinks": [] }, "percentage": false, "pluginVersion": "6.7.2", "pointradius": 10, "points": false, "renderer": "flot", "seriesOverrides": [ { "alias": "Verbrauch am Tag", "color": "#E02F44", "dashes": true } ], "spaceLength": 10, "stack": false, "steppedLine": true, "targets": [ { "alias": "Verbrauch am Tag", "groupBy": [ { "params": [ "$__interval" ], "type": "time" }, { "params": [ "none" ], "type": "fill" } ], "measurement": "javascript.0.Intervallwerte.Strom.Strom_kWh_last_day", "orderByTime": "ASC", "policy": "default", "refId": "A", "resultFormat": "time_series", "select": [ [ { "params": [ "value" ], "type": "field" }, { "params": [ "1" ], "type": "top" } ] ], "tags": [] } ], "thresholds": [], "timeFrom": null, "timeRegions": [], "timeShift": "", "title": "Strom Import", "tooltip": { "shared": true, "sort": 0, "value_type": "individual" }, "type": "graph", "xaxis": { "buckets": null, "mode": "time", "name": null, "show": true, "values": [] }, "yaxes": [ { "decimals": null, "format": "short", "label": null, "logBase": 1, "max": "20", "min": "0", "show": true }, { "format": "short", "label": null, "logBase": 1, "max": null, "min": null, "show": false } ], "yaxis": { "align": false, "alignLevel": null } }, { "aliasColors": {}, "bars": true, "dashLength": 10, "dashes": false, "datasource": null, "fieldConfig": { "defaults": { "custom": {} }, "overrides": [] }, "fill": 1, "fillGradient": 0, "gridPos": { "h": 8, "w": 12, "x": 12, "y": 0 }, "hiddenSeries": false, "id": 5, "legend": { "avg": true, "current": false, "max": false, "min": false, "show": true, "total": true, "values": true }, "lines": false, "linewidth": 5, "nullPointMode": "connected", "options": { "dataLinks": [] }, "percentage": false, "pluginVersion": "6.5.2", "pointradius": 6, "points": false, "renderer": "flot", "seriesOverrides": [ { "alias": "Verbrauch", "color": "#FF780A", "dashes": true } ], "spaceLength": 10, "stack": false, "steppedLine": false, "targets": [ { "alias": "Verbrauch", "groupBy": [ { "params": [ "$__interval" ], "type": "time" }, { "params": [ "none" ], "type": "fill" } ], "measurement": "javascript.0.Intervallwerte.GAS.Gas_m³_last_day", "orderByTime": "ASC", "policy": "default", "refId": "A", "resultFormat": "time_series", "select": [ [ { "params": [ "value" ], "type": "field" }, { "params": [ "1" ], "type": "top" } ] ], "tags": [] } ], "thresholds": [], "timeFrom": null, "timeRegions": [], "timeShift": "", "title": "Gas Wochenansicht", "tooltip": { "shared": true, "sort": 0, "value_type": "individual" }, "type": "graph", "xaxis": { "buckets": null, "mode": "time", "name": null, "show": true, "values": [] }, "yaxes": [ { "format": "short", "label": null, "logBase": 1, "max": null, "min": null, "show": true }, { "format": "short", "label": null, "logBase": 1, "max": null, "min": null, "show": false } ], "yaxis": { "align": false, "alignLevel": null } }, { "aliasColors": {}, "bars": true, "dashLength": 10, "dashes": false, "datasource": null, "fieldConfig": { "defaults": { "custom": {} }, "overrides": [] }, "fill": 1, "fillGradient": 0, "gridPos": { "h": 8, "w": 12, "x": 0, "y": 8 }, "hiddenSeries": false, "id": 7, "legend": { "avg": true, "current": false, "max": false, "min": false, "show": true, "total": true, "values": true }, "lines": false, "linewidth": 5, "nullPointMode": "null", "options": { "dataLinks": [] }, "percentage": false, "pluginVersion": "6.5.2", "pointradius": 6, "points": false, "renderer": "flot", "seriesOverrides": [ { "alias": "Verbrauch", "dashes": true } ], "spaceLength": 10, "stack": false, "steppedLine": false, "targets": [ { "alias": "Verbrauch", "groupBy": [ { "params": [ "$__interval" ], "type": "time" }, { "params": [ "none" ], "type": "fill" } ], "measurement": "javascript.0.Intervallwerte.Strom.Strom_benutzt_kWh_last_day", "orderByTime": "ASC", "policy": "default", "refId": "A", "resultFormat": "time_series", "select": [ [ { "params": [ "value" ], "type": "field" }, { "params": [ "1" ], "type": "top" } ] ], "tags": [] } ], "thresholds": [], "timeFrom": null, "timeRegions": [], "timeShift": "", "title": "Strom benutzt", "tooltip": { "shared": true, "sort": 0, "value_type": "individual" }, "type": "graph", "xaxis": { "buckets": null, "mode": "time", "name": null, "show": true, "values": [] }, "yaxes": [ { "decimals": null, "format": "short", "label": null, "logBase": 1, "max": "20", "min": null, "show": true }, { "format": "short", "label": null, "logBase": 1, "max": null, "min": null, "show": false } ], "yaxis": { "align": false, "alignLevel": null } }, { "aliasColors": {}, "bars": false, "dashLength": 10, "dashes": false, "datasource": null, "fieldConfig": { "defaults": { "custom": {} }, "overrides": [] }, "fill": 1, "fillGradient": 0, "gridPos": { "h": 9, "w": 12, "x": 12, "y": 8 }, "hiddenSeries": false, "hideTimeOverride": false, "id": 2, "legend": { "alignAsTable": true, "avg": true, "current": false, "max": true, "min": false, "rightSide": false, "show": true, "total": false, "values": true }, "lines": true, "linewidth": 1, "links": [], "nullPointMode": "null", "options": { "dataLinks": [] }, "percentage": false, "pointradius": 2, "points": false, "renderer": "flot", "seriesOverrides": [ { "alias": "GAS m³ pro Tag", "color": "#C4162A", "transform": "negative-Y", "yaxis": 2 } ], "spaceLength": 10, "stack": false, "steppedLine": false, "targets": [ { "alias": "GAS m³ pro Tag", "groupBy": [ { "params": [ "$__interval" ], "type": "time" }, { "params": [ "previous" ], "type": "fill" } ], "measurement": "javascript.0.Intervallwerte.GAS.Gas_m³_last_day", "orderByTime": "ASC", "policy": "default", "refId": "A", "resultFormat": "time_series", "select": [ [ { "params": [ "value" ], "type": "field" }, { "params": [], "type": "mean" } ] ], "tags": [] }, { "alias": "Außentemperatur", "groupBy": [ { "params": [ "$__interval" ], "type": "time" }, { "params": [ "previous" ], "type": "fill" } ], "measurement": "hm-rega.0.6275", "orderByTime": "ASC", "policy": "default", "query": "SELECT mean(\"value\") FROM \"hm-rega.0.6275\" WHERE $timeFilter GROUP BY time($__interval) fill(null)", "rawQuery": false, "refId": "B", "resultFormat": "time_series", "select": [ [ { "params": [ "value" ], "type": "field" }, { "params": [], "type": "mean" } ] ], "tags": [] } ], "thresholds": [], "timeFrom": null, "timeRegions": [], "timeShift": "", "title": "Gasverbrauch VS Außentemperatur", "tooltip": { "shared": true, "sort": 0, "value_type": "individual" }, "type": "graph", "xaxis": { "buckets": null, "mode": "time", "name": null, "show": true, "values": [] }, "yaxes": [ { "decimals": null, "format": "short", "label": "Außentemperatur C°", "logBase": 1, "max": "40", "min": "-10", "show": true }, { "decimals": 0, "format": "m3", "label": "Gas m³", "logBase": 1, "max": "0", "min": "-20", "show": true } ], "yaxis": { "align": false, "alignLevel": null } } ], "refresh": false, "schemaVersion": 25, "style": "dark", "tags": [], "templating": { "list": [] }, "time": { "from": "now-7d", "to": "now" }, "timepicker": { "refresh_intervals": [ "10s", "30s", "1m", "5m", "15m", "30m", "1h", "2h", "1d" ] }, "timezone": "", "title": "Strom und GasÜbersichten", "uid": "CHcoD0fWz", "version": 41 }Bei Fragen meld dich einfach.
@Dutchman
gerne kannst du das benutzen ! Ich habe einen großen, optiusch schönen Nutzen von deinem Plugin.
Wenn previous noch funktioniert :P
ich bin auch immer für verbesserungsvorschläge zu haben..Wenn ich mir den Export angucke (Import hat im übrigen funktioniert :+1: ) , arbeitest du z.Zt. mit einem Javascript, was dir entsprechende Rechenergebnisse als DP liefert - ist das richtig?
Das ist das was ich meinte, das man "nur" anhand von SA Daten ja keine Vergleiche machen kann. Ich muss ja immer Tag Minus Vortag o.ä. ähnliches rechnen, damit ich darstellbare Veränderungen sehen kann.
-
Wenn ich mir den Export angucke (Import hat im übrigen funktioniert :+1: ) , arbeitest du z.Zt. mit einem Javascript, was dir entsprechende Rechenergebnisse als DP liefert - ist das richtig?
Das ist das was ich meinte, das man "nur" anhand von SA Daten ja keine Vergleiche machen kann. Ich muss ja immer Tag Minus Vortag o.ä. ähnliches rechnen, damit ich darstellbare Veränderungen sehen kann.
@JB_Sullivan
Hi Nein. Sobald die previous daten funktionieren kannst du die dafür verwenden.
Das Javaminiscript war nur um am ende des Tages die Current in einen prvious Punkt zu schreiben.Wenn du auch deine Wochentage z.B. nimmst siehst du die anderen Tage immer als festen Balken und dein Aktiver Tag wächst von morgens bis abends so hast du dann eine Wochenübersicht.
Moment ich bastel mal kurz was und häng es gleich an. -
@JB_Sullivan
Hier mal ein paar Beispiele. Aber Achtung das Dashboard arbeitet mit previous Datenpunkte da der current sich ja dauernt verändert !
Und die funktionieren im moment noch nicht. da warte ich auf die Alph 3 :)Das direkt von oben:
{ "annotations": { "list": [ { "builtIn": 1, "datasource": "-- Grafana --", "enable": true, "hide": true, "iconColor": "rgba(0, 211, 255, 1)", "name": "Annotations & Alerts", "type": "dashboard" } ] }, "editable": true, "gnetId": null, "graphTooltip": 0, "id": 4, "links": [], "panels": [ { "aliasColors": {}, "bars": true, "dashLength": 10, "dashes": false, "datasource": null, "fieldConfig": { "defaults": { "custom": {} }, "overrides": [] }, "fill": 10, "fillGradient": 0, "gridPos": { "h": 8, "w": 12, "x": 0, "y": 0 }, "hiddenSeries": false, "hideTimeOverride": true, "id": 4, "legend": { "avg": true, "current": false, "max": false, "min": false, "show": true, "total": true, "values": true }, "lines": false, "linewidth": 3, "nullPointMode": "connected", "options": { "dataLinks": [] }, "percentage": false, "pluginVersion": "6.7.2", "pointradius": 10, "points": false, "renderer": "flot", "seriesOverrides": [ { "alias": "Verbrauch am Tag", "color": "#E02F44", "dashes": true } ], "spaceLength": 10, "stack": false, "steppedLine": true, "targets": [ { "alias": "Verbrauch am Tag", "groupBy": [ { "params": [ "$__interval" ], "type": "time" }, { "params": [ "none" ], "type": "fill" } ], "measurement": "javascript.0.Intervallwerte.Strom.Strom_kWh_last_day", "orderByTime": "ASC", "policy": "default", "refId": "A", "resultFormat": "time_series", "select": [ [ { "params": [ "value" ], "type": "field" }, { "params": [ "1" ], "type": "top" } ] ], "tags": [] } ], "thresholds": [], "timeFrom": null, "timeRegions": [], "timeShift": "", "title": "Strom Import", "tooltip": { "shared": true, "sort": 0, "value_type": "individual" }, "type": "graph", "xaxis": { "buckets": null, "mode": "time", "name": null, "show": true, "values": [] }, "yaxes": [ { "decimals": null, "format": "short", "label": null, "logBase": 1, "max": "20", "min": "0", "show": true }, { "format": "short", "label": null, "logBase": 1, "max": null, "min": null, "show": false } ], "yaxis": { "align": false, "alignLevel": null } }, { "aliasColors": {}, "bars": true, "dashLength": 10, "dashes": false, "datasource": null, "fieldConfig": { "defaults": { "custom": {} }, "overrides": [] }, "fill": 1, "fillGradient": 0, "gridPos": { "h": 8, "w": 12, "x": 12, "y": 0 }, "hiddenSeries": false, "id": 5, "legend": { "avg": true, "current": false, "max": false, "min": false, "show": true, "total": true, "values": true }, "lines": false, "linewidth": 5, "nullPointMode": "connected", "options": { "dataLinks": [] }, "percentage": false, "pluginVersion": "6.5.2", "pointradius": 6, "points": false, "renderer": "flot", "seriesOverrides": [ { "alias": "Verbrauch", "color": "#FF780A", "dashes": true } ], "spaceLength": 10, "stack": false, "steppedLine": false, "targets": [ { "alias": "Verbrauch", "groupBy": [ { "params": [ "$__interval" ], "type": "time" }, { "params": [ "none" ], "type": "fill" } ], "measurement": "javascript.0.Intervallwerte.GAS.Gas_m³_last_day", "orderByTime": "ASC", "policy": "default", "refId": "A", "resultFormat": "time_series", "select": [ [ { "params": [ "value" ], "type": "field" }, { "params": [ "1" ], "type": "top" } ] ], "tags": [] } ], "thresholds": [], "timeFrom": null, "timeRegions": [], "timeShift": "", "title": "Gas Wochenansicht", "tooltip": { "shared": true, "sort": 0, "value_type": "individual" }, "type": "graph", "xaxis": { "buckets": null, "mode": "time", "name": null, "show": true, "values": [] }, "yaxes": [ { "format": "short", "label": null, "logBase": 1, "max": null, "min": null, "show": true }, { "format": "short", "label": null, "logBase": 1, "max": null, "min": null, "show": false } ], "yaxis": { "align": false, "alignLevel": null } }, { "aliasColors": {}, "bars": true, "dashLength": 10, "dashes": false, "datasource": null, "fieldConfig": { "defaults": { "custom": {} }, "overrides": [] }, "fill": 1, "fillGradient": 0, "gridPos": { "h": 8, "w": 12, "x": 0, "y": 8 }, "hiddenSeries": false, "id": 7, "legend": { "avg": true, "current": false, "max": false, "min": false, "show": true, "total": true, "values": true }, "lines": false, "linewidth": 5, "nullPointMode": "null", "options": { "dataLinks": [] }, "percentage": false, "pluginVersion": "6.5.2", "pointradius": 6, "points": false, "renderer": "flot", "seriesOverrides": [ { "alias": "Verbrauch", "dashes": true } ], "spaceLength": 10, "stack": false, "steppedLine": false, "targets": [ { "alias": "Verbrauch", "groupBy": [ { "params": [ "$__interval" ], "type": "time" }, { "params": [ "none" ], "type": "fill" } ], "measurement": "javascript.0.Intervallwerte.Strom.Strom_benutzt_kWh_last_day", "orderByTime": "ASC", "policy": "default", "refId": "A", "resultFormat": "time_series", "select": [ [ { "params": [ "value" ], "type": "field" }, { "params": [ "1" ], "type": "top" } ] ], "tags": [] } ], "thresholds": [], "timeFrom": null, "timeRegions": [], "timeShift": "", "title": "Strom benutzt", "tooltip": { "shared": true, "sort": 0, "value_type": "individual" }, "type": "graph", "xaxis": { "buckets": null, "mode": "time", "name": null, "show": true, "values": [] }, "yaxes": [ { "decimals": null, "format": "short", "label": null, "logBase": 1, "max": "20", "min": null, "show": true }, { "format": "short", "label": null, "logBase": 1, "max": null, "min": null, "show": false } ], "yaxis": { "align": false, "alignLevel": null } }, { "aliasColors": {}, "bars": false, "dashLength": 10, "dashes": false, "datasource": null, "fieldConfig": { "defaults": { "custom": {} }, "overrides": [] }, "fill": 1, "fillGradient": 0, "gridPos": { "h": 9, "w": 12, "x": 12, "y": 8 }, "hiddenSeries": false, "hideTimeOverride": false, "id": 2, "legend": { "alignAsTable": true, "avg": true, "current": false, "max": true, "min": false, "rightSide": false, "show": true, "total": false, "values": true }, "lines": true, "linewidth": 1, "links": [], "nullPointMode": "null", "options": { "dataLinks": [] }, "percentage": false, "pointradius": 2, "points": false, "renderer": "flot", "seriesOverrides": [ { "alias": "GAS m³ pro Tag", "color": "#C4162A", "transform": "negative-Y", "yaxis": 2 } ], "spaceLength": 10, "stack": false, "steppedLine": false, "targets": [ { "alias": "GAS m³ pro Tag", "groupBy": [ { "params": [ "$__interval" ], "type": "time" }, { "params": [ "previous" ], "type": "fill" } ], "measurement": "javascript.0.Intervallwerte.GAS.Gas_m³_last_day", "orderByTime": "ASC", "policy": "default", "refId": "A", "resultFormat": "time_series", "select": [ [ { "params": [ "value" ], "type": "field" }, { "params": [], "type": "mean" } ] ], "tags": [] }, { "alias": "Außentemperatur", "groupBy": [ { "params": [ "$__interval" ], "type": "time" }, { "params": [ "previous" ], "type": "fill" } ], "measurement": "hm-rega.0.6275", "orderByTime": "ASC", "policy": "default", "query": "SELECT mean(\"value\") FROM \"hm-rega.0.6275\" WHERE $timeFilter GROUP BY time($__interval) fill(null)", "rawQuery": false, "refId": "B", "resultFormat": "time_series", "select": [ [ { "params": [ "value" ], "type": "field" }, { "params": [], "type": "mean" } ] ], "tags": [] } ], "thresholds": [], "timeFrom": null, "timeRegions": [], "timeShift": "", "title": "Gasverbrauch VS Außentemperatur", "tooltip": { "shared": true, "sort": 0, "value_type": "individual" }, "type": "graph", "xaxis": { "buckets": null, "mode": "time", "name": null, "show": true, "values": [] }, "yaxes": [ { "decimals": null, "format": "short", "label": "Außentemperatur C°", "logBase": 1, "max": "40", "min": "-10", "show": true }, { "decimals": 0, "format": "m3", "label": "Gas m³", "logBase": 1, "max": "0", "min": "-20", "show": true } ], "yaxis": { "align": false, "alignLevel": null } } ], "refresh": false, "schemaVersion": 25, "style": "dark", "tags": [], "templating": { "list": [] }, "time": { "from": "now-7d", "to": "now" }, "timepicker": { "refresh_intervals": [ "10s", "30s", "1m", "5m", "15m", "30m", "1h", "2h", "1d" ] }, "timezone": "", "title": "Strom und GasÜbersichten", "uid": "CHcoD0fWz", "version": 41 }Bei Fragen meld dich einfach.
@Dutchman
gerne kannst du das benutzen ! Ich habe einen großen, optiusch schönen Nutzen von deinem Plugin.
Wenn previous noch funktioniert :P
ich bin auch immer für verbesserungsvorschläge zu haben..@fastsonic sagte in [Major Update] SourceAnalytix v0.4.7-beta.0 released !:
gerne kannst du das benutzen ! Ich habe einen großen, optiusch schönen Nutzen von deinem Plugin.
danke :)
@fastsonic sagte in [Major Update] SourceAnalytix v0.4.7-beta.0 released !:
@JB_Sullivan
Hi Nein. Sobald die previous daten funktionieren kannst du die dafür verwenden.
Das Javaminiscript war nur um am ende des Tages die Current in einen prvious Punkt zu schreiben.ich moechte nicht zuviel versprechen aber hab heute und morgen par stunden übrig hoffe das ich die previous angehen kan :)
-
Wenn ich mir den Export angucke (Import hat im übrigen funktioniert :+1: ) , arbeitest du z.Zt. mit einem Javascript, was dir entsprechende Rechenergebnisse als DP liefert - ist das richtig?
Das ist das was ich meinte, das man "nur" anhand von SA Daten ja keine Vergleiche machen kann. Ich muss ja immer Tag Minus Vortag o.ä. ähnliches rechnen, damit ich darstellbare Veränderungen sehen kann.
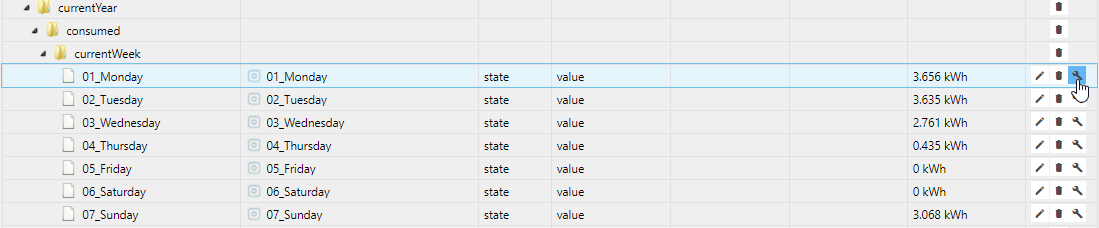
@JB_Sullivan
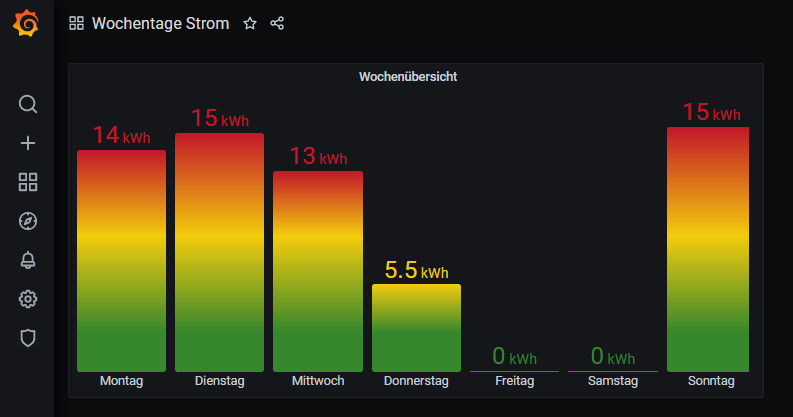
Hier kannst du z.B. die geloggten Montag, Dienstag... als Datenbpunkt auswählen.
Sobald sich die Datenpunkte dann mal geändert haben tauchen sie auf.{ "annotations": { "list": [ { "builtIn": 1, "datasource": "-- Grafana --", "enable": true, "hide": true, "iconColor": "rgba(0, 211, 255, 1)", "name": "Annotations & Alerts", "type": "dashboard" } ] }, "editable": true, "gnetId": null, "graphTooltip": 0, "id": 13, "links": [], "panels": [ { "aliasColors": {}, "bars": false, "dashLength": 10, "dashes": false, "datasource": null, "fieldConfig": { "defaults": { "custom": {} }, "overrides": [] }, "fill": 1, "fillGradient": 0, "gridPos": { "h": 8, "w": 12, "x": 0, "y": 0 }, "hiddenSeries": false, "id": 9, "legend": { "avg": false, "current": false, "max": false, "min": false, "show": true, "total": false, "values": false }, "lines": true, "linewidth": 1, "nullPointMode": "null", "options": { "dataLinks": [] }, "percentage": false, "pointradius": 2, "points": false, "renderer": "flot", "seriesOverrides": [], "spaceLength": 10, "stack": false, "steppedLine": false, "targets": [ { "groupBy": [ { "params": [ "$__interval" ], "type": "time" }, { "params": [ "null" ], "type": "fill" } ], "orderByTime": "ASC", "policy": "default", "refId": "A", "resultFormat": "time_series", "select": [ [ { "params": [ "value" ], "type": "field" }, { "params": [], "type": "mean" } ] ], "tags": [] } ], "thresholds": [], "timeFrom": null, "timeRegions": [], "timeShift": null, "title": "Panel Title", "tooltip": { "shared": true, "sort": 0, "value_type": "individual" }, "type": "graph", "xaxis": { "buckets": null, "mode": "time", "name": null, "show": true, "values": [] }, "yaxes": [ { "format": "short", "label": null, "logBase": 1, "max": null, "min": null, "show": true }, { "format": "short", "label": null, "logBase": 1, "max": null, "min": null, "show": true } ], "yaxis": { "align": false, "alignLevel": null } }, { "aliasColors": {}, "bars": true, "dashLength": 10, "dashes": false, "datasource": null, "fieldConfig": { "defaults": { "custom": {} }, "overrides": [] }, "fill": 1, "fillGradient": 0, "gridPos": { "h": 8, "w": 12, "x": 12, "y": 0 }, "hiddenSeries": false, "id": 5, "legend": { "avg": true, "current": false, "max": false, "min": false, "show": true, "total": true, "values": true }, "lines": false, "linewidth": 5, "nullPointMode": "connected", "options": { "dataLinks": [] }, "percentage": false, "pluginVersion": "6.5.2", "pointradius": 6, "points": false, "renderer": "flot", "seriesOverrides": [ { "alias": "Verbrauch", "color": "#FF780A", "dashes": true } ], "spaceLength": 10, "stack": false, "steppedLine": false, "targets": [ { "alias": "Verbrauch", "groupBy": [ { "params": [ "$__interval" ], "type": "time" }, { "params": [ "none" ], "type": "fill" } ], "measurement": "javascript.0.Intervallwerte.GAS.Gas_m³_last_day", "orderByTime": "ASC", "policy": "default", "refId": "A", "resultFormat": "time_series", "select": [ [ { "params": [ "value" ], "type": "field" }, { "params": [ "1" ], "type": "top" } ] ], "tags": [] } ], "thresholds": [], "timeFrom": null, "timeRegions": [], "timeShift": "", "title": "Gas Wochenansicht", "tooltip": { "shared": true, "sort": 0, "value_type": "individual" }, "type": "graph", "xaxis": { "buckets": null, "mode": "time", "name": null, "show": true, "values": [] }, "yaxes": [ { "format": "short", "label": null, "logBase": 1, "max": null, "min": null, "show": true }, { "format": "short", "label": null, "logBase": 1, "max": null, "min": null, "show": false } ], "yaxis": { "align": false, "alignLevel": null } }, { "aliasColors": {}, "bars": true, "dashLength": 10, "dashes": false, "datasource": null, "fieldConfig": { "defaults": { "custom": {} }, "overrides": [] }, "fill": 10, "fillGradient": 0, "gridPos": { "h": 8, "w": 12, "x": 0, "y": 8 }, "hiddenSeries": false, "hideTimeOverride": true, "id": 4, "legend": { "avg": true, "current": false, "max": false, "min": false, "show": true, "total": true, "values": true }, "lines": false, "linewidth": 3, "nullPointMode": "connected", "options": { "dataLinks": [] }, "percentage": false, "pluginVersion": "6.7.2", "pointradius": 10, "points": false, "renderer": "flot", "seriesOverrides": [ { "alias": "Verbrauch am Tag", "color": "#E02F44", "dashes": true } ], "spaceLength": 10, "stack": false, "steppedLine": true, "targets": [ { "alias": "Verbrauch am Tag", "groupBy": [ { "params": [ "$__interval" ], "type": "time" }, { "params": [ "none" ], "type": "fill" } ], "measurement": "javascript.0.Intervallwerte.Strom.Strom_kWh_last_day", "orderByTime": "ASC", "policy": "default", "refId": "A", "resultFormat": "time_series", "select": [ [ { "params": [ "value" ], "type": "field" }, { "params": [ "1" ], "type": "top" } ] ], "tags": [] } ], "thresholds": [], "timeFrom": null, "timeRegions": [], "timeShift": "", "title": "Strom Import", "tooltip": { "shared": true, "sort": 0, "value_type": "individual" }, "type": "graph", "xaxis": { "buckets": null, "mode": "time", "name": null, "show": true, "values": [] }, "yaxes": [ { "decimals": null, "format": "short", "label": null, "logBase": 1, "max": "20", "min": "0", "show": true }, { "format": "short", "label": null, "logBase": 1, "max": null, "min": null, "show": false } ], "yaxis": { "align": false, "alignLevel": null } }, { "aliasColors": {}, "bars": false, "dashLength": 10, "dashes": false, "datasource": null, "fieldConfig": { "defaults": { "custom": {} }, "overrides": [] }, "fill": 1, "fillGradient": 0, "gridPos": { "h": 9, "w": 12, "x": 12, "y": 8 }, "hiddenSeries": false, "hideTimeOverride": false, "id": 2, "legend": { "alignAsTable": true, "avg": true, "current": false, "max": true, "min": false, "rightSide": false, "show": true, "total": false, "values": true }, "lines": true, "linewidth": 1, "links": [], "nullPointMode": "null", "options": { "dataLinks": [] }, "percentage": false, "pointradius": 2, "points": false, "renderer": "flot", "seriesOverrides": [ { "alias": "GAS m³ pro Tag", "color": "#C4162A", "transform": "negative-Y", "yaxis": 2 } ], "spaceLength": 10, "stack": false, "steppedLine": false, "targets": [ { "alias": "GAS m³ pro Tag", "groupBy": [ { "params": [ "$__interval" ], "type": "time" }, { "params": [ "previous" ], "type": "fill" } ], "measurement": "javascript.0.Intervallwerte.GAS.Gas_m³_last_day", "orderByTime": "ASC", "policy": "default", "refId": "A", "resultFormat": "time_series", "select": [ [ { "params": [ "value" ], "type": "field" }, { "params": [], "type": "mean" } ] ], "tags": [] }, { "alias": "Außentemperatur", "groupBy": [ { "params": [ "$__interval" ], "type": "time" }, { "params": [ "previous" ], "type": "fill" } ], "measurement": "hm-rega.0.6275", "orderByTime": "ASC", "policy": "default", "query": "SELECT mean(\"value\") FROM \"hm-rega.0.6275\" WHERE $timeFilter GROUP BY time($__interval) fill(null)", "rawQuery": false, "refId": "B", "resultFormat": "time_series", "select": [ [ { "params": [ "value" ], "type": "field" }, { "params": [], "type": "mean" } ] ], "tags": [] } ], "thresholds": [], "timeFrom": null, "timeRegions": [], "timeShift": "", "title": "Gasverbrauch VS Außentemperatur", "tooltip": { "shared": true, "sort": 0, "value_type": "individual" }, "type": "graph", "xaxis": { "buckets": null, "mode": "time", "name": null, "show": true, "values": [] }, "yaxes": [ { "decimals": null, "format": "short", "label": "Außentemperatur C°", "logBase": 1, "max": "40", "min": "-10", "show": true }, { "decimals": 0, "format": "m3", "label": "Gas m³", "logBase": 1, "max": "0", "min": "-20", "show": true } ], "yaxis": { "align": false, "alignLevel": null } }, { "datasource": null, "description": "", "fieldConfig": { "defaults": { "custom": {}, "mappings": [], "thresholds": { "mode": "absolute", "steps": [ { "color": "red", "value": null }, { "color": "semi-dark-yellow", "value": 5 }, { "color": "dark-green", "value": 15 } ] } }, "overrides": [] }, "gridPos": { "h": 8, "w": 12, "x": 0, "y": 16 }, "id": 7, "options": { "displayMode": "gradient", "orientation": "auto", "reduceOptions": { "calcs": [ "mean" ], "fields": "", "values": false }, "showUnfilled": true }, "pluginVersion": "7.0.3", "targets": [ { "alias": "Montag", "groupBy": [ { "params": [ "$__interval" ], "type": "time" }, { "params": [ "previous" ], "type": "fill" } ], "measurement": "deconz.0.sensors.00158d00023cfd10.temperature", "orderByTime": "ASC", "policy": "global", "refId": "A", "resultFormat": "time_series", "select": [ [ { "params": [ "value" ], "type": "field" }, { "params": [ "1" ], "type": "top" } ] ], "tags": [] }, { "alias": "Dienstag", "groupBy": [ { "params": [ "$__interval" ], "type": "time" }, { "params": [ "previous" ], "type": "fill" } ], "measurement": "deconz.0.sensors.00158d00036c1288.temperature", "orderByTime": "ASC", "policy": "global", "refId": "B", "resultFormat": "time_series", "select": [ [ { "params": [ "value" ], "type": "field" }, { "params": [ "1" ], "type": "top" } ] ], "tags": [] }, { "alias": "Mittwoch", "groupBy": [ { "params": [ "$__interval" ], "type": "time" }, { "params": [ "previous" ], "type": "fill" } ], "measurement": "deconz.0.sensors.00158d00036d3729.temperature", "orderByTime": "ASC", "policy": "global", "refId": "C", "resultFormat": "time_series", "select": [ [ { "params": [ "value" ], "type": "field" }, { "params": [ "1" ], "type": "top" } ] ], "tags": [] }, { "alias": "Donnerstag", "groupBy": [ { "params": [ "$__interval" ], "type": "time" }, { "params": [ "previous" ], "type": "fill" } ], "measurement": "hm-rpc.1.000A18A996EE36.1.ACTUAL_TEMPERATURE", "orderByTime": "ASC", "policy": "global", "refId": "D", "resultFormat": "time_series", "select": [ [ { "params": [ "value" ], "type": "field" }, { "params": [ "1" ], "type": "top" } ] ], "tags": [] }, { "alias": "Freitag", "groupBy": [ { "params": [ "$__interval" ], "type": "time" }, { "params": [ "previous" ], "type": "fill" } ], "measurement": "hm-rpc.1.000A18A996EE36.1.ACTUAL_TEMPERATURE", "orderByTime": "ASC", "policy": "global", "refId": "E", "resultFormat": "time_series", "select": [ [ { "params": [ "value" ], "type": "field" }, { "params": [ "1" ], "type": "top" } ] ], "tags": [] }, { "alias": "Samstag", "groupBy": [ { "params": [ "$__interval" ], "type": "time" }, { "params": [ "previous" ], "type": "fill" } ], "measurement": "hm-rpc.1.000A18A996EE36.1.ACTUAL_TEMPERATURE", "orderByTime": "ASC", "policy": "global", "refId": "F", "resultFormat": "time_series", "select": [ [ { "params": [ "value" ], "type": "field" }, { "params": [ "1" ], "type": "top" } ] ], "tags": [] }, { "alias": "Sonntag", "groupBy": [ { "params": [ "$__interval" ], "type": "time" }, { "params": [ "previous" ], "type": "fill" } ], "measurement": "hm-rpc.3.3dpsp20000.1.TEMPERATURE", "orderByTime": "ASC", "policy": "global", "refId": "G", "resultFormat": "time_series", "select": [ [ { "params": [ "value" ], "type": "field" }, { "params": [ "1" ], "type": "top" } ] ], "tags": [] } ], "timeFrom": null, "timeShift": "", "title": "Wochenübersicht", "type": "bargauge" } ], "refresh": false, "schemaVersion": 25, "style": "dark", "tags": [], "templating": { "list": [] }, "time": { "from": "now-7d", "to": "now" }, "timepicker": { "refresh_intervals": [ "10s", "30s", "1m", "5m", "15m", "30m", "1h", "2h", "1d" ] }, "timezone": "", "title": "Strom und GasÜbersichten_3", "uid": "CHcoD0zzz", "version": 2 }Wenn du alle previous Montage sammelst, kannst du dir Graphen oder Tabellen bauen mit den jeweiligen, im Zeitfenster ausgewählten Zeitbereichen.
Da kannst du z.B bei der Gasübersicht aus dem Export oben den Temperatursensor gegen Monday tauschen und siehst entweder in balken oder linie oder tabelle die verläufte der Montage. -
@JB_Sullivan
Hier kannst du z.B. die geloggten Montag, Dienstag... als Datenbpunkt auswählen.
Sobald sich die Datenpunkte dann mal geändert haben tauchen sie auf.{ "annotations": { "list": [ { "builtIn": 1, "datasource": "-- Grafana --", "enable": true, "hide": true, "iconColor": "rgba(0, 211, 255, 1)", "name": "Annotations & Alerts", "type": "dashboard" } ] }, "editable": true, "gnetId": null, "graphTooltip": 0, "id": 13, "links": [], "panels": [ { "aliasColors": {}, "bars": false, "dashLength": 10, "dashes": false, "datasource": null, "fieldConfig": { "defaults": { "custom": {} }, "overrides": [] }, "fill": 1, "fillGradient": 0, "gridPos": { "h": 8, "w": 12, "x": 0, "y": 0 }, "hiddenSeries": false, "id": 9, "legend": { "avg": false, "current": false, "max": false, "min": false, "show": true, "total": false, "values": false }, "lines": true, "linewidth": 1, "nullPointMode": "null", "options": { "dataLinks": [] }, "percentage": false, "pointradius": 2, "points": false, "renderer": "flot", "seriesOverrides": [], "spaceLength": 10, "stack": false, "steppedLine": false, "targets": [ { "groupBy": [ { "params": [ "$__interval" ], "type": "time" }, { "params": [ "null" ], "type": "fill" } ], "orderByTime": "ASC", "policy": "default", "refId": "A", "resultFormat": "time_series", "select": [ [ { "params": [ "value" ], "type": "field" }, { "params": [], "type": "mean" } ] ], "tags": [] } ], "thresholds": [], "timeFrom": null, "timeRegions": [], "timeShift": null, "title": "Panel Title", "tooltip": { "shared": true, "sort": 0, "value_type": "individual" }, "type": "graph", "xaxis": { "buckets": null, "mode": "time", "name": null, "show": true, "values": [] }, "yaxes": [ { "format": "short", "label": null, "logBase": 1, "max": null, "min": null, "show": true }, { "format": "short", "label": null, "logBase": 1, "max": null, "min": null, "show": true } ], "yaxis": { "align": false, "alignLevel": null } }, { "aliasColors": {}, "bars": true, "dashLength": 10, "dashes": false, "datasource": null, "fieldConfig": { "defaults": { "custom": {} }, "overrides": [] }, "fill": 1, "fillGradient": 0, "gridPos": { "h": 8, "w": 12, "x": 12, "y": 0 }, "hiddenSeries": false, "id": 5, "legend": { "avg": true, "current": false, "max": false, "min": false, "show": true, "total": true, "values": true }, "lines": false, "linewidth": 5, "nullPointMode": "connected", "options": { "dataLinks": [] }, "percentage": false, "pluginVersion": "6.5.2", "pointradius": 6, "points": false, "renderer": "flot", "seriesOverrides": [ { "alias": "Verbrauch", "color": "#FF780A", "dashes": true } ], "spaceLength": 10, "stack": false, "steppedLine": false, "targets": [ { "alias": "Verbrauch", "groupBy": [ { "params": [ "$__interval" ], "type": "time" }, { "params": [ "none" ], "type": "fill" } ], "measurement": "javascript.0.Intervallwerte.GAS.Gas_m³_last_day", "orderByTime": "ASC", "policy": "default", "refId": "A", "resultFormat": "time_series", "select": [ [ { "params": [ "value" ], "type": "field" }, { "params": [ "1" ], "type": "top" } ] ], "tags": [] } ], "thresholds": [], "timeFrom": null, "timeRegions": [], "timeShift": "", "title": "Gas Wochenansicht", "tooltip": { "shared": true, "sort": 0, "value_type": "individual" }, "type": "graph", "xaxis": { "buckets": null, "mode": "time", "name": null, "show": true, "values": [] }, "yaxes": [ { "format": "short", "label": null, "logBase": 1, "max": null, "min": null, "show": true }, { "format": "short", "label": null, "logBase": 1, "max": null, "min": null, "show": false } ], "yaxis": { "align": false, "alignLevel": null } }, { "aliasColors": {}, "bars": true, "dashLength": 10, "dashes": false, "datasource": null, "fieldConfig": { "defaults": { "custom": {} }, "overrides": [] }, "fill": 10, "fillGradient": 0, "gridPos": { "h": 8, "w": 12, "x": 0, "y": 8 }, "hiddenSeries": false, "hideTimeOverride": true, "id": 4, "legend": { "avg": true, "current": false, "max": false, "min": false, "show": true, "total": true, "values": true }, "lines": false, "linewidth": 3, "nullPointMode": "connected", "options": { "dataLinks": [] }, "percentage": false, "pluginVersion": "6.7.2", "pointradius": 10, "points": false, "renderer": "flot", "seriesOverrides": [ { "alias": "Verbrauch am Tag", "color": "#E02F44", "dashes": true } ], "spaceLength": 10, "stack": false, "steppedLine": true, "targets": [ { "alias": "Verbrauch am Tag", "groupBy": [ { "params": [ "$__interval" ], "type": "time" }, { "params": [ "none" ], "type": "fill" } ], "measurement": "javascript.0.Intervallwerte.Strom.Strom_kWh_last_day", "orderByTime": "ASC", "policy": "default", "refId": "A", "resultFormat": "time_series", "select": [ [ { "params": [ "value" ], "type": "field" }, { "params": [ "1" ], "type": "top" } ] ], "tags": [] } ], "thresholds": [], "timeFrom": null, "timeRegions": [], "timeShift": "", "title": "Strom Import", "tooltip": { "shared": true, "sort": 0, "value_type": "individual" }, "type": "graph", "xaxis": { "buckets": null, "mode": "time", "name": null, "show": true, "values": [] }, "yaxes": [ { "decimals": null, "format": "short", "label": null, "logBase": 1, "max": "20", "min": "0", "show": true }, { "format": "short", "label": null, "logBase": 1, "max": null, "min": null, "show": false } ], "yaxis": { "align": false, "alignLevel": null } }, { "aliasColors": {}, "bars": false, "dashLength": 10, "dashes": false, "datasource": null, "fieldConfig": { "defaults": { "custom": {} }, "overrides": [] }, "fill": 1, "fillGradient": 0, "gridPos": { "h": 9, "w": 12, "x": 12, "y": 8 }, "hiddenSeries": false, "hideTimeOverride": false, "id": 2, "legend": { "alignAsTable": true, "avg": true, "current": false, "max": true, "min": false, "rightSide": false, "show": true, "total": false, "values": true }, "lines": true, "linewidth": 1, "links": [], "nullPointMode": "null", "options": { "dataLinks": [] }, "percentage": false, "pointradius": 2, "points": false, "renderer": "flot", "seriesOverrides": [ { "alias": "GAS m³ pro Tag", "color": "#C4162A", "transform": "negative-Y", "yaxis": 2 } ], "spaceLength": 10, "stack": false, "steppedLine": false, "targets": [ { "alias": "GAS m³ pro Tag", "groupBy": [ { "params": [ "$__interval" ], "type": "time" }, { "params": [ "previous" ], "type": "fill" } ], "measurement": "javascript.0.Intervallwerte.GAS.Gas_m³_last_day", "orderByTime": "ASC", "policy": "default", "refId": "A", "resultFormat": "time_series", "select": [ [ { "params": [ "value" ], "type": "field" }, { "params": [], "type": "mean" } ] ], "tags": [] }, { "alias": "Außentemperatur", "groupBy": [ { "params": [ "$__interval" ], "type": "time" }, { "params": [ "previous" ], "type": "fill" } ], "measurement": "hm-rega.0.6275", "orderByTime": "ASC", "policy": "default", "query": "SELECT mean(\"value\") FROM \"hm-rega.0.6275\" WHERE $timeFilter GROUP BY time($__interval) fill(null)", "rawQuery": false, "refId": "B", "resultFormat": "time_series", "select": [ [ { "params": [ "value" ], "type": "field" }, { "params": [], "type": "mean" } ] ], "tags": [] } ], "thresholds": [], "timeFrom": null, "timeRegions": [], "timeShift": "", "title": "Gasverbrauch VS Außentemperatur", "tooltip": { "shared": true, "sort": 0, "value_type": "individual" }, "type": "graph", "xaxis": { "buckets": null, "mode": "time", "name": null, "show": true, "values": [] }, "yaxes": [ { "decimals": null, "format": "short", "label": "Außentemperatur C°", "logBase": 1, "max": "40", "min": "-10", "show": true }, { "decimals": 0, "format": "m3", "label": "Gas m³", "logBase": 1, "max": "0", "min": "-20", "show": true } ], "yaxis": { "align": false, "alignLevel": null } }, { "datasource": null, "description": "", "fieldConfig": { "defaults": { "custom": {}, "mappings": [], "thresholds": { "mode": "absolute", "steps": [ { "color": "red", "value": null }, { "color": "semi-dark-yellow", "value": 5 }, { "color": "dark-green", "value": 15 } ] } }, "overrides": [] }, "gridPos": { "h": 8, "w": 12, "x": 0, "y": 16 }, "id": 7, "options": { "displayMode": "gradient", "orientation": "auto", "reduceOptions": { "calcs": [ "mean" ], "fields": "", "values": false }, "showUnfilled": true }, "pluginVersion": "7.0.3", "targets": [ { "alias": "Montag", "groupBy": [ { "params": [ "$__interval" ], "type": "time" }, { "params": [ "previous" ], "type": "fill" } ], "measurement": "deconz.0.sensors.00158d00023cfd10.temperature", "orderByTime": "ASC", "policy": "global", "refId": "A", "resultFormat": "time_series", "select": [ [ { "params": [ "value" ], "type": "field" }, { "params": [ "1" ], "type": "top" } ] ], "tags": [] }, { "alias": "Dienstag", "groupBy": [ { "params": [ "$__interval" ], "type": "time" }, { "params": [ "previous" ], "type": "fill" } ], "measurement": "deconz.0.sensors.00158d00036c1288.temperature", "orderByTime": "ASC", "policy": "global", "refId": "B", "resultFormat": "time_series", "select": [ [ { "params": [ "value" ], "type": "field" }, { "params": [ "1" ], "type": "top" } ] ], "tags": [] }, { "alias": "Mittwoch", "groupBy": [ { "params": [ "$__interval" ], "type": "time" }, { "params": [ "previous" ], "type": "fill" } ], "measurement": "deconz.0.sensors.00158d00036d3729.temperature", "orderByTime": "ASC", "policy": "global", "refId": "C", "resultFormat": "time_series", "select": [ [ { "params": [ "value" ], "type": "field" }, { "params": [ "1" ], "type": "top" } ] ], "tags": [] }, { "alias": "Donnerstag", "groupBy": [ { "params": [ "$__interval" ], "type": "time" }, { "params": [ "previous" ], "type": "fill" } ], "measurement": "hm-rpc.1.000A18A996EE36.1.ACTUAL_TEMPERATURE", "orderByTime": "ASC", "policy": "global", "refId": "D", "resultFormat": "time_series", "select": [ [ { "params": [ "value" ], "type": "field" }, { "params": [ "1" ], "type": "top" } ] ], "tags": [] }, { "alias": "Freitag", "groupBy": [ { "params": [ "$__interval" ], "type": "time" }, { "params": [ "previous" ], "type": "fill" } ], "measurement": "hm-rpc.1.000A18A996EE36.1.ACTUAL_TEMPERATURE", "orderByTime": "ASC", "policy": "global", "refId": "E", "resultFormat": "time_series", "select": [ [ { "params": [ "value" ], "type": "field" }, { "params": [ "1" ], "type": "top" } ] ], "tags": [] }, { "alias": "Samstag", "groupBy": [ { "params": [ "$__interval" ], "type": "time" }, { "params": [ "previous" ], "type": "fill" } ], "measurement": "hm-rpc.1.000A18A996EE36.1.ACTUAL_TEMPERATURE", "orderByTime": "ASC", "policy": "global", "refId": "F", "resultFormat": "time_series", "select": [ [ { "params": [ "value" ], "type": "field" }, { "params": [ "1" ], "type": "top" } ] ], "tags": [] }, { "alias": "Sonntag", "groupBy": [ { "params": [ "$__interval" ], "type": "time" }, { "params": [ "previous" ], "type": "fill" } ], "measurement": "hm-rpc.3.3dpsp20000.1.TEMPERATURE", "orderByTime": "ASC", "policy": "global", "refId": "G", "resultFormat": "time_series", "select": [ [ { "params": [ "value" ], "type": "field" }, { "params": [ "1" ], "type": "top" } ] ], "tags": [] } ], "timeFrom": null, "timeShift": "", "title": "Wochenübersicht", "type": "bargauge" } ], "refresh": false, "schemaVersion": 25, "style": "dark", "tags": [], "templating": { "list": [] }, "time": { "from": "now-7d", "to": "now" }, "timepicker": { "refresh_intervals": [ "10s", "30s", "1m", "5m", "15m", "30m", "1h", "2h", "1d" ] }, "timezone": "", "title": "Strom und GasÜbersichten_3", "uid": "CHcoD0zzz", "version": 2 }Wenn du alle previous Montage sammelst, kannst du dir Graphen oder Tabellen bauen mit den jeweiligen, im Zeitfenster ausgewählten Zeitbereichen.
Da kannst du z.B bei der Gasübersicht aus dem Export oben den Temperatursensor gegen Monday tauschen und siehst entweder in balken oder linie oder tabelle die verläufte der Montage.Hammer - extra für mich gebastelt - VIELEN DANK !!!
...... und funktioniert prächtig - so in der Art hatte ich mir das vorgestellt für Wochentage, Monate usw. jetzt muss ich das nur noch verinnerlichen ;)
ioBroker auf Intel Core i3-5005U NUC und Windwos10 Pro
-
Hammer - extra für mich gebastelt - VIELEN DANK !!!
...... und funktioniert prächtig - so in der Art hatte ich mir das vorgestellt für Wochentage, Monate usw. jetzt muss ich das nur noch verinnerlichen ;)
@JB_Sullivan hab das von oben Importiert aber so schaut das nicht aus wie bekommt man das so hin?
-
Hammer - extra für mich gebastelt - VIELEN DANK !!!
...... und funktioniert prächtig - so in der Art hatte ich mir das vorgestellt für Wochentage, Monate usw. jetzt muss ich das nur noch verinnerlichen ;)
@JB_Sullivan sagte in [Major Update] SourceAnalytix v0.4.7-beta.0 released !:
Hammer - extra für mich gebastelt - VIELEN DANK !!!
...... und funktioniert prächtig - so in der Art hatte ich mir das vorgestellt für Wochentage, Monate usw. jetzt muss ich das nur noch verinnerlichen ;)
ich kann dazu nur sagen, darum liebe ich diese community :D
-
@JB_Sullivan hab das von oben Importiert aber so schaut das nicht aus wie bekommt man das so hin?
@ChrisXY sagte in [Major Update] SourceAnalytix v0.4.7-beta.0 released !:
@JB_Sullivan hab das von oben Importiert aber so schaut das nicht aus wie bekommt man das so hin?
Ich habe nur die DP`s von fastsonic, gegen meine eigenen ersetzt und die Farben gedreht. Bei fastsonic war oben grün und unten rot. Ansonsten natürlich die DPs von SA für InfluxDB zugänglich gemacht.
In diesem Beispiel werden die Werte die SA von Discovergy ausliest, genutzt.
ioBroker auf Intel Core i3-5005U NUC und Windwos10 Pro
-
@ChrisXY sagte in [Major Update] SourceAnalytix v0.4.7-beta.0 released !:
@JB_Sullivan hab das von oben Importiert aber so schaut das nicht aus wie bekommt man das so hin?
Ich habe nur die DP`s von fastsonic, gegen meine eigenen ersetzt und die Farben gedreht. Bei fastsonic war oben grün und unten rot. Ansonsten natürlich die DPs von SA für InfluxDB zugänglich gemacht.
In diesem Beispiel werden die Werte die SA von Discovergy ausliest, genutzt.
@JB_Sullivan sagte in [Major Update] SourceAnalytix v0.4.7-beta.0 released !:
und die Farben gedreht
wie bekommt man den Verlauf hin?
Kann das Json nicht importieren. Bekomm da immer Fehler.° Node.js: 20.17.0 NPM: 10.8.2
° Proxmox, Ubuntu 22.04.3 LTS
° Fixer ---> iob fix
Support us
874
Online32.4k
Benutzer81.5k
Themen1.3m
Beiträge