NEWS


Grafana iFrame in VIS
-
oben der Dialog iFrame unten der normale iFrame
Zeig mal die Quelle vom iframe da kommt nur der link rein...
-
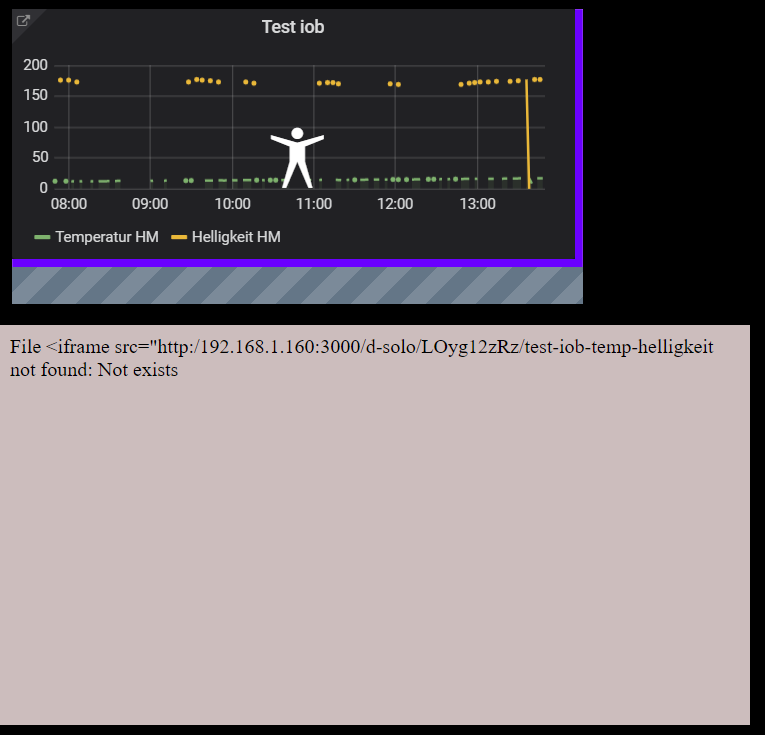
Hier die bei beiden widgets verwendete Quelle:
<iframe src="http://192.168.1.160:3000/d-solo/LOyg12zRz/test-iob-temp-helligkeit?orgId=1&panelId=2" width="450" height="200" frameborder="0"></iframe>
-
Hier die bei beiden widgets verwendete Quelle:
<iframe src="http://192.168.1.160:3000/d-solo/LOyg12zRz/test-iob-temp-helligkeit?orgId=1&panelId=2" width="450" height="200" frameborder="0"></iframe>
In das iframe kommt nur der http grafana link!
http://192.168.1.160:3000/d-solo/LOyg12zRz/test-iob-temp-helligkeit?orgId=1&panelId=2
-
Ich kämpfe nun auch schon eine Weile mit der Grafana Chart-Ansicht in VIS.
Die Settings für den enable anonymous access, org_name_org_role, allow_embedding habe ich nun alle schon mindestens 10 mal kontrolliert und den Grafana-Server neugestartet.
Der Org_Name in der Konfig ist gleich der in der WEBUI und wurde auch schon testweise mehrere male geändert.
Zugriff auf den Link eines gesharten Graphen "http://192.168.178.150:3000/d-solo/SUMXcb8Wz/smart-home-history?orgId=1&refresh=5s&panelId=3"per anderem Browser ohne den Admin-Logincookie klappt ohne Probleme und ohne Loginfenster.
Binde ich nun diesen Link im iFrame Widget in VIS ein, wird mir absolut garnichts angezeigt.
Ändere ich den Link ab auf "http://localhost:3000/d-solo/SUMXcb8Wz/smart-home-history?orgId=1&refresh=5s&panelId=3" oder "http://ubuntu-server:3000/d-solo/SUMXcb8Wz/smart-home-history?orgId=1&refresh=5s&panelId=3" wird mir angezeigt "Verbindung abgelehnt".localhost sollte ebenfalls klappen, da IOBroker und Grafana Server auf dem selben Host liegen.
Hat jemand noch eine Idee?
-
@nils50122 mal zum Vergleich
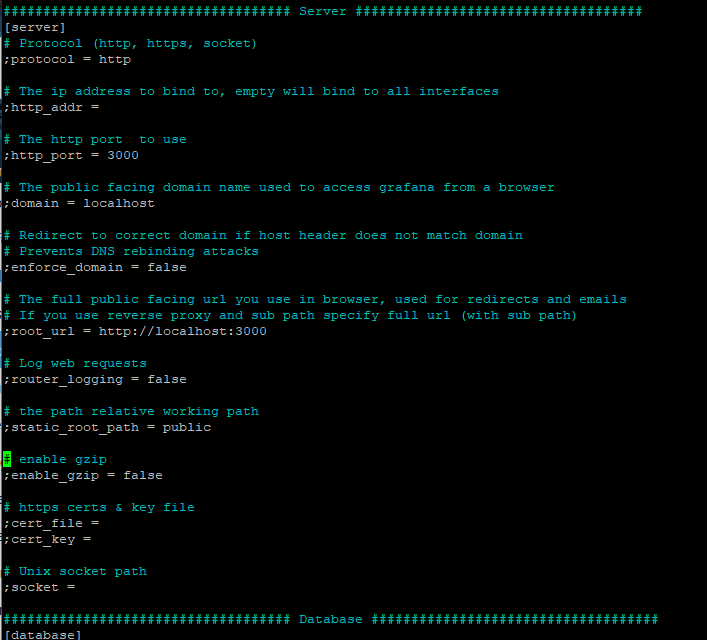
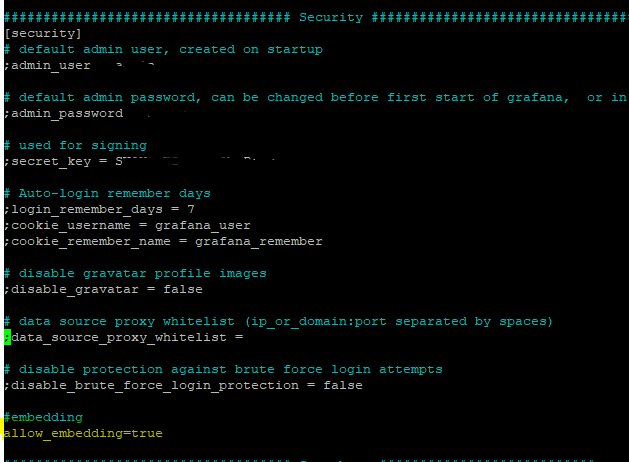
Anbei komplettes .ini File.
Ich bin mir ziemlich sicher das hier alles richtig ist und das Problem eine andere Ursache (VIS) hat.
Wie gesagt, mit anderen Clients funktioniert der anonyme Access.Der Org-Name ist in der UI identisch mit der aus der .ini.
##################### Grafana Configuration Example ##################### # # Everything has defaults so you only need to uncomment things you want to # change # possible values : production, development ;app_mode = production # instance name, defaults to HOSTNAME environment variable value or hostname if HOSTNAME var is empty ;instance_name = ${HOSTNAME} #################################### Paths #################################### [paths] # Path to where grafana can store temp files, sessions, and the sqlite3 db (if that is used) ;data = /var/lib/grafana # Temporary files in `data` directory older than given duration will be removed ;temp_data_lifetime = 24h # Directory where grafana can store logs ;logs = /var/log/grafana # Directory where grafana will automatically scan and look for plugins ;plugins = /var/lib/grafana/plugins # folder that contains provisioning config files that grafana will apply on startup and while running. ;provisioning = conf/provisioning #################################### Server #################################### [server] # Protocol (http, https, h2, socket) ;protocol = http # The ip address to bind to, empty will bind to all interfaces ;http_addr = # The http port to use ;http_port = 3000 # The public facing domain name used to access grafana from a browser ;domain = localhost # Redirect to correct domain if host header does not match domain # Prevents DNS rebinding attacks ;enforce_domain = false # The full public facing url you use in browser, used for redirects and emails # If you use reverse proxy and sub path specify full url (with sub path) ;root_url = %(protocol)s://%(domain)s:%(http_port)s/ # Serve Grafana from subpath specified in `root_url` setting. By default it is set to `false` for compatibility reasons. ;serve_from_sub_path = false # Log web requests ;router_logging = false # the path relative working path ;static_root_path = public # enable gzip ;enable_gzip = false # https certs & key file ;cert_file = ;cert_key = # Unix socket path ;socket = #################################### Database #################################### [database] # You can configure the database connection by specifying type, host, name, user and password # as separate properties or as on string using the url properties. # Either "mysql", "postgres" or "sqlite3", it's your choice ;type = sqlite3 ;host = 127.0.0.1:3306 ;name = grafana ;user = root # If the password contains # or ; you have to wrap it with triple quotes. Ex """#password;""" ;password = # Use either URL or the previous fields to configure the database # Example: mysql://user:secret@host:port/database ;url = # For "postgres" only, either "disable", "require" or "verify-full" ;ssl_mode = disable ;ca_cert_path = ;client_key_path = ;client_cert_path = ;server_cert_name = # For "sqlite3" only, path relative to data_path setting ;path = grafana.db # Max idle conn setting default is 2 ;max_idle_conn = 2 # Max conn setting default is 0 (mean not set) ;max_open_conn = # Connection Max Lifetime default is 14400 (means 14400 seconds or 4 hours) ;conn_max_lifetime = 14400 # Set to true to log the sql calls and execution times. ;log_queries = # For "sqlite3" only. cache mode setting used for connecting to the database. (private, shared) ;cache_mode = private #################################### Cache server ############################# [remote_cache] # Either "redis", "memcached" or "database" default is "database" ;type = database # cache connectionstring options # database: will use Grafana primary database. # redis: config like redis server e.g. `addr=127.0.0.1:6379,pool_size=100,db=0,ssl=false`. Only addr is required. ssl may be 'true', 'false', or 'insecure'. # memcache: 127.0.0.1:11211 ;connstr = #################################### Data proxy ########################### [dataproxy] # This enables data proxy logging, default is false ;logging = false # How long the data proxy should wait before timing out default is 30 (seconds) ;timeout = 30 # If enabled and user is not anonymous, data proxy will add X-Grafana-User header with username into the request, default is false. ;send_user_header = false #################################### Analytics #################################### [analytics] # Server reporting, sends usage counters to stats.grafana.org every 24 hours. # No ip addresses are being tracked, only simple counters to track # running instances, dashboard and error counts. It is very helpful to us. # Change this option to false to disable reporting. ;reporting_enabled = true # Set to false to disable all checks to https://grafana.net # for new vesions (grafana itself and plugins), check is used # in some UI views to notify that grafana or plugin update exists # This option does not cause any auto updates, nor send any information # only a GET request to http://grafana.com to get latest versions ;check_for_updates = true # Google Analytics universal tracking code, only enabled if you specify an id here ;google_analytics_ua_id = # Google Tag Manager ID, only enabled if you specify an id here ;google_tag_manager_id = #################################### Security #################################### [security] # disable creation of admin user on first start of grafana ;disable_initial_admin_creation = false # default admin user, created on startup ;admin_user = admin # default admin password, can be changed before first start of grafana, or in profile settings ;admin_password = admin # used for signing ;secret_key = xxxx # disable gravatar profile images ;disable_gravatar = false # data source proxy whitelist (ip_or_domain:port separated by spaces) ;data_source_proxy_whitelist = # disable protection against brute force login attempts ;disable_brute_force_login_protection = false # set to true if you host Grafana behind HTTPS. default is false. ;cookie_secure = false # set cookie SameSite attribute. defaults to `lax`. can be set to "lax", "strict", "none" and "disabled" ;cookie_samesite = lax # set to true if you want to allow browsers to render Grafana in a <frame>, <iframe>, <embed> or <object>. default is false. allow_embedding = true # Set to true if you want to enable http strict transport security (HSTS) response header. # This is only sent when HTTPS is enabled in this configuration. # HSTS tells browsers that the site should only be accessed using HTTPS. # The default version will change to true in the next minor release, 6.3. ;strict_transport_security = false # Sets how long a browser should cache HSTS. Only applied if strict_transport_security is enabled. ;strict_transport_security_max_age_seconds = 86400 # Set to true if to enable HSTS preloading option. Only applied if strict_transport_security is enabled. ;strict_transport_security_preload = false # Set to true if to enable the HSTS includeSubDomains option. Only applied if strict_transport_security is enabled. ;strict_transport_security_subdomains = false # Set to true to enable the X-Content-Type-Options response header. # The X-Content-Type-Options response HTTP header is a marker used by the server to indicate that the MIME types advertised # in the Content-Type headers should not be changed and be followed. The default will change to true in the next minor release, 6.3. ;x_content_type_options = false # Set to true to enable the X-XSS-Protection header, which tells browsers to stop pages from loading # when they detect reflected cross-site scripting (XSS) attacks. The default will change to true in the next minor release, 6.3. ;x_xss_protection = false #################################### Snapshots ########################### [snapshots] # snapshot sharing options ;external_enabled = true ;external_snapshot_url = https://snapshots-origin.raintank.io ;external_snapshot_name = Publish to snapshot.raintank.io # Set to true to enable this Grafana instance act as an external snapshot server and allow unauthenticated requests for # creating and deleting snapshots. ;public_mode = false # remove expired snapshot ;snapshot_remove_expired = true #################################### Dashboards History ################## [dashboards] # Number dashboard versions to keep (per dashboard). Default: 20, Minimum: 1 ;versions_to_keep = 20 #################################### Users ############################### [users] # disable user signup / registration allow_sign_up = false # Allow non admin users to create organizations ;allow_org_create = true # Set to true to automatically assign new users to the default organization (id 1) ;auto_assign_org = true # Set this value to automatically add new users to the provided organization (if auto_assign_org above is set to true) ;auto_assign_org_id = 1 # Default role new users will be automatically assigned (if disabled above is set to true) ;auto_assign_org_role = Viewer # Require email validation before sign up completes ;verify_email_enabled = false # Background text for the user field on the login page ;login_hint = email or username ;password_hint = password # Default UI theme ("dark" or "light") ;default_theme = dark # External user management, these options affect the organization users view ;external_manage_link_url = ;external_manage_link_name = ;external_manage_info = # Viewers can edit/inspect dashboard settings in the browser. But not save the dashboard. ;viewers_can_edit = false # Editors can administrate dashboard, folders and teams they create ;editors_can_admin = false [auth] # Login cookie name ;login_cookie_name = grafana_session # The lifetime (days) an authenticated user can be inactive before being required to login at next visit. Default is 7 days, ;login_maximum_inactive_lifetime_days = 7 # The maximum lifetime (days) an authenticated user can be logged in since login time before being required to login. Default is 30 days. ;login_maximum_lifetime_days = 30 # How often should auth tokens be rotated for authenticated users when being active. The default is each 10 minutes. ;token_rotation_interval_minutes = 10 # Set to true to disable (hide) the login form, useful if you use OAuth, defaults to false ;disable_login_form = false # Set to true to disable the signout link in the side menu. useful if you use auth.proxy, defaults to false ;disable_signout_menu = false # URL to redirect the user to after sign out ;signout_redirect_url = # Set to true to attempt login with OAuth automatically, skipping the login screen. # This setting is ignored if multiple OAuth providers are configured. ;oauth_auto_login = false # limit of api_key seconds to live before expiration ;api_key_max_seconds_to_live = -1 #################################### Anonymous Auth ###################### [auth.anonymous] # enable anonymous access enabled = true # specify organization name that should be used for unauthenticated users org_name = xxxx (made it unvisible for forum) # specify role for unauthenticated users org_role = Viewer #################################### Github Auth ########################## [auth.github] ;enabled = false ;allow_sign_up = true ;client_id = some_id ;client_secret = some_secret ;scopes = user:email,read:org ;auth_url = https://github.com/login/oauth/authorize ;token_url = https://github.com/login/oauth/access_token ;api_url = https://api.github.com/user ;allowed_domains = ;team_ids = ;allowed_organizations = #################################### GitLab Auth ######################### [auth.gitlab] ;enabled = false ;allow_sign_up = true ;client_id = some_id ;client_secret = some_secret ;scopes = api ;auth_url = https://gitlab.com/oauth/authorize ;token_url = https://gitlab.com/oauth/token ;api_url = https://gitlab.com/api/v4 ;allowed_domains = ;allowed_groups = #################################### Google Auth ########################## [auth.google] ;enabled = false ;allow_sign_up = true ;client_id = some_client_id ;client_secret = some_client_secret ;scopes = https://www.googleapis.com/auth/userinfo.profile https://www.googleapis.com/auth/userinfo.email ;auth_url = https://accounts.google.com/o/oauth2/auth ;token_url = https://accounts.google.com/o/oauth2/token ;api_url = https://www.googleapis.com/oauth2/v1/userinfo ;allowed_domains = ;hosted_domain = #################################### Grafana.com Auth #################### [auth.grafana_com] ;enabled = false ;allow_sign_up = true ;client_id = some_id ;client_secret = some_secret ;scopes = user:email ;allowed_organizations = #################################### Generic OAuth ########################## [auth.generic_oauth] ;enabled = false ;name = OAuth ;allow_sign_up = true ;client_id = some_id ;client_secret = some_secret ;scopes = user:email,read:org ;email_attribute_name = email:primary ;email_attribute_path = ;auth_url = https://foo.bar/login/oauth/authorize ;token_url = https://foo.bar/login/oauth/access_token ;api_url = https://foo.bar/user ;allowed_domains = ;team_ids = ;allowed_organizations = ;role_attribute_path = ;tls_skip_verify_insecure = false ;tls_client_cert = ;tls_client_key = ;tls_client_ca = #################################### SAML Auth ########################### [auth.saml] # Enterprise only # Defaults to false. If true, the feature is enabled. ;enabled = false # Base64-encoded public X.509 certificate. Used to sign requests to the IdP ;certificate = # Path to the public X.509 certificate. Used to sign requests to the IdP ;certificate_path = # Base64-encoded private key. Used to decrypt assertions from the IdP ;private_key = ;# Path to the private key. Used to decrypt assertions from the IdP ;private_key_path = # Base64-encoded IdP SAML metadata XML. Used to verify and obtain binding locations from the IdP ;idp_metadata = # Path to the SAML metadata XML. Used to verify and obtain binding locations from the IdP ;idp_metadata_path = # URL to fetch SAML IdP metadata. Used to verify and obtain binding locations from the IdP ;idp_metadata_url = # Duration, since the IdP issued a response and the SP is allowed to process it. Defaults to 90 seconds. ;max_issue_delay = 90s # Duration, for how long the SP's metadata should be valid. Defaults to 48 hours. ;metadata_valid_duration = 48h # Friendly name or name of the attribute within the SAML assertion to use as the user's name ;assertion_attribute_name = displayName # Friendly name or name of the attribute within the SAML assertion to use as the user's login handle ;assertion_attribute_login = mail # Friendly name or name of the attribute within the SAML assertion to use as the user's email ;assertion_attribute_email = mail #################################### Basic Auth ########################## [auth.basic] ;enabled = true #################################### Auth Proxy ########################## [auth.proxy] ;enabled = false ;header_name = X-WEBAUTH-USER ;header_property = username ;auto_sign_up = true ;sync_ttl = 60 ;whitelist = 192.168.1.1, 192.168.2.1 ;headers = Email:X-User-Email, Name:X-User-Name # Read the auth proxy docs for details on what the setting below enables ;enable_login_token = false #################################### Auth LDAP ########################## [auth.ldap] ;enabled = false ;config_file = /etc/grafana/ldap.toml ;allow_sign_up = true # LDAP backround sync (Enterprise only) # At 1 am every day ;sync_cron = "0 0 1 * * *" ;active_sync_enabled = true #################################### SMTP / Emailing ########################## [smtp] ;enabled = false ;host = localhost:25 ;user = # If the password contains # or ; you have to wrap it with triple quotes. Ex """#password;""" ;password = ;cert_file = ;key_file = ;skip_verify = false ;from_address = admin@grafana.localhost ;from_name = Grafana # EHLO identity in SMTP dialog (defaults to instance_name) ;ehlo_identity = dashboard.example.com [emails] ;welcome_email_on_sign_up = false ;templates_pattern = emails/*.html #################################### Logging ########################## [log] # Either "console", "file", "syslog". Default is console and file # Use space to separate multiple modes, e.g. "console file" ;mode = console file # Either "debug", "info", "warn", "error", "critical", default is "info" ;level = info # optional settings to set different levels for specific loggers. Ex filters = sqlstore:debug ;filters = # For "console" mode only [log.console] ;level = # log line format, valid options are text, console and json ;format = console # For "file" mode only [log.file] ;level = # log line format, valid options are text, console and json ;format = text # This enables automated log rotate(switch of following options), default is true ;log_rotate = true # Max line number of single file, default is 1000000 ;max_lines = 1000000 # Max size shift of single file, default is 28 means 1 << 28, 256MB ;max_size_shift = 28 # Segment log daily, default is true ;daily_rotate = true # Expired days of log file(delete after max days), default is 7 ;max_days = 7 [log.syslog] ;level = # log line format, valid options are text, console and json ;format = text # Syslog network type and address. This can be udp, tcp, or unix. If left blank, the default unix endpoints will be used. ;network = ;address = # Syslog facility. user, daemon and local0 through local7 are valid. ;facility = # Syslog tag. By default, the process' argv[0] is used. ;tag = #################################### Usage Quotas ######################## [quota] ; enabled = false #### set quotas to -1 to make unlimited. #### # limit number of users per Org. ; org_user = 10 # limit number of dashboards per Org. ; org_dashboard = 100 # limit number of data_sources per Org. ; org_data_source = 10 # limit number of api_keys per Org. ; org_api_key = 10 # limit number of orgs a user can create. ; user_org = 10 # Global limit of users. ; global_user = -1 # global limit of orgs. ; global_org = -1 # global limit of dashboards ; global_dashboard = -1 # global limit of api_keys ; global_api_key = -1 # global limit on number of logged in users. ; global_session = -1 #################################### Alerting ############################ [alerting] # Disable alerting engine & UI features ;enabled = true # Makes it possible to turn off alert rule execution but alerting UI is visible ;execute_alerts = true # Default setting for new alert rules. Defaults to categorize error and timeouts as alerting. (alerting, keep_state) ;error_or_timeout = alerting # Default setting for how Grafana handles nodata or null values in alerting. (alerting, no_data, keep_state, ok) ;nodata_or_nullvalues = no_data # Alert notifications can include images, but rendering many images at the same time can overload the server # This limit will protect the server from render overloading and make sure notifications are sent out quickly ;concurrent_render_limit = 5 # Default setting for alert calculation timeout. Default value is 30 ;evaluation_timeout_seconds = 30 # Default setting for alert notification timeout. Default value is 30 ;notification_timeout_seconds = 30 # Default setting for max attempts to sending alert notifications. Default value is 3 ;max_attempts = 3 # Makes it possible to enforce a minimal interval between evaluations, to reduce load on the backend ;min_interval_seconds = 1 #################################### Explore ############################# [explore] # Enable the Explore section ;enabled = true #################################### Internal Grafana Metrics ########################## # Metrics available at HTTP API Url /metrics [metrics] # Disable / Enable internal metrics ;enabled = true # Graphite Publish interval ;interval_seconds = 10 # Disable total stats (stat_totals_*) metrics to be generated ;disable_total_stats = false #If both are set, basic auth will be required for the metrics endpoint. ; basic_auth_username = ; basic_auth_password = # Send internal metrics to Graphite [metrics.graphite] # Enable by setting the address setting (ex localhost:2003) ;address = ;prefix = prod.grafana.%(instance_name)s. #################################### Grafana.com integration ########################## # Url used to import dashboards directly from Grafana.com [grafana_com] ;url = https://grafana.com #################################### Distributed tracing ############ [tracing.jaeger] # Enable by setting the address sending traces to jaeger (ex localhost:6831) ;address = localhost:6831 # Tag that will always be included in when creating new spans. ex (tag1:value1,tag2:value2) ;always_included_tag = tag1:value1 # Type specifies the type of the sampler: const, probabilistic, rateLimiting, or remote ;sampler_type = const # jaeger samplerconfig param # for "const" sampler, 0 or 1 for always false/true respectively # for "probabilistic" sampler, a probability between 0 and 1 # for "rateLimiting" sampler, the number of spans per second # for "remote" sampler, param is the same as for "probabilistic" # and indicates the initial sampling rate before the actual one # is received from the mothership ;sampler_param = 1 # Whether or not to use Zipkin propagation (x-b3- HTTP headers). ;zipkin_propagation = false # Setting this to true disables shared RPC spans. # Not disabling is the most common setting when using Zipkin elsewhere in your infrastructure. ;disable_shared_zipkin_spans = false #################################### External image storage ########################## [external_image_storage] # Used for uploading images to public servers so they can be included in slack/email messages. # you can choose between (s3, webdav, gcs, azure_blob, local) ;provider = [external_image_storage.s3] ;endpoint = ;path_style_access = ;bucket = ;region = ;path = ;access_key = ;secret_key = [external_image_storage.webdav] ;url = ;public_url = ;username = ;password = [external_image_storage.gcs] ;key_file = ;bucket = ;path = [external_image_storage.azure_blob] ;account_name = ;account_key = ;container_name = [external_image_storage.local] # does not require any configuration [rendering] # Options to configure a remote HTTP image rendering service, e.g. using https://github.com/grafana/grafana-image-renderer. # URL to a remote HTTP image renderer service, e.g. http://localhost:8081/render, will enable Grafana to render panels and dashboards to PNG-images using HTTP requests to an external service. ;server_url = # If the remote HTTP image renderer service runs on a different server than the Grafana server you may have to configure this to a URL where Grafana is reachable, e.g. http://grafana.domain/. ;callback_url = [panels] # If set to true Grafana will allow script tags in text panels. Not recommended as it enable XSS vulnerabilities. ;disable_sanitize_html = false [plugins] ;enable_alpha = false ;app_tls_skip_verify_insecure = false [enterprise] # Path to a valid Grafana Enterprise license.jwt file ;license_path = [feature_toggles] # enable features, separated by spaces ;enable = -
Anbei komplettes .ini File.
Ich bin mir ziemlich sicher das hier alles richtig ist und das Problem eine andere Ursache (VIS) hat.
Wie gesagt, mit anderen Clients funktioniert der anonyme Access.Der Org-Name ist in der UI identisch mit der aus der .ini.
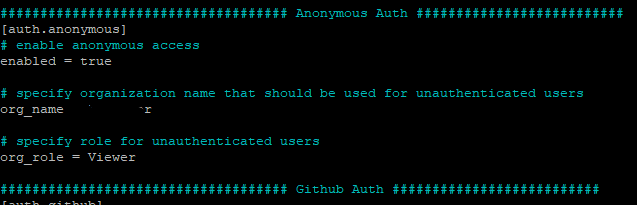
##################### Grafana Configuration Example ##################### # # Everything has defaults so you only need to uncomment things you want to # change # possible values : production, development ;app_mode = production # instance name, defaults to HOSTNAME environment variable value or hostname if HOSTNAME var is empty ;instance_name = ${HOSTNAME} #################################### Paths #################################### [paths] # Path to where grafana can store temp files, sessions, and the sqlite3 db (if that is used) ;data = /var/lib/grafana # Temporary files in `data` directory older than given duration will be removed ;temp_data_lifetime = 24h # Directory where grafana can store logs ;logs = /var/log/grafana # Directory where grafana will automatically scan and look for plugins ;plugins = /var/lib/grafana/plugins # folder that contains provisioning config files that grafana will apply on startup and while running. ;provisioning = conf/provisioning #################################### Server #################################### [server] # Protocol (http, https, h2, socket) ;protocol = http # The ip address to bind to, empty will bind to all interfaces ;http_addr = # The http port to use ;http_port = 3000 # The public facing domain name used to access grafana from a browser ;domain = localhost # Redirect to correct domain if host header does not match domain # Prevents DNS rebinding attacks ;enforce_domain = false # The full public facing url you use in browser, used for redirects and emails # If you use reverse proxy and sub path specify full url (with sub path) ;root_url = %(protocol)s://%(domain)s:%(http_port)s/ # Serve Grafana from subpath specified in `root_url` setting. By default it is set to `false` for compatibility reasons. ;serve_from_sub_path = false # Log web requests ;router_logging = false # the path relative working path ;static_root_path = public # enable gzip ;enable_gzip = false # https certs & key file ;cert_file = ;cert_key = # Unix socket path ;socket = #################################### Database #################################### [database] # You can configure the database connection by specifying type, host, name, user and password # as separate properties or as on string using the url properties. # Either "mysql", "postgres" or "sqlite3", it's your choice ;type = sqlite3 ;host = 127.0.0.1:3306 ;name = grafana ;user = root # If the password contains # or ; you have to wrap it with triple quotes. Ex """#password;""" ;password = # Use either URL or the previous fields to configure the database # Example: mysql://user:secret@host:port/database ;url = # For "postgres" only, either "disable", "require" or "verify-full" ;ssl_mode = disable ;ca_cert_path = ;client_key_path = ;client_cert_path = ;server_cert_name = # For "sqlite3" only, path relative to data_path setting ;path = grafana.db # Max idle conn setting default is 2 ;max_idle_conn = 2 # Max conn setting default is 0 (mean not set) ;max_open_conn = # Connection Max Lifetime default is 14400 (means 14400 seconds or 4 hours) ;conn_max_lifetime = 14400 # Set to true to log the sql calls and execution times. ;log_queries = # For "sqlite3" only. cache mode setting used for connecting to the database. (private, shared) ;cache_mode = private #################################### Cache server ############################# [remote_cache] # Either "redis", "memcached" or "database" default is "database" ;type = database # cache connectionstring options # database: will use Grafana primary database. # redis: config like redis server e.g. `addr=127.0.0.1:6379,pool_size=100,db=0,ssl=false`. Only addr is required. ssl may be 'true', 'false', or 'insecure'. # memcache: 127.0.0.1:11211 ;connstr = #################################### Data proxy ########################### [dataproxy] # This enables data proxy logging, default is false ;logging = false # How long the data proxy should wait before timing out default is 30 (seconds) ;timeout = 30 # If enabled and user is not anonymous, data proxy will add X-Grafana-User header with username into the request, default is false. ;send_user_header = false #################################### Analytics #################################### [analytics] # Server reporting, sends usage counters to stats.grafana.org every 24 hours. # No ip addresses are being tracked, only simple counters to track # running instances, dashboard and error counts. It is very helpful to us. # Change this option to false to disable reporting. ;reporting_enabled = true # Set to false to disable all checks to https://grafana.net # for new vesions (grafana itself and plugins), check is used # in some UI views to notify that grafana or plugin update exists # This option does not cause any auto updates, nor send any information # only a GET request to http://grafana.com to get latest versions ;check_for_updates = true # Google Analytics universal tracking code, only enabled if you specify an id here ;google_analytics_ua_id = # Google Tag Manager ID, only enabled if you specify an id here ;google_tag_manager_id = #################################### Security #################################### [security] # disable creation of admin user on first start of grafana ;disable_initial_admin_creation = false # default admin user, created on startup ;admin_user = admin # default admin password, can be changed before first start of grafana, or in profile settings ;admin_password = admin # used for signing ;secret_key = xxxx # disable gravatar profile images ;disable_gravatar = false # data source proxy whitelist (ip_or_domain:port separated by spaces) ;data_source_proxy_whitelist = # disable protection against brute force login attempts ;disable_brute_force_login_protection = false # set to true if you host Grafana behind HTTPS. default is false. ;cookie_secure = false # set cookie SameSite attribute. defaults to `lax`. can be set to "lax", "strict", "none" and "disabled" ;cookie_samesite = lax # set to true if you want to allow browsers to render Grafana in a <frame>, <iframe>, <embed> or <object>. default is false. allow_embedding = true # Set to true if you want to enable http strict transport security (HSTS) response header. # This is only sent when HTTPS is enabled in this configuration. # HSTS tells browsers that the site should only be accessed using HTTPS. # The default version will change to true in the next minor release, 6.3. ;strict_transport_security = false # Sets how long a browser should cache HSTS. Only applied if strict_transport_security is enabled. ;strict_transport_security_max_age_seconds = 86400 # Set to true if to enable HSTS preloading option. Only applied if strict_transport_security is enabled. ;strict_transport_security_preload = false # Set to true if to enable the HSTS includeSubDomains option. Only applied if strict_transport_security is enabled. ;strict_transport_security_subdomains = false # Set to true to enable the X-Content-Type-Options response header. # The X-Content-Type-Options response HTTP header is a marker used by the server to indicate that the MIME types advertised # in the Content-Type headers should not be changed and be followed. The default will change to true in the next minor release, 6.3. ;x_content_type_options = false # Set to true to enable the X-XSS-Protection header, which tells browsers to stop pages from loading # when they detect reflected cross-site scripting (XSS) attacks. The default will change to true in the next minor release, 6.3. ;x_xss_protection = false #################################### Snapshots ########################### [snapshots] # snapshot sharing options ;external_enabled = true ;external_snapshot_url = https://snapshots-origin.raintank.io ;external_snapshot_name = Publish to snapshot.raintank.io # Set to true to enable this Grafana instance act as an external snapshot server and allow unauthenticated requests for # creating and deleting snapshots. ;public_mode = false # remove expired snapshot ;snapshot_remove_expired = true #################################### Dashboards History ################## [dashboards] # Number dashboard versions to keep (per dashboard). Default: 20, Minimum: 1 ;versions_to_keep = 20 #################################### Users ############################### [users] # disable user signup / registration allow_sign_up = false # Allow non admin users to create organizations ;allow_org_create = true # Set to true to automatically assign new users to the default organization (id 1) ;auto_assign_org = true # Set this value to automatically add new users to the provided organization (if auto_assign_org above is set to true) ;auto_assign_org_id = 1 # Default role new users will be automatically assigned (if disabled above is set to true) ;auto_assign_org_role = Viewer # Require email validation before sign up completes ;verify_email_enabled = false # Background text for the user field on the login page ;login_hint = email or username ;password_hint = password # Default UI theme ("dark" or "light") ;default_theme = dark # External user management, these options affect the organization users view ;external_manage_link_url = ;external_manage_link_name = ;external_manage_info = # Viewers can edit/inspect dashboard settings in the browser. But not save the dashboard. ;viewers_can_edit = false # Editors can administrate dashboard, folders and teams they create ;editors_can_admin = false [auth] # Login cookie name ;login_cookie_name = grafana_session # The lifetime (days) an authenticated user can be inactive before being required to login at next visit. Default is 7 days, ;login_maximum_inactive_lifetime_days = 7 # The maximum lifetime (days) an authenticated user can be logged in since login time before being required to login. Default is 30 days. ;login_maximum_lifetime_days = 30 # How often should auth tokens be rotated for authenticated users when being active. The default is each 10 minutes. ;token_rotation_interval_minutes = 10 # Set to true to disable (hide) the login form, useful if you use OAuth, defaults to false ;disable_login_form = false # Set to true to disable the signout link in the side menu. useful if you use auth.proxy, defaults to false ;disable_signout_menu = false # URL to redirect the user to after sign out ;signout_redirect_url = # Set to true to attempt login with OAuth automatically, skipping the login screen. # This setting is ignored if multiple OAuth providers are configured. ;oauth_auto_login = false # limit of api_key seconds to live before expiration ;api_key_max_seconds_to_live = -1 #################################### Anonymous Auth ###################### [auth.anonymous] # enable anonymous access enabled = true # specify organization name that should be used for unauthenticated users org_name = xxxx (made it unvisible for forum) # specify role for unauthenticated users org_role = Viewer #################################### Github Auth ########################## [auth.github] ;enabled = false ;allow_sign_up = true ;client_id = some_id ;client_secret = some_secret ;scopes = user:email,read:org ;auth_url = https://github.com/login/oauth/authorize ;token_url = https://github.com/login/oauth/access_token ;api_url = https://api.github.com/user ;allowed_domains = ;team_ids = ;allowed_organizations = #################################### GitLab Auth ######################### [auth.gitlab] ;enabled = false ;allow_sign_up = true ;client_id = some_id ;client_secret = some_secret ;scopes = api ;auth_url = https://gitlab.com/oauth/authorize ;token_url = https://gitlab.com/oauth/token ;api_url = https://gitlab.com/api/v4 ;allowed_domains = ;allowed_groups = #################################### Google Auth ########################## [auth.google] ;enabled = false ;allow_sign_up = true ;client_id = some_client_id ;client_secret = some_client_secret ;scopes = https://www.googleapis.com/auth/userinfo.profile https://www.googleapis.com/auth/userinfo.email ;auth_url = https://accounts.google.com/o/oauth2/auth ;token_url = https://accounts.google.com/o/oauth2/token ;api_url = https://www.googleapis.com/oauth2/v1/userinfo ;allowed_domains = ;hosted_domain = #################################### Grafana.com Auth #################### [auth.grafana_com] ;enabled = false ;allow_sign_up = true ;client_id = some_id ;client_secret = some_secret ;scopes = user:email ;allowed_organizations = #################################### Generic OAuth ########################## [auth.generic_oauth] ;enabled = false ;name = OAuth ;allow_sign_up = true ;client_id = some_id ;client_secret = some_secret ;scopes = user:email,read:org ;email_attribute_name = email:primary ;email_attribute_path = ;auth_url = https://foo.bar/login/oauth/authorize ;token_url = https://foo.bar/login/oauth/access_token ;api_url = https://foo.bar/user ;allowed_domains = ;team_ids = ;allowed_organizations = ;role_attribute_path = ;tls_skip_verify_insecure = false ;tls_client_cert = ;tls_client_key = ;tls_client_ca = #################################### SAML Auth ########################### [auth.saml] # Enterprise only # Defaults to false. If true, the feature is enabled. ;enabled = false # Base64-encoded public X.509 certificate. Used to sign requests to the IdP ;certificate = # Path to the public X.509 certificate. Used to sign requests to the IdP ;certificate_path = # Base64-encoded private key. Used to decrypt assertions from the IdP ;private_key = ;# Path to the private key. Used to decrypt assertions from the IdP ;private_key_path = # Base64-encoded IdP SAML metadata XML. Used to verify and obtain binding locations from the IdP ;idp_metadata = # Path to the SAML metadata XML. Used to verify and obtain binding locations from the IdP ;idp_metadata_path = # URL to fetch SAML IdP metadata. Used to verify and obtain binding locations from the IdP ;idp_metadata_url = # Duration, since the IdP issued a response and the SP is allowed to process it. Defaults to 90 seconds. ;max_issue_delay = 90s # Duration, for how long the SP's metadata should be valid. Defaults to 48 hours. ;metadata_valid_duration = 48h # Friendly name or name of the attribute within the SAML assertion to use as the user's name ;assertion_attribute_name = displayName # Friendly name or name of the attribute within the SAML assertion to use as the user's login handle ;assertion_attribute_login = mail # Friendly name or name of the attribute within the SAML assertion to use as the user's email ;assertion_attribute_email = mail #################################### Basic Auth ########################## [auth.basic] ;enabled = true #################################### Auth Proxy ########################## [auth.proxy] ;enabled = false ;header_name = X-WEBAUTH-USER ;header_property = username ;auto_sign_up = true ;sync_ttl = 60 ;whitelist = 192.168.1.1, 192.168.2.1 ;headers = Email:X-User-Email, Name:X-User-Name # Read the auth proxy docs for details on what the setting below enables ;enable_login_token = false #################################### Auth LDAP ########################## [auth.ldap] ;enabled = false ;config_file = /etc/grafana/ldap.toml ;allow_sign_up = true # LDAP backround sync (Enterprise only) # At 1 am every day ;sync_cron = "0 0 1 * * *" ;active_sync_enabled = true #################################### SMTP / Emailing ########################## [smtp] ;enabled = false ;host = localhost:25 ;user = # If the password contains # or ; you have to wrap it with triple quotes. Ex """#password;""" ;password = ;cert_file = ;key_file = ;skip_verify = false ;from_address = admin@grafana.localhost ;from_name = Grafana # EHLO identity in SMTP dialog (defaults to instance_name) ;ehlo_identity = dashboard.example.com [emails] ;welcome_email_on_sign_up = false ;templates_pattern = emails/*.html #################################### Logging ########################## [log] # Either "console", "file", "syslog". Default is console and file # Use space to separate multiple modes, e.g. "console file" ;mode = console file # Either "debug", "info", "warn", "error", "critical", default is "info" ;level = info # optional settings to set different levels for specific loggers. Ex filters = sqlstore:debug ;filters = # For "console" mode only [log.console] ;level = # log line format, valid options are text, console and json ;format = console # For "file" mode only [log.file] ;level = # log line format, valid options are text, console and json ;format = text # This enables automated log rotate(switch of following options), default is true ;log_rotate = true # Max line number of single file, default is 1000000 ;max_lines = 1000000 # Max size shift of single file, default is 28 means 1 << 28, 256MB ;max_size_shift = 28 # Segment log daily, default is true ;daily_rotate = true # Expired days of log file(delete after max days), default is 7 ;max_days = 7 [log.syslog] ;level = # log line format, valid options are text, console and json ;format = text # Syslog network type and address. This can be udp, tcp, or unix. If left blank, the default unix endpoints will be used. ;network = ;address = # Syslog facility. user, daemon and local0 through local7 are valid. ;facility = # Syslog tag. By default, the process' argv[0] is used. ;tag = #################################### Usage Quotas ######################## [quota] ; enabled = false #### set quotas to -1 to make unlimited. #### # limit number of users per Org. ; org_user = 10 # limit number of dashboards per Org. ; org_dashboard = 100 # limit number of data_sources per Org. ; org_data_source = 10 # limit number of api_keys per Org. ; org_api_key = 10 # limit number of orgs a user can create. ; user_org = 10 # Global limit of users. ; global_user = -1 # global limit of orgs. ; global_org = -1 # global limit of dashboards ; global_dashboard = -1 # global limit of api_keys ; global_api_key = -1 # global limit on number of logged in users. ; global_session = -1 #################################### Alerting ############################ [alerting] # Disable alerting engine & UI features ;enabled = true # Makes it possible to turn off alert rule execution but alerting UI is visible ;execute_alerts = true # Default setting for new alert rules. Defaults to categorize error and timeouts as alerting. (alerting, keep_state) ;error_or_timeout = alerting # Default setting for how Grafana handles nodata or null values in alerting. (alerting, no_data, keep_state, ok) ;nodata_or_nullvalues = no_data # Alert notifications can include images, but rendering many images at the same time can overload the server # This limit will protect the server from render overloading and make sure notifications are sent out quickly ;concurrent_render_limit = 5 # Default setting for alert calculation timeout. Default value is 30 ;evaluation_timeout_seconds = 30 # Default setting for alert notification timeout. Default value is 30 ;notification_timeout_seconds = 30 # Default setting for max attempts to sending alert notifications. Default value is 3 ;max_attempts = 3 # Makes it possible to enforce a minimal interval between evaluations, to reduce load on the backend ;min_interval_seconds = 1 #################################### Explore ############################# [explore] # Enable the Explore section ;enabled = true #################################### Internal Grafana Metrics ########################## # Metrics available at HTTP API Url /metrics [metrics] # Disable / Enable internal metrics ;enabled = true # Graphite Publish interval ;interval_seconds = 10 # Disable total stats (stat_totals_*) metrics to be generated ;disable_total_stats = false #If both are set, basic auth will be required for the metrics endpoint. ; basic_auth_username = ; basic_auth_password = # Send internal metrics to Graphite [metrics.graphite] # Enable by setting the address setting (ex localhost:2003) ;address = ;prefix = prod.grafana.%(instance_name)s. #################################### Grafana.com integration ########################## # Url used to import dashboards directly from Grafana.com [grafana_com] ;url = https://grafana.com #################################### Distributed tracing ############ [tracing.jaeger] # Enable by setting the address sending traces to jaeger (ex localhost:6831) ;address = localhost:6831 # Tag that will always be included in when creating new spans. ex (tag1:value1,tag2:value2) ;always_included_tag = tag1:value1 # Type specifies the type of the sampler: const, probabilistic, rateLimiting, or remote ;sampler_type = const # jaeger samplerconfig param # for "const" sampler, 0 or 1 for always false/true respectively # for "probabilistic" sampler, a probability between 0 and 1 # for "rateLimiting" sampler, the number of spans per second # for "remote" sampler, param is the same as for "probabilistic" # and indicates the initial sampling rate before the actual one # is received from the mothership ;sampler_param = 1 # Whether or not to use Zipkin propagation (x-b3- HTTP headers). ;zipkin_propagation = false # Setting this to true disables shared RPC spans. # Not disabling is the most common setting when using Zipkin elsewhere in your infrastructure. ;disable_shared_zipkin_spans = false #################################### External image storage ########################## [external_image_storage] # Used for uploading images to public servers so they can be included in slack/email messages. # you can choose between (s3, webdav, gcs, azure_blob, local) ;provider = [external_image_storage.s3] ;endpoint = ;path_style_access = ;bucket = ;region = ;path = ;access_key = ;secret_key = [external_image_storage.webdav] ;url = ;public_url = ;username = ;password = [external_image_storage.gcs] ;key_file = ;bucket = ;path = [external_image_storage.azure_blob] ;account_name = ;account_key = ;container_name = [external_image_storage.local] # does not require any configuration [rendering] # Options to configure a remote HTTP image rendering service, e.g. using https://github.com/grafana/grafana-image-renderer. # URL to a remote HTTP image renderer service, e.g. http://localhost:8081/render, will enable Grafana to render panels and dashboards to PNG-images using HTTP requests to an external service. ;server_url = # If the remote HTTP image renderer service runs on a different server than the Grafana server you may have to configure this to a URL where Grafana is reachable, e.g. http://grafana.domain/. ;callback_url = [panels] # If set to true Grafana will allow script tags in text panels. Not recommended as it enable XSS vulnerabilities. ;disable_sanitize_html = false [plugins] ;enable_alpha = false ;app_tls_skip_verify_insecure = false [enterprise] # Path to a valid Grafana Enterprise license.jwt file ;license_path = [feature_toggles] # enable features, separated by spaces ;enable =#################################### Anonymous Auth ###################### [auth.anonymous] # enable anonymous access enabled = true # specify organization name that should be used for unauthenticated users org_name = xxxx (made it unvisible for forum)** # specify role for unauthenticated users org_role = Viewerich wette der org name ist falsch
zigbee hab ich, zwave auch, nuc's genauso und HA auch
-
#################################### Anonymous Auth ######################
[auth.anonymous]
# enable anonymous access
enabled = true

# specify organization name that should be used for unauthenticated users
org_name = xxxx (made it unvisible for forum)**

# specify role for unauthenticated users
org_role = Viewer
ich wette der org name ist falsch
-
Da wette ich gegen...
Gerade auch noch mal beide Einträge der INIs getestet.
Sonst würde er mir ja auch nicht auf einem anderen Client der kein Session-Login-Cookie besitzt die Views mit der orgid=1 anzeigen.
@nils50122 also wenn es bei anderen funktioniert und bei dir nicht .. dann wird es wohl bestimmt an der VIS liegen.. ne ist klar..
fang doch mal klein an
läuft iobroker mit https ?? oder mit http
geht das
http://192.168.178.150:3000/zigbee hab ich, zwave auch, nuc's genauso und HA auch
-
@nils50122 also wenn es bei anderen funktioniert und bei dir nicht .. dann wird es wohl bestimmt an der VIS liegen.. ne ist klar..
fang doch mal klein an
läuft iobroker mit https ?? oder mit http
geht das
http://192.168.178.150:3000/IOBroker und WEB läuft per HTTPS.
Grafana UI läuft per HTTP und HTTPS.Beide Varianten "https://192.168.178.150:3000" und "http://192.168.178.150:3000" laufen nicht als iFrame.
-
IOBroker und WEB läuft per HTTPS.
Grafana UI läuft per HTTP und HTTPS.Beide Varianten "https://192.168.178.150:3000" und "http://192.168.178.150:3000" laufen nicht als iFrame.
@nils50122 siehst da sind wir bei ...
von https darf ein iframe nicht auf ein http -> geht nicht, zumindest nicht so einfach
von https auf https sollte gehen wenn du die in grafana gültige Zertifikate eingepflegt hastzigbee hab ich, zwave auch, nuc's genauso und HA auch
-
@nils50122 siehst da sind wir bei ...
von https darf ein iframe nicht auf ein http -> geht nicht, zumindest nicht so einfach
von https auf https sollte gehen wenn du die in grafana gültige Zertifikate eingepflegt hast@arteck Ich habe auch Probleme mit Grafana in iFrame. In VIS habe ich den den Link in iFrame eingefügt.
Doch das Diagramm Grafik bleibt nicht sichtbar, erst wenn ich in der VIS Runtime auf das leere Diagrammframe klicke wird das Diagramm sichtbar.
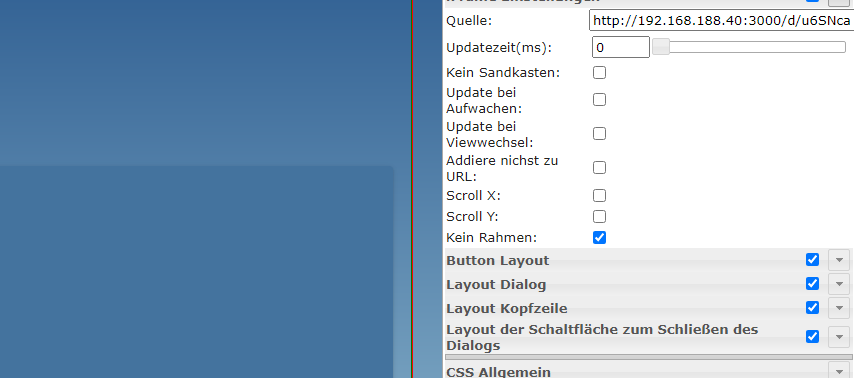
http://192.168.188.40:3000/d/u6SNcaWRk/raspi?orgId=1&from=1605968733993&to=1605972333994Raspi4 8 GB mit Aqara Zigbee USB, iob und PI-hole
Innogy Smarthome
Bosch Bridge 2
HUE Bridge
OpenWB Wallbox mit EVU Kit
Google Nest Pro Hub -
@arteck Ich habe auch Probleme mit Grafana in iFrame. In VIS habe ich den den Link in iFrame eingefügt.
Doch das Diagramm Grafik bleibt nicht sichtbar, erst wenn ich in der VIS Runtime auf das leere Diagrammframe klicke wird das Diagramm sichtbar.
http://192.168.188.40:3000/d/u6SNcaWRk/raspi?orgId=1&from=1605968733993&to=1605972333994@werner2000x Es geht jetzt nachdem ich folgende Anleitung gesehen habe. Dort ist allerdings das iFrame 8 gewählt was nei mir nicht geht aber das iFrame geht jetzt.
https://www.smarthome-tricks.de/software-iobroker/6-3-grafana-iobroker-vis-integration/ -
Hallo!
Letzte Woche habe ich Grafana von 6.? auf 7.3.4 upgedatet.
Seit dem zeigt es mir in der VIS nur noch "localhost hat die Verbindung abgelehnt" an.Hier ein Auszug aus meinen Einstellungen in Grafana:
Hat jemand eine Idee, an was das liegen kann?
Danke schon mal für die Hilfe! -
Mit welchen widget kann ich das Diagramm in die vis integrieren? Ich habe bereits die Anleitung durch und habe auch die config geändert damit man sich nicht mehr Anmelden muss.
Bis jetzt habe ich das mit den Widget IFrame probiert. Aber dort kommt diese Meldung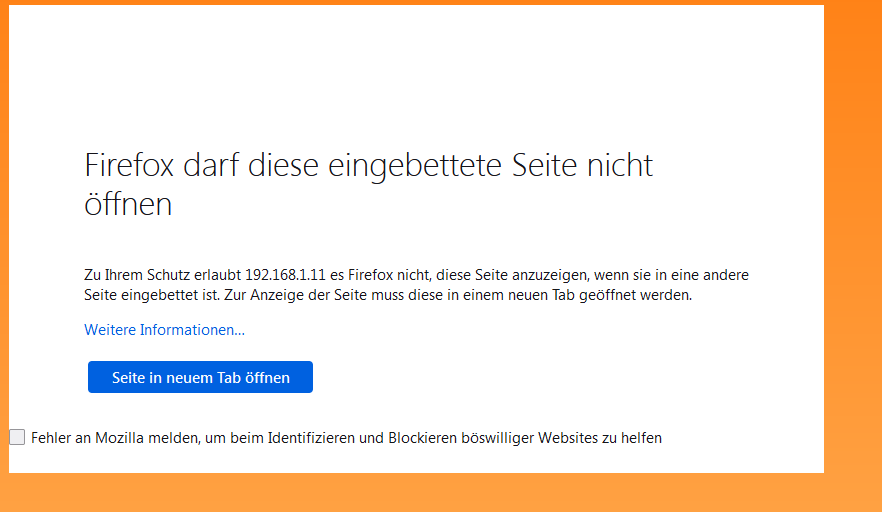
-
Mit welchen widget kann ich das Diagramm in die vis integrieren? Ich habe bereits die Anleitung durch und habe auch die config geändert damit man sich nicht mehr Anmelden muss.
Bis jetzt habe ich das mit den Widget IFrame probiert. Aber dort kommt diese MeldungIframe ist richtig. Wenn du in der grafana.ini iframe erlaubt hat, dann sollte es mit dem richtigen shared link gehen. Zeig mal wie der aussieht bei dir.
-
Iframe ist richtig. Wenn du in der grafana.ini iframe erlaubt hat, dann sollte es mit dem richtigen shared link gehen. Zeig mal wie der aussieht bei dir.
@saeft_2003 ```
Das hier habe ich verändert[security] allow_embedding = true [auth.anonymous] enabled = true org_name = Main Org. org_role = Viewer [users] allow_sign_up = falseIobroker läuft als VM auf Proxmoxserver x folgende Hersteller im Einsatz Sonoff, Gosund, Siemens x Aofo über Tasmota x Zigbee x das Smarthome wächst und wächst
-
Iframe ist richtig. Wenn du in der grafana.ini iframe erlaubt hat, dann sollte es mit dem richtigen shared link gehen. Zeig mal wie der aussieht bei dir.
@saeft_2003 Unter welcher Rubrik finde ich IFrame :)
-
@saeft_2003 Unter welcher Rubrik finde ich IFrame :)
@basti97 sagte in Grafana iFrame in VIS:
@saeft_2003 Unter welcher Rubrik finde ich IFrame :)
Das ist das: allow_embedding = true
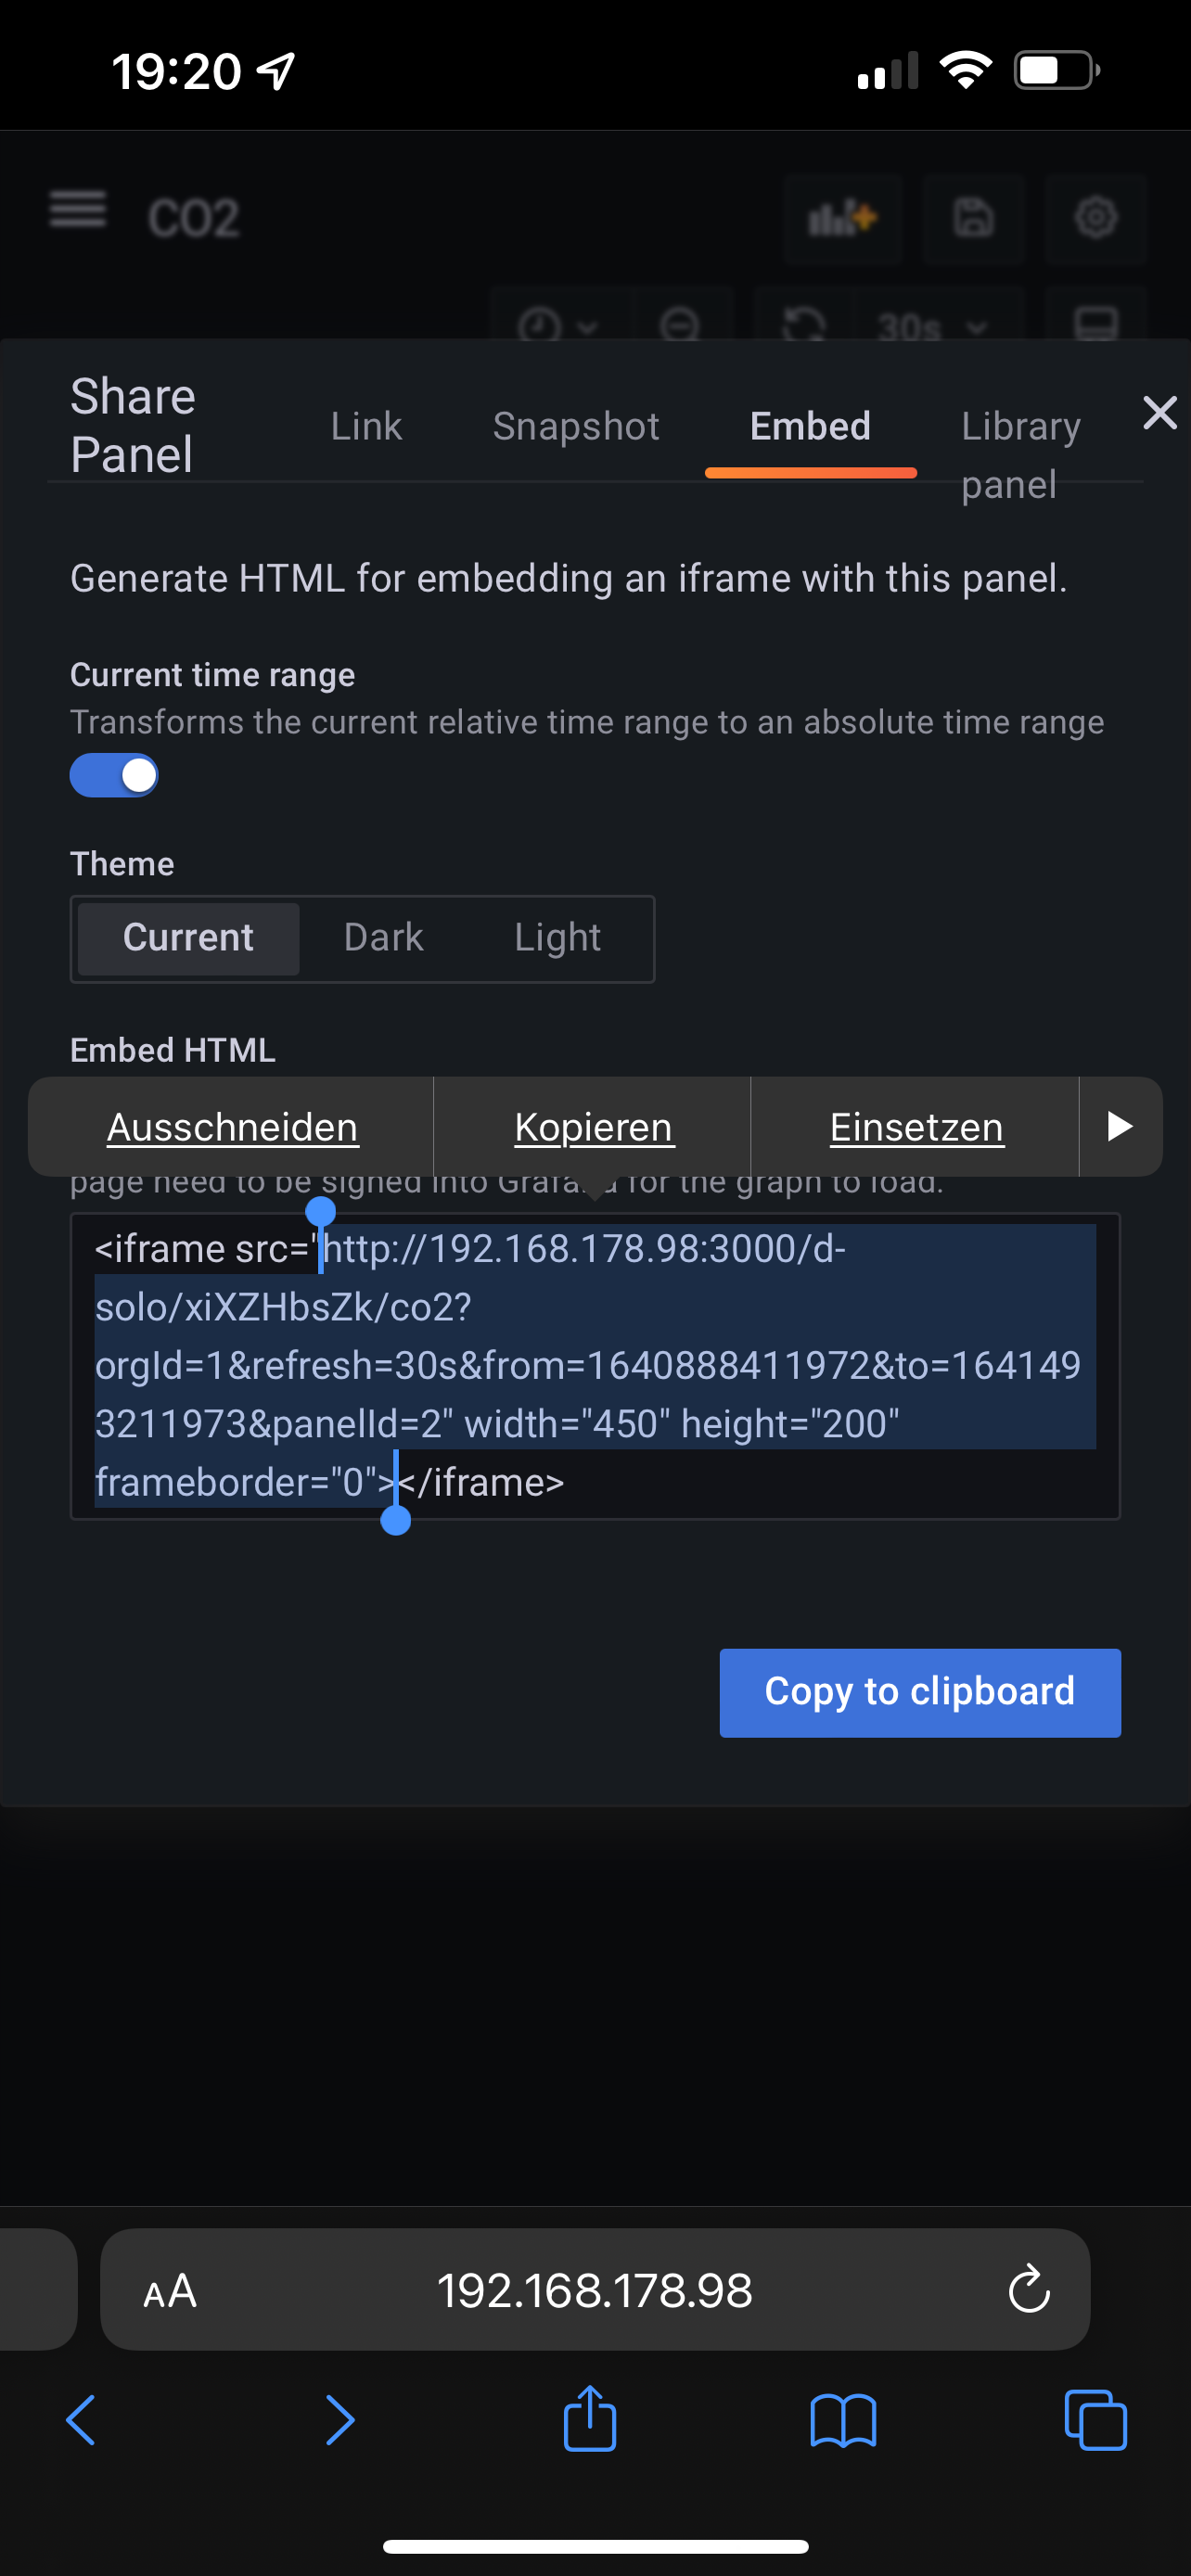
Zeig doch bitte mal den Grafana link den du in das iframe einfügst.
Das füge ich bei mir in das iframe ein:
http://192.168.178.98:3000/d-solo/xiXZHbsZk/co2?orgId=1&refresh=30s&from=1640888319834&to=1641493119834&panelId=2" width="450" height="200" frameborder="0"Zu finden hier
Support us
844
Online32.4k
Benutzer81.5k
Themen1.3m
Beiträge