NEWS


Welche proxmox VMs habt ihr?
-
Ich bin jetzt relativ sicher, dass es gar nicht am Grafana-Zugang bzw. am org_name selber liegt. Es hat irgendetwas mit dem generellen Zugriff/Berechtigung aus dem iFrame zu tun. Manche lokale IP-Adressen funktionieren und mache nicht.
http://192.168.178.1 ->fritzbox Anmeldung funktioniert im iframe
http://192.[..] ->debmatic als ProxmoxVM funktioniert im iframe
http://192.[..] ->shelly, sonoffs funktionieren im iframe
http://192.[..] ->sogar die Proxmox WebUI funktioniert im iframe
aber:
http://192.[...] ->openmediavault als ProxmoxVM kann nicht im iframe aufgerufen werden
http://192.[...]:3000 ->grafana login als ProxmoxLXC kann nicht im iframe aufgerufen werden
http://192.[...] ->raspberrymatic als eigener PI-Rechner kann nicht aufgerufen werden
Es wird immer "192.[…] hat die Verbindung abgelehnt."Was ist denn anders? Warum geht es mal und mal nicht?
Bin zur Zeit ratlos. -
Ich bin jetzt relativ sicher, dass es gar nicht am Grafana-Zugang bzw. am org_name selber liegt. Es hat irgendetwas mit dem generellen Zugriff/Berechtigung aus dem iFrame zu tun. Manche lokale IP-Adressen funktionieren und mache nicht.
http://192.168.178.1 ->fritzbox Anmeldung funktioniert im iframe
http://192.[..] ->debmatic als ProxmoxVM funktioniert im iframe
http://192.[..] ->shelly, sonoffs funktionieren im iframe
http://192.[..] ->sogar die Proxmox WebUI funktioniert im iframe
aber:
http://192.[...] ->openmediavault als ProxmoxVM kann nicht im iframe aufgerufen werden
http://192.[...]:3000 ->grafana login als ProxmoxLXC kann nicht im iframe aufgerufen werden
http://192.[...] ->raspberrymatic als eigener PI-Rechner kann nicht aufgerufen werden
Es wird immer "192.[…] hat die Verbindung abgelehnt."Was ist denn anders? Warum geht es mal und mal nicht?
Bin zur Zeit ratlos.@Frank_y dazu kenn ich mich leider nicht aus, du kannst versuchen , in Grafana einen extra Benutzer dafür anzulegen.
Wird glaub ich, bei dem oben verlinktem Video auch angedeutet, das bei manchen das so nicht funktioniert und ein Benutzer dafür angelegt werden soll.
wäre zumindest mal ein Versuch wert. -
Ich bin jetzt relativ sicher, dass es gar nicht am Grafana-Zugang bzw. am org_name selber liegt. Es hat irgendetwas mit dem generellen Zugriff/Berechtigung aus dem iFrame zu tun. Manche lokale IP-Adressen funktionieren und mache nicht.
http://192.168.178.1 ->fritzbox Anmeldung funktioniert im iframe
http://192.[..] ->debmatic als ProxmoxVM funktioniert im iframe
http://192.[..] ->shelly, sonoffs funktionieren im iframe
http://192.[..] ->sogar die Proxmox WebUI funktioniert im iframe
aber:
http://192.[...] ->openmediavault als ProxmoxVM kann nicht im iframe aufgerufen werden
http://192.[...]:3000 ->grafana login als ProxmoxLXC kann nicht im iframe aufgerufen werden
http://192.[...] ->raspberrymatic als eigener PI-Rechner kann nicht aufgerufen werden
Es wird immer "192.[…] hat die Verbindung abgelehnt."Was ist denn anders? Warum geht es mal und mal nicht?
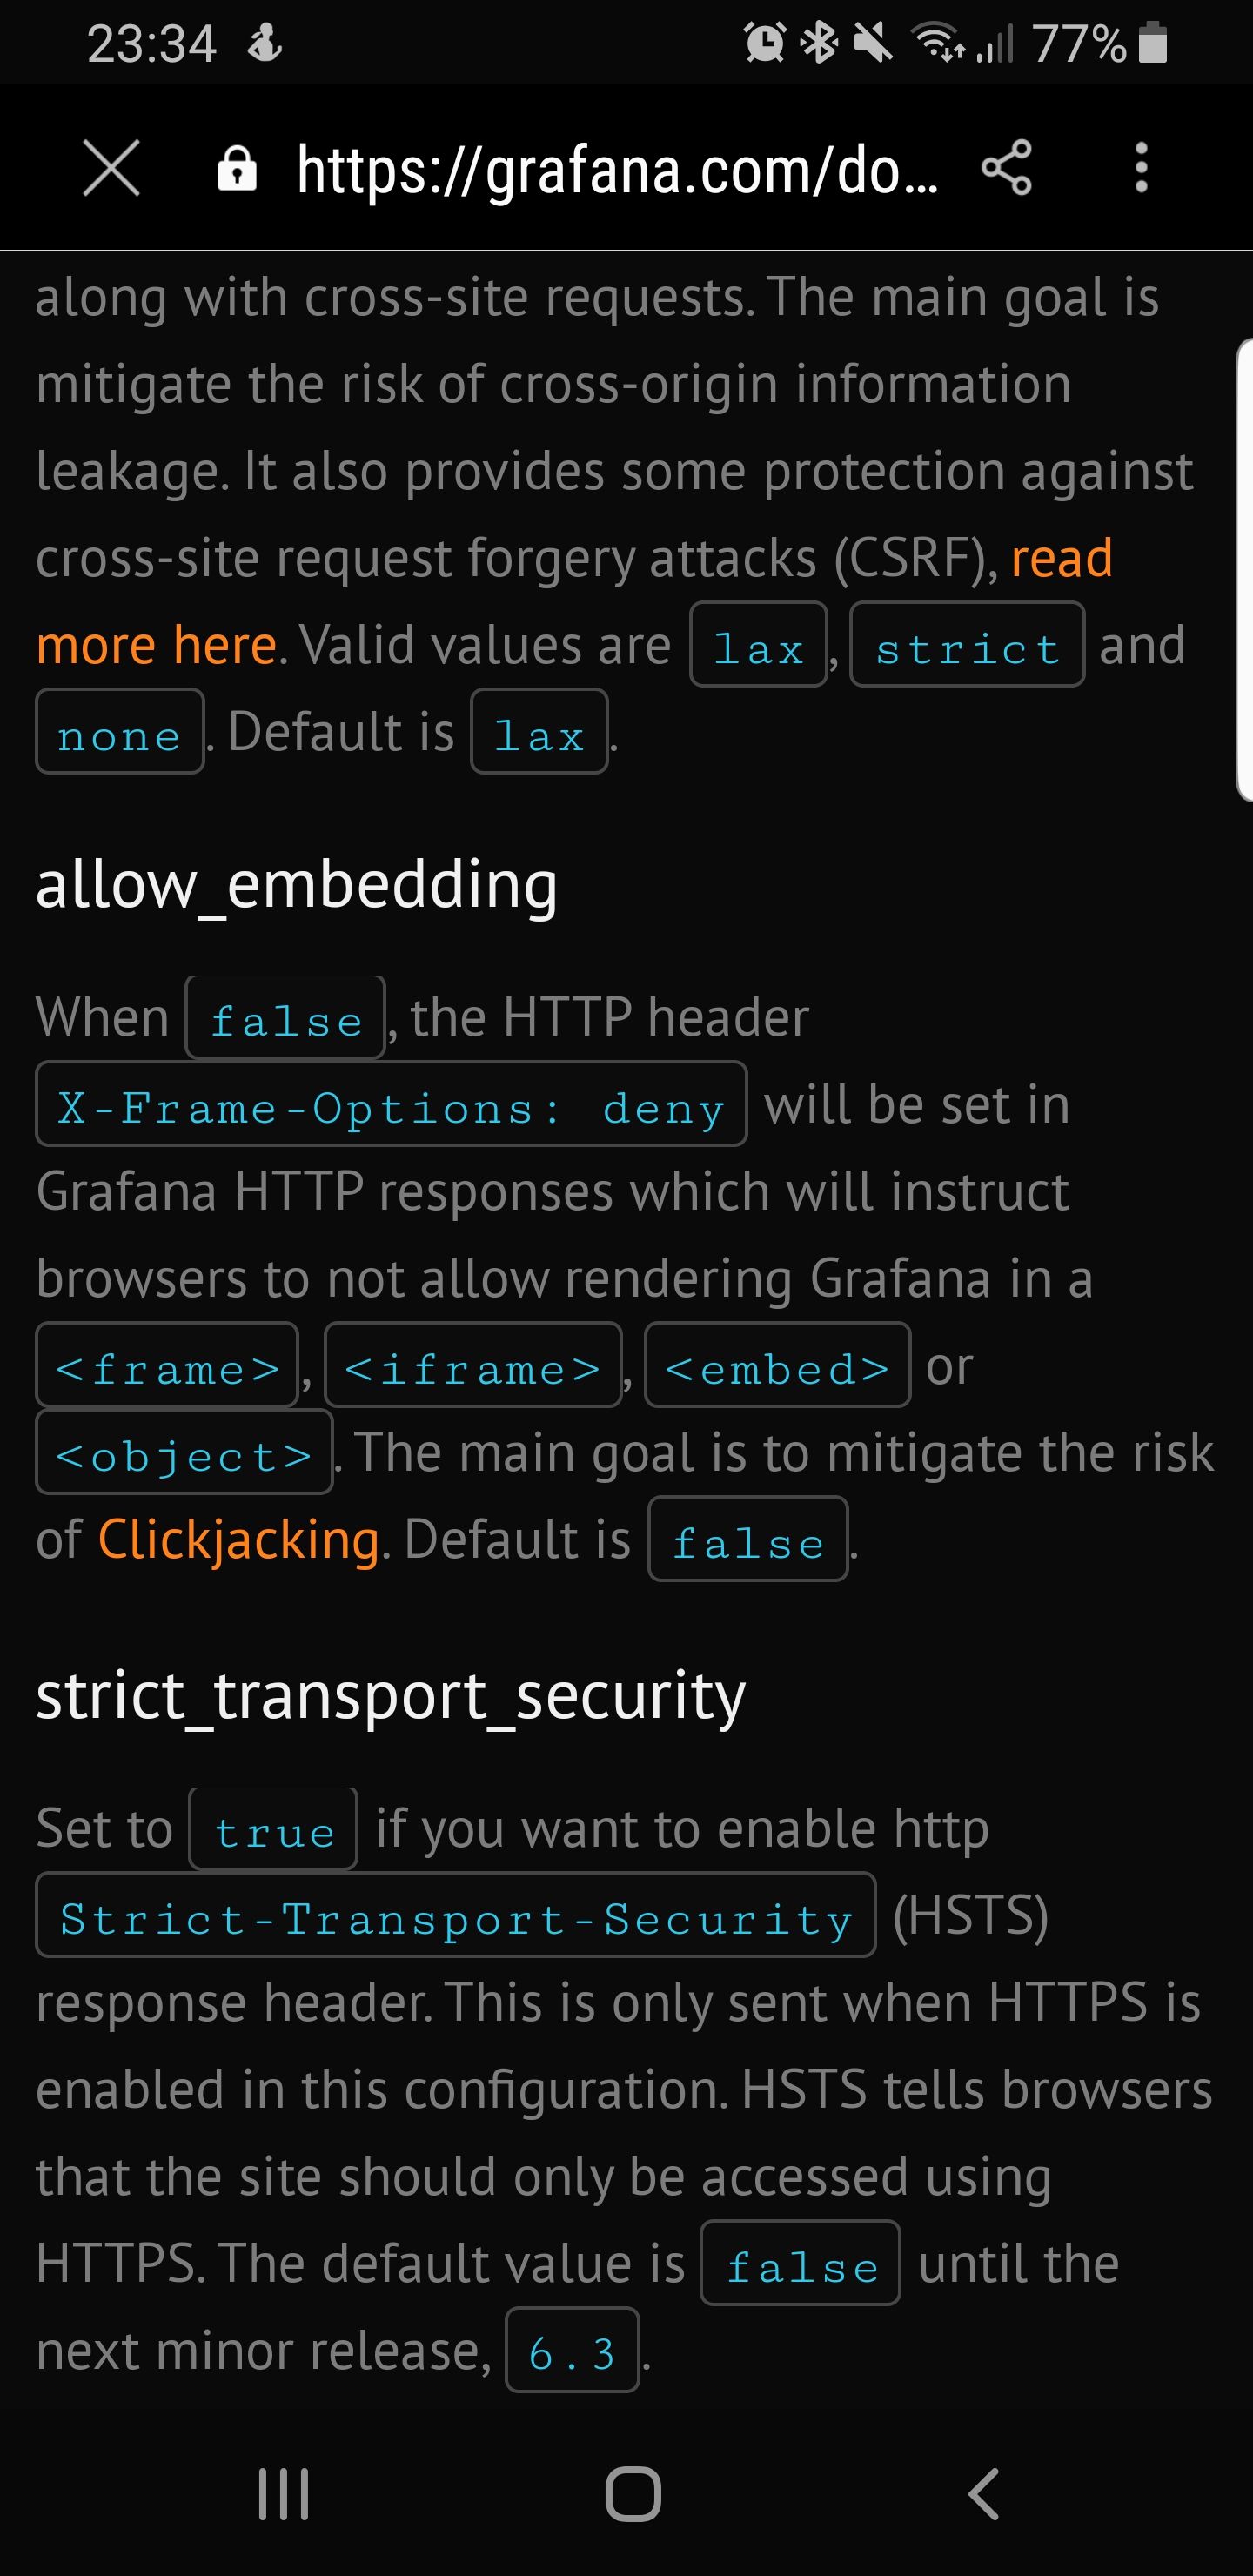
Bin zur Zeit ratlos.@Frank_y, da ich heute erst selber Grafana aufgesetzt habe und ein Dashboard von Grafana einbinden wollte kenne ich das Problem. Bei Grafana selber gibt es eine Setting "allow_embedding" in der grafana.ini, welche auf true gestellt werden muss.
Es gibt wohl mittlerweile die Möglichkeit das die Hersteller/Programmierer selber entscheiden können ob es möglich ist eine Seite im iframe zu integrieren. Bei Grafana ist es im Standard auf false, sobald die Setting gemacht ist geht es auch.
Gruß
Sempre -
@Frank_y, da ich heute erst selber Grafana aufgesetzt habe und ein Dashboard von Grafana einbinden wollte kenne ich das Problem. Bei Grafana selber gibt es eine Setting "allow_embedding" in der grafana.ini, welche auf true gestellt werden muss.
Es gibt wohl mittlerweile die Möglichkeit das die Hersteller/Programmierer selber entscheiden können ob es möglich ist eine Seite im iframe zu integrieren. Bei Grafana ist es im Standard auf false, sobald die Setting gemacht ist geht es auch.
Gruß
Sempre@Sempre sagte in Welche proxmox VMs habt ihr?:
@Frank_y, da ich heute erst selber Grafana aufgesetzt habe und ein Dashboard von Grafana einbinden wollte kenne ich das Problem. Bei Grafana selber gibt es eine Setting "allow_embedding" in der grafana.ini, welche auf true gestellt werden muss.
Es gibt wohl mittlerweile die Möglichkeit das die Hersteller/Programmierer selber entscheiden können ob es möglich ist eine Seite im iframe zu integrieren. Bei Grafana ist es im Standard auf false, sobald die Setting gemacht ist geht es auch.
Gruß
Sempre@Sempre Du bist mein Held für heute: Läuft, daran lag es!!
Vielen Dank -
@Frank_y, da ich heute erst selber Grafana aufgesetzt habe und ein Dashboard von Grafana einbinden wollte kenne ich das Problem. Bei Grafana selber gibt es eine Setting "allow_embedding" in der grafana.ini, welche auf true gestellt werden muss.
Es gibt wohl mittlerweile die Möglichkeit das die Hersteller/Programmierer selber entscheiden können ob es möglich ist eine Seite im iframe zu integrieren. Bei Grafana ist es im Standard auf false, sobald die Setting gemacht ist geht es auch.
Gruß
Sempre@Sempre sagte in Welche proxmox VMs habt ihr?:
Bei Grafana selber gibt es eine Setting "allow_embedding" in der grafana.ini, welche auf true gestellt werden muss.
Ich habe einen solchen Eintrag in der grafana.ini nicht finden können.
Hast Du diesen einfach am Ende hinzugefügt?ioBroker auf NUC (VM debian v13 (Trixie ), node v22.21.0 npm v10.9.4, js-controller v7.1.0 jsonl/jsonl / HomeMatic CCU-2 (Wired und Funk) / Philips HUE / echo.DOT / Broadlink RM pro / SONOS
-
@Sempre sagte in Welche proxmox VMs habt ihr?:
Bei Grafana selber gibt es eine Setting "allow_embedding" in der grafana.ini, welche auf true gestellt werden muss.
Ich habe einen solchen Eintrag in der grafana.ini nicht finden können.
Hast Du diesen einfach am Ende hinzugefügt?@BBTown das kommt auf deine Version an, ist erst in der neuen Version 6.2 eingeführt worden
https://github.com/ceph/ceph-ansible/issues/4084umgestiegen von Proxmox auf Unraid
-
@BBTown das kommt auf deine Version an, ist erst in der neuen Version 6.2 eingeführt worden
https://github.com/ceph/ceph-ansible/issues/4084@crunchip sagte in Welche proxmox VMs habt ihr?:
das kommt auf deine Version an, ist erst in der neuen Version 6.2 eingeführt worden
Ich habe die v6.2.5, dort war kein allow_embedding Eintrag in der grafana.ini aufgeführt.
-
@crunchip sagte in Welche proxmox VMs habt ihr?:
das kommt auf deine Version an, ist erst in der neuen Version 6.2 eingeführt worden
Ich habe die v6.2.5, dort war kein allow_embedding Eintrag in der grafana.ini aufgeführt.
umgestiegen von Proxmox auf Unraid
-
@crunchip sagte in Welche proxmox VMs habt ihr?:
Ich hatte den Betrag schon gesehen und auch gelesen :-)
Meine Frage lautete ja dahingehend, ob dieser Eintrag/Zeile bereits in der ini vorhanden sein sollte (nur eben auf "false" steht) oder diese Zeile einfach unten an der ini angefügt wird, da er noch gar nicht in der ini auftaucht ?!?!?
Wohin also mit diesem Eintrag?
gehört der in eine bestimmte Rubrik innerhalb der ini oder ist das schnurzpiep egal? :sunglasses: -
@crunchip sagte in Welche proxmox VMs habt ihr?:
Ich hatte den Betrag schon gesehen und auch gelesen :-)
Meine Frage lautete ja dahingehend, ob dieser Eintrag/Zeile bereits in der ini vorhanden sein sollte (nur eben auf "false" steht) oder diese Zeile einfach unten an der ini angefügt wird, da er noch gar nicht in der ini auftaucht ?!?!?
Wohin also mit diesem Eintrag?
gehört der in eine bestimmte Rubrik innerhalb der ini oder ist das schnurzpiep egal? :sunglasses:@BBTown das steht doch da, rubrik security
Sollte da auch schon vorhanden sein, nur von false auf true ändern.
Ich habe das nicht, da ich noch die alte version nutze -
@Sempre sagte in Welche proxmox VMs habt ihr?:
Bei Grafana selber gibt es eine Setting "allow_embedding" in der grafana.ini, welche auf true gestellt werden muss.
Ich habe einen solchen Eintrag in der grafana.ini nicht finden können.
Hast Du diesen einfach am Ende hinzugefügt? -
@Frank_y dazu kenn ich mich leider nicht aus, du kannst versuchen , in Grafana einen extra Benutzer dafür anzulegen.
Wird glaub ich, bei dem oben verlinktem Video auch angedeutet, das bei manchen das so nicht funktioniert und ein Benutzer dafür angelegt werden soll.
wäre zumindest mal ein Versuch wert.@crunchip bist du noch interessiert am pihole thema
habe einen neuen thread geöffnet
https://forum.iobroker.net/topic/23567/pihole-fritzbox-proxmox
-
Nein, wie zuvor schon einmal angemerkt ist der Eintrag bei mir nicht vorhanden.
Die Installation erfolgte frisch mit der aktuellsten Version 6.2.5#################################### Security #################################### [security] # default admin user, created on startup ;admin_user = admin # default admin password, can be changed before first start of grafana, or in profile settings ;admin_password = admin # used for signing ;secret_key = # disable gravatar profile images ;disable_gravatar = false # data source proxy whitelist (ip_or_domain:port separated by spaces) ;data_source_proxy_whitelist = # disable protection against brute force login attempts ;disable_brute_force_login_protection = false # set to true if you host Grafana behind HTTPS. default is false. ;cookie_secure = false # set cookie SameSite attribute. defaults to `lax`. can be set to "lax", "strict" and "none" ;cookie_samesite = lax #################################### Snapshots ########################### -
@saeft_2003
debMatic mit USB-Adapter für Funkmodul zur Steuerung der Homematic Komponenten
Zoneminder zur Anzeige/Kameraüberwachung -
@GeorgS ein Screen, aufgrund eines privatchat
-
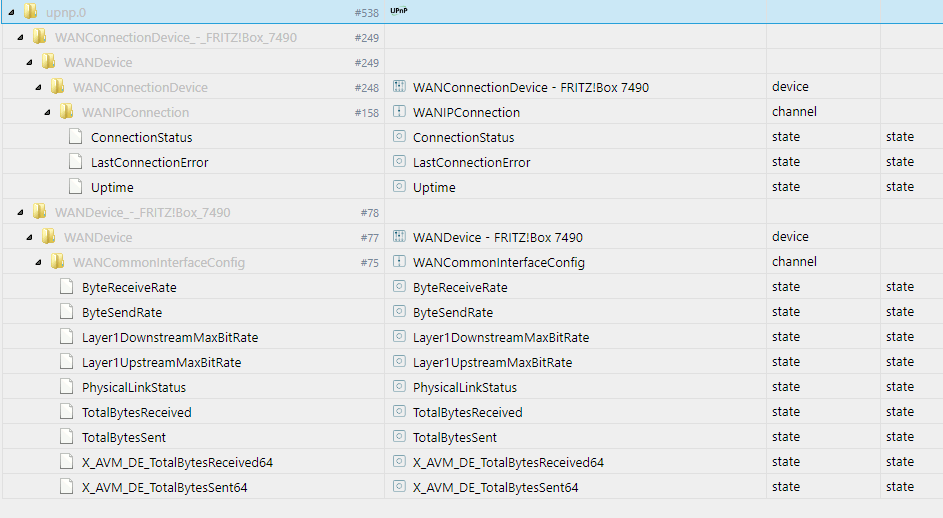
@crunchip Danke dafür, es geht um das Grafana Dashboard für die Fritzbox aus dem Beitrag (https://forum.iobroker.net/topic/23503/welche-proxmox-vms-habt-ihr/21)
Leider stehen bei diesen Datenpunkten keine Werte...
grüße
GeorgIntel NUC, MaxCul, Xiaomi Vacuum Cleaner, Philips Hue, Zigbee, FritzDECT,Shelly
-
@crunchip Danke dafür, es geht um das Grafana Dashboard für die Fritzbox aus dem Beitrag (https://forum.iobroker.net/topic/23503/welche-proxmox-vms-habt-ihr/21)
Leider stehen bei diesen Datenpunkten keine Werte...
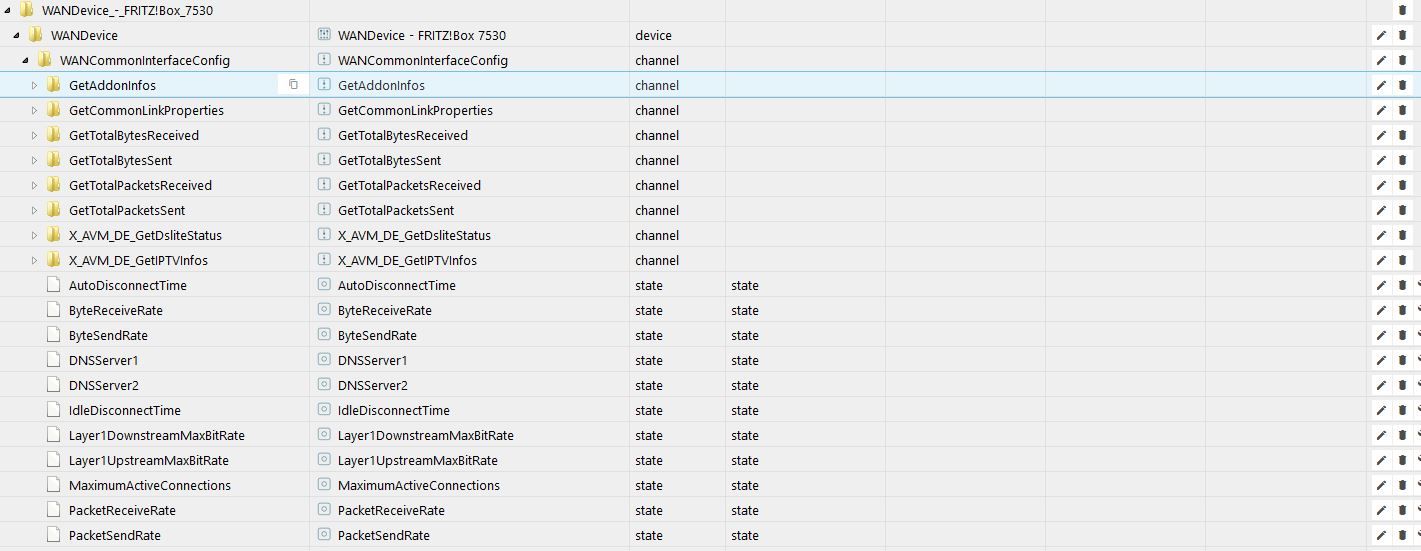
@GeorgS du musst upnp.0.WANDevice_-FRITZ!Box_7490.WANDevice.WANCommonInterfaceConfig.GetAddonInfos öffnen, unten siehst du den request button, da auf den schraubenschlüssel und dann upnp...
und dieser
upnp.0.WANConnectionDevice-_FRITZ!Box_7490.WANDevice.WANConnectionDevice.WANIPConnection.GetStatusInfo -
@crunchip Danke dafür, es geht um das Grafana Dashboard für die Fritzbox aus dem Beitrag (https://forum.iobroker.net/topic/23503/welche-proxmox-vms-habt-ihr/21)
Leider stehen bei diesen Datenpunkten keine Werte...
{ "__inputs": [ { "name": "DS_INFLUXDB-COLLECTD", "label": "InfluxDB-collectd", "description": "", "type": "datasource", "pluginId": "influxdb", "pluginName": "InfluxDB" } ], "__requires": [ { "type": "grafana", "id": "grafana", "name": "Grafana", "version": "6.1.0" }, { "type": "panel", "id": "graph", "name": "Graph", "version": "" }, { "type": "datasource", "id": "influxdb", "name": "InfluxDB", "version": "1.0.0" }, { "type": "panel", "id": "singlestat", "name": "Singlestat", "version": "" }, { "type": "panel", "id": "table", "name": "Table", "version": "" } ], "annotations": { "list": [ { "builtIn": 1, "datasource": "-- Grafana --", "enable": true, "hide": true, "iconColor": "rgba(0, 211, 255, 1)", "name": "Annotations & Alerts", "type": "dashboard" } ] }, "description": "Monitor FRITZ!Box routers.", "editable": true, "gnetId": 713, "graphTooltip": 2, "id": null, "links": [], "panels": [ { "cacheTimeout": null, "colorBackground": true, "colorValue": false, "colors": [ "#1f78c1", "rgba(237, 129, 40, 0.89)", "rgba(245, 54, 54, 0.9)" ], "datasource": "${DS_INFLUXDB-COLLECTD}", "format": "none", "gauge": { "maxValue": 100, "minValue": 0, "show": false, "thresholdLabels": false, "thresholdMarkers": true }, "gridPos": { "h": 4, "w": 4, "x": 0, "y": 0 }, "id": 10, "interval": "", "links": [], "mappingType": 1, "mappingTypes": [ { "name": "value to text", "value": 1 }, { "name": "range to text", "value": 2 } ], "maxDataPoints": 100, "nullPointMode": "connected", "nullText": null, "postfix": "", "postfixFontSize": "50%", "prefix": "", "prefixFontSize": "50%", "rangeMaps": [ { "from": "null", "text": "N/A", "to": "null" } ], "sparkline": { "fillColor": "rgba(31, 118, 189, 0.18)", "full": false, "lineColor": "rgb(31, 120, 193)", "show": false }, "tableColumn": "last", "targets": [ { "dsType": "influxdb", "groupBy": [], "limit": "", "measurement": "upnp.0.WANConnectionDevice_-_FRITZ!Box_7490.WANDevice.WANConnectionDevice.WANIPConnection.ConnectionStatus", "orderByTime": "ASC", "policy": "default", "query": "SELECT last(\"ack\") FROM \"upnp.0.WANConnectionDevice_-_FRITZ!Box_7490.WANDevice.WANConnectionDevice.WANIPConnection.ConnectionStatus\" WHERE $timeFilter", "rawQuery": false, "refId": "A", "resultFormat": "table", "select": [ [ { "params": [ "value" ], "type": "field" }, { "params": [], "type": "last" } ] ], "slimit": "", "tags": [], "target": "", "tz": "" } ], "thresholds": "1,1", "timeFrom": null, "title": "Connection Status", "type": "singlestat", "valueFontSize": "80%", "valueMaps": [ { "op": "=", "text": "N/A", "value": "null" }, { "op": "=", "text": "Disconnected", "value": "1" }, { "op": "=", "text": "Connected", "value": "0" } ], "valueName": "current" }, { "cacheTimeout": null, "colorBackground": true, "colorValue": false, "colors": [ "#1f78c1", "rgba(237, 129, 40, 0.89)", "rgba(245, 54, 54, 0.9)" ], "datasource": "${DS_INFLUXDB-COLLECTD}", "format": "none", "gauge": { "maxValue": 100, "minValue": 0, "show": false, "thresholdLabels": false, "thresholdMarkers": true }, "gridPos": { "h": 4, "w": 4, "x": 4, "y": 0 }, "id": 9, "interval": null, "links": [], "mappingType": 1, "mappingTypes": [ { "name": "value to text", "value": 1 }, { "name": "range to text", "value": 2 } ], "maxDataPoints": 100, "nullPointMode": "connected", "nullText": null, "postfix": "", "postfixFontSize": "50%", "prefix": "", "prefixFontSize": "50%", "rangeMaps": [ { "from": "null", "text": "N/A", "to": "null" } ], "sparkline": { "fillColor": "rgba(31, 118, 189, 0.18)", "full": false, "lineColor": "rgb(31, 120, 193)", "show": false }, "tableColumn": "last", "targets": [ { "dsType": "influxdb", "groupBy": [], "measurement": "upnp.0.WANDevice_-_FRITZ!Box_7490.WANDevice.WANCommonInterfaceConfig.PhysicalLinkStatus", "orderByTime": "ASC", "policy": "default", "refId": "A", "resultFormat": "table", "select": [ [ { "params": [ "value" ], "type": "field" }, { "params": [], "type": "last" } ] ], "tags": [], "target": "" } ], "thresholds": "1,1", "title": "DSL Link Status", "type": "singlestat", "valueFontSize": "80%", "valueMaps": [ { "op": "=", "text": "N/A", "value": "null" }, { "op": "=", "text": "Disconnected", "value": "1" }, { "op": "=", "text": "Connected", "value": "0" } ], "valueName": "current" }, { "cacheTimeout": null, "colorBackground": false, "colorValue": false, "colors": [ "rgba(245, 54, 54, 0.9)", "rgba(237, 129, 40, 0.89)", "rgba(50, 172, 45, 0.97)" ], "datasource": "${DS_INFLUXDB-COLLECTD}", "format": "dtdurations", "gauge": { "maxValue": 100, "minValue": 0, "show": false, "thresholdLabels": false, "thresholdMarkers": true }, "gridPos": { "h": 4, "w": 4, "x": 8, "y": 0 }, "id": 13, "interval": null, "links": [], "mappingType": 1, "mappingTypes": [ { "name": "value to text", "value": 1 }, { "name": "range to text", "value": 2 } ], "maxDataPoints": 100, "nullPointMode": "connected", "nullText": null, "postfix": "", "postfixFontSize": "50%", "prefix": "", "prefixFontSize": "50%", "rangeMaps": [ { "from": "null", "text": "N/A", "to": "null" } ], "sparkline": { "fillColor": "rgba(31, 118, 189, 0.18)", "full": false, "lineColor": "rgb(31, 120, 193)", "show": false }, "tableColumn": "", "targets": [ { "dsType": "influxdb", "groupBy": [ { "params": [ "$__interval" ], "type": "time" } ], "measurement": "upnp.0.WANConnectionDevice_-_FRITZ!Box_7490.WANDevice.WANConnectionDevice.WANIPConnection.Uptime", "orderByTime": "ASC", "policy": "default", "query": "SELECT last(\"value\") FROM \"upnp.0.WANConnectionDevice_-_FRITZ!Box_7490.WANDevice.WANConnectionDevice.WANIPConnection.Uptime\" AND $timeFilter GROUP BY time($interval)", "rawQuery": false, "refId": "A", "resultFormat": "time_series", "select": [ [ { "params": [ "value" ], "type": "field" }, { "params": [], "type": "last" } ] ], "tags": [], "target": "" } ], "thresholds": "1,1", "title": "Uptime", "type": "singlestat", "valueFontSize": "80%", "valueMaps": [ { "op": "=", "text": "N/A", "value": "null" }, { "op": "=", "text": "Disconnected", "value": "0" }, { "op": "=", "text": "Connected", "value": "1" } ], "valueName": "current" }, { "cacheTimeout": null, "colorBackground": false, "colorValue": false, "colors": [ "rgba(245, 54, 54, 0.9)", "rgba(237, 129, 40, 0.89)", "#1f78c1" ], "datasource": "${DS_INFLUXDB-COLLECTD}", "decimals": null, "format": "bps", "gauge": { "maxValue": 51392000, "minValue": 0, "show": true, "thresholdLabels": false, "thresholdMarkers": false }, "gridPos": { "h": 4, "w": 4, "x": 12, "y": 0 }, "id": 11, "interval": null, "links": [], "mappingType": 1, "mappingTypes": [ { "name": "value to text", "value": 1 }, { "name": "range to text", "value": 2 } ], "maxDataPoints": 100, "nullPointMode": "connected", "nullText": null, "postfix": "", "postfixFontSize": "50%", "prefix": "", "prefixFontSize": "50%", "rangeMaps": [ { "from": "null", "text": "N/A", "to": "null" } ], "sparkline": { "fillColor": "rgba(31, 118, 189, 0.18)", "full": false, "lineColor": "rgb(31, 120, 193)", "show": false }, "tableColumn": "", "targets": [ { "dsType": "influxdb", "groupBy": [ { "params": [ "$__interval" ], "type": "time" } ], "measurement": "upnp.0.WANDevice_-_FRITZ!Box_7490.WANDevice.WANCommonInterfaceConfig.ByteReceiveRate", "orderByTime": "ASC", "policy": "default", "refId": "A", "resultFormat": "time_series", "select": [ [ { "params": [ "value" ], "type": "field" }, { "params": [], "type": "last" } ] ], "tags": [], "target": "" } ], "thresholds": "1,1", "title": "Current Download", "type": "singlestat", "valueFontSize": "50%", "valueMaps": [ { "op": "=", "text": "N/A", "value": "null" } ], "valueName": "current" }, { "cacheTimeout": null, "colorBackground": false, "colorValue": false, "colors": [ "rgba(245, 54, 54, 0.9)", "rgba(237, 129, 40, 0.89)", "#e24d42" ], "datasource": "${DS_INFLUXDB-COLLECTD}", "decimals": null, "format": "bps", "gauge": { "maxValue": 10048000, "minValue": 0, "show": true, "thresholdLabels": false, "thresholdMarkers": false }, "gridPos": { "h": 4, "w": 4, "x": 16, "y": 0 }, "id": 12, "interval": null, "links": [], "mappingType": 1, "mappingTypes": [ { "name": "value to text", "value": 1 }, { "name": "range to text", "value": 2 } ], "maxDataPoints": 100, "nullPointMode": "connected", "nullText": null, "postfix": "", "postfixFontSize": "50%", "prefix": "", "prefixFontSize": "50%", "rangeMaps": [ { "from": "null", "text": "N/A", "to": "null" } ], "sparkline": { "fillColor": "rgba(31, 118, 189, 0.18)", "full": false, "lineColor": "rgb(31, 120, 193)", "show": false }, "tableColumn": "", "targets": [ { "dsType": "influxdb", "groupBy": [ { "params": [ "$__interval" ], "type": "time" } ], "measurement": "upnp.0.WANDevice_-_FRITZ!Box_7490.WANDevice.WANCommonInterfaceConfig.ByteSendRate", "orderByTime": "ASC", "policy": "default", "refId": "A", "resultFormat": "time_series", "select": [ [ { "params": [ "value" ], "type": "field" }, { "params": [], "type": "last" } ] ], "tags": [], "target": "" } ], "thresholds": "1,1", "title": "Current Upload", "type": "singlestat", "valueFontSize": "50%", "valueMaps": [ { "op": "=", "text": "N/A", "value": "null" } ], "valueName": "current" }, { "cacheTimeout": null, "colorBackground": false, "colorValue": false, "colors": [ "rgba(245, 54, 54, 0.9)", "rgba(237, 129, 40, 0.89)", "rgba(50, 172, 45, 0.97)" ], "datasource": "${DS_INFLUXDB-COLLECTD}", "decimals": null, "format": "decbytes", "gauge": { "maxValue": 100, "minValue": 0, "show": false, "thresholdLabels": false, "thresholdMarkers": true }, "gridPos": { "h": 3, "w": 5, "x": 0, "y": 4 }, "id": 3, "interval": "", "links": [], "mappingType": 1, "mappingTypes": [ { "name": "value to text", "value": 1 }, { "name": "range to text", "value": 2 } ], "maxDataPoints": 100, "nullPointMode": "connected", "nullText": null, "postfix": "", "postfixFontSize": "50%", "prefix": "", "prefixFontSize": "50%", "rangeMaps": [ { "from": "null", "text": "N/A", "to": "null" } ], "sparkline": { "fillColor": "rgba(31, 118, 189, 0.18)", "full": false, "lineColor": "rgb(31, 120, 193)", "show": true }, "tableColumn": "non_negative_difference", "targets": [ { "dsType": "influxdb", "groupBy": [ { "params": [ "$__interval" ], "type": "time" }, { "params": [ "linear" ], "type": "fill" } ], "measurement": "upnp.0.WANDevice_-_FRITZ!Box_7490.WANDevice.WANCommonInterfaceConfig.X_AVM_DE_TotalBytesReceived64", "orderByTime": "ASC", "policy": "default", "query": "SELECT cumulative_sum(non_negative_difference(last(\"value\"))) FROM \"upnp.0.WANDevice_-_FRITZ!Box_7490.WANDevice.WANCommonInterfaceConfig.X_AVM_DE_TotalBytesReceived64\" WHERE $timeFilter GROUP BY time($__interval) fill(linear) tz('Europe/Berlin')\n", "rawQuery": true, "refId": "A", "resultFormat": "time_series", "select": [ [ { "params": [ "value" ], "type": "field" }, { "params": [], "type": "mean" }, { "params": [], "type": "non_negative_difference" }, { "params": [], "type": "cumulative_sum" } ] ], "tags": [], "target": "", "tz": "" } ], "thresholds": "", "timeFrom": null, "title": "Total Download", "type": "singlestat", "valueFontSize": "80%", "valueMaps": [ { "op": "=", "text": "N/A", "value": "null" } ], "valueName": "current" }, { "cacheTimeout": null, "colorBackground": false, "colorValue": false, "colors": [ "rgba(245, 54, 54, 0.9)", "rgba(237, 129, 40, 0.89)", "rgba(50, 172, 45, 0.97)" ], "datasource": "${DS_INFLUXDB-COLLECTD}", "decimals": null, "format": "decbytes", "gauge": { "maxValue": 100, "minValue": 0, "show": false, "thresholdLabels": false, "thresholdMarkers": true }, "gridPos": { "h": 3, "w": 5, "x": 5, "y": 4 }, "id": 8, "interval": null, "links": [], "mappingType": 1, "mappingTypes": [ { "name": "value to text", "value": 1 }, { "name": "range to text", "value": 2 } ], "maxDataPoints": 100, "nullPointMode": "connected", "nullText": null, "postfix": "", "postfixFontSize": "50%", "prefix": "", "prefixFontSize": "50%", "rangeMaps": [ { "from": "null", "text": "N/A", "to": "null" } ], "sparkline": { "fillColor": "rgba(137, 15, 2, 0.18)", "full": false, "lineColor": "#e24d42", "show": true }, "tableColumn": "", "targets": [ { "dsType": "influxdb", "groupBy": [ { "params": [ "$__interval" ], "type": "time" }, { "params": [ "linear" ], "type": "fill" } ], "measurement": "upnp.0.WANDevice_-_FRITZ!Box_7490.WANDevice.WANCommonInterfaceConfig.X_AVM_DE_TotalBytesSent64", "orderByTime": "ASC", "policy": "default", "query": "SELECT cumulative_sum(non_negative_difference(last(\"value\"))) FROM \"upnp.0.WANDevice_-_FRITZ!Box_7490.WANDevice.WANCommonInterfaceConfig.X_AVM_DE_TotalBytesSent64\" WHERE $timeFilter GROUP BY time($__interval) fill(linear) tz('Europe/Berlin')", "rawQuery": true, "refId": "A", "resultFormat": "time_series", "select": [ [ { "params": [ "value" ], "type": "field" }, { "params": [], "type": "mean" }, { "params": [], "type": "non_negative_difference" }, { "params": [], "type": "cumulative_sum" } ] ], "tags": [], "target": "" } ], "thresholds": "", "timeFrom": null, "title": "Total Upload", "type": "singlestat", "valueFontSize": "80%", "valueMaps": [ { "op": "=", "text": "N/A", "value": "null" } ], "valueName": "current" }, { "cacheTimeout": null, "colorBackground": false, "colorValue": false, "colors": [ "rgba(245, 54, 54, 0.9)", "rgba(237, 129, 40, 0.89)", "rgba(50, 172, 45, 0.97)" ], "datasource": "${DS_INFLUXDB-COLLECTD}", "decimals": null, "format": "decbytes", "gauge": { "maxValue": 100, "minValue": 0, "show": false, "thresholdLabels": false, "thresholdMarkers": true }, "gridPos": { "h": 3, "w": 5, "x": 10, "y": 4 }, "hideTimeOverride": false, "id": 15, "interval": null, "links": [], "mappingType": 1, "mappingTypes": [ { "name": "value to text", "value": 1 }, { "name": "range to text", "value": 2 } ], "maxDataPoints": 100, "nullPointMode": "connected", "nullText": null, "postfix": "", "postfixFontSize": "50%", "prefix": "", "prefixFontSize": "50%", "rangeMaps": [ { "from": "null", "text": "N/A", "to": "null" } ], "sparkline": { "fillColor": "rgba(31, 118, 189, 0.18)", "full": false, "lineColor": "rgb(31, 120, 193)", "show": true }, "tableColumn": "", "targets": [ { "dsType": "influxdb", "groupBy": [ { "params": [ "$__interval" ], "type": "time" }, { "params": [ "null" ], "type": "fill" } ], "measurement": "fritzbox_value", "orderByTime": "ASC", "policy": "default", "query": "SELECT cumulative_sum(non_negative_difference(last(\"value\"))) FROM \"upnp.0.WANDevice_-_FRITZ!Box_7490.WANDevice.WANCommonInterfaceConfig.TotalBytesReceived\" WHERE $timeFilter GROUP BY time($__interval) fill(null) tz('Europe/Berlin')", "rawQuery": true, "refId": "A", "resultFormat": "time_series", "select": [ [ { "params": [ "value" ], "type": "field" }, { "params": [], "type": "mean" } ] ], "tags": [ { "key": "type_instance", "operator": "=", "value": "totalbytesreceived" } ], "target": "" } ], "thresholds": "", "timeFrom": "1d", "timeShift": null, "title": "Last 24h Download", "type": "singlestat", "valueFontSize": "80%", "valueMaps": [ { "op": "=", "text": "N/A", "value": "null" } ], "valueName": "current" }, { "cacheTimeout": null, "colorBackground": false, "colorValue": false, "colors": [ "rgba(245, 54, 54, 0.9)", "rgba(237, 129, 40, 0.89)", "rgba(50, 172, 45, 0.97)" ], "datasource": "${DS_INFLUXDB-COLLECTD}", "decimals": null, "format": "decbytes", "gauge": { "maxValue": 100, "minValue": 0, "show": false, "thresholdLabels": false, "thresholdMarkers": true }, "gridPos": { "h": 3, "w": 5, "x": 15, "y": 4 }, "id": 16, "interval": null, "links": [], "mappingType": 1, "mappingTypes": [ { "name": "value to text", "value": 1 }, { "name": "range to text", "value": 2 } ], "maxDataPoints": 100, "nullPointMode": "connected", "nullText": null, "postfix": "", "postfixFontSize": "50%", "prefix": "", "prefixFontSize": "50%", "rangeMaps": [ { "from": "null", "text": "N/A", "to": "null" } ], "sparkline": { "fillColor": "rgba(137, 15, 2, 0.18)", "full": false, "lineColor": "#e24d42", "show": true }, "tableColumn": "", "targets": [ { "dsType": "influxdb", "groupBy": [ { "params": [ "$__interval" ], "type": "time" }, { "params": [ "null" ], "type": "fill" } ], "measurement": "fritzbox_value", "orderByTime": "ASC", "policy": "default", "query": "SELECT cumulative_sum(non_negative_difference(last(\"value\"))) FROM \"upnp.0.WANDevice_-_FRITZ!Box_7490.WANDevice.WANCommonInterfaceConfig.TotalBytesSent\" WHERE $timeFilter GROUP BY time($__interval) fill(null) tz('Europe/Berlin')", "rawQuery": true, "refId": "A", "resultFormat": "time_series", "select": [ [ { "params": [ "value" ], "type": "field" }, { "params": [], "type": "mean" } ] ], "tags": [ { "key": "type_instance", "operator": "=", "value": "totalbytesreceived" } ], "target": "" } ], "thresholds": "", "timeFrom": "1d", "title": "Last 24h Upload", "type": "singlestat", "valueFontSize": "80%", "valueMaps": [ { "op": "=", "text": "N/A", "value": "null" } ], "valueName": "current" }, { "aliasColors": { "Download": "#1f78c1", "Upload": "#e24d42", "fritzbox_value.non_negative_derivative": "#ba43a9", "fritzbox_value.non_negative_difference": "#e24d42" }, "bars": true, "dashLength": 10, "dashes": false, "datasource": "${DS_INFLUXDB-COLLECTD}", "fill": 1, "gridPos": { "h": 5, "w": 10, "x": 0, "y": 7 }, "id": 2, "interval": "10s", "legend": { "alignAsTable": false, "avg": false, "current": false, "hideEmpty": false, "hideZero": false, "max": false, "min": false, "rightSide": false, "show": true, "total": false, "values": false }, "lines": false, "linewidth": 1, "links": [], "nullPointMode": "null", "percentage": false, "pointradius": 5, "points": false, "renderer": "flot", "seriesOverrides": [], "spaceLength": 10, "stack": false, "steppedLine": false, "targets": [ { "alias": "Download", "dsType": "influxdb", "groupBy": [ { "params": [ "24h" ], "type": "time" } ], "hide": false, "measurement": "upnp.0.WANDevice_-_FRITZ!Box_7490.WANDevice.WANCommonInterfaceConfig.TotalBytesReceived", "orderByTime": "ASC", "policy": "default", "query": "SELECT non_negative_difference(last(cumulative_sum))FROM (\nSELECT cumulative_sum(non_negative_difference(last(\"value\"))) FROM \"upnp.0.WANDevice_-_FRITZ!Box_7490.WANDevice.WANCommonInterfaceConfig.TotalBytesReceived\" WHERE $timeFilter GROUP BY time($__interval)\n) WHERE $timeFilter GROUP BY time(1d) tz('Europe/Berlin')", "rawQuery": true, "refId": "F", "resultFormat": "time_series", "select": [ [ { "params": [ "value" ], "type": "field" }, { "params": [], "type": "last" }, { "params": [], "type": "non_negative_difference" }, { "params": [], "type": "cumulative_sum" }, { "params": [], "type": "cumulative_sum" }, { "params": [], "type": "non_negative_difference" } ] ], "tags": [], "target": "" }, { "alias": "Upload", "dsType": "influxdb", "groupBy": [ { "params": [ "24h" ], "type": "time" } ], "hide": false, "measurement": "fritzbox_value", "orderByTime": "ASC", "policy": "default", "query": "SELECT non_negative_difference(last(cumulative_sum)) FROM (\nSELECT cumulative_sum(non_negative_difference(last(\"value\"))) FROM \"upnp.0.WANDevice_-_FRITZ!Box_7490.WANDevice.WANCommonInterfaceConfig.TotalBytesSent\" WHERE $timeFilter GROUP BY time($__interval)\n) WHERE $timeFilter GROUP BY time(1d) tz('Europe/Berlin')", "rawQuery": true, "refId": "A", "resultFormat": "time_series", "select": [ [ { "params": [ "value" ], "type": "field" }, { "params": [], "type": "max" }, { "params": [ "10s" ], "type": "non_negative_derivative" } ] ], "tags": [ { "key": "type_instance", "operator": "=", "value": "totalbytesreceived" } ], "target": "" } ], "thresholds": [], "timeFrom": null, "timeRegions": [], "timeShift": null, "title": "Daily Traffic", "tooltip": { "shared": true, "sort": 0, "value_type": "individual" }, "type": "graph", "xaxis": { "buckets": null, "mode": "time", "name": null, "show": true, "values": [] }, "yaxes": [ { "decimals": 2, "format": "decbytes", "label": "", "logBase": 1, "max": null, "min": null, "show": true }, { "format": "decbytes", "label": null, "logBase": 1, "max": null, "min": null, "show": true } ], "yaxis": { "align": false, "alignLevel": null } }, { "aliasColors": { "download": "#1F78C1", "upload": "#EA6460" }, "annotate": { "enable": false }, "bars": true, "dashLength": 10, "dashes": false, "datasource": "${DS_INFLUXDB-COLLECTD}", "editable": true, "fill": 0, "grid": {}, "gridPos": { "h": 5, "w": 10, "x": 10, "y": 7 }, "id": 17, "interval": "1h", "legend": { "avg": false, "current": true, "max": false, "min": false, "show": true, "total": false, "values": true }, "lines": false, "linewidth": 1, "links": [], "nullPointMode": "null", "percentage": false, "pointradius": 5, "points": false, "renderer": "flot", "resolution": 100, "scale": 1, "seriesOverrides": [], "spaceLength": 10, "stack": false, "steppedLine": true, "targets": [ { "alias": "download", "dsType": "influxdb", "fields": [ { "func": "mean", "name": "value" } ], "groupBy": [ { "params": [ "$interval" ], "type": "time" }, { "params": [ "null" ], "type": "fill" } ], "groupByTags": [], "hide": false, "measurement": "upnp.0.WANDevice_-_FRITZ!Box_7490.WANDevice.WANCommonInterfaceConfig.TotalBytesReceived", "orderByTime": "ASC", "policy": "default", "query": "SELECT mean(\"value\") FROM \"upnp.0.WANDevice_-_FRITZ!Box_7490.WANDevice.WANCommonInterfaceConfig.ByteReceiveRate\" WHERE $timeFilter GROUP BY time($interval) fill(null)", "rawQuery": true, "refId": "A", "resultFormat": "time_series", "select": [ [ { "params": [ "value" ], "type": "field" }, { "params": [], "type": "mean" } ] ], "tags": [], "target": "alias(summarize(nonNegativeDerivative(collectd.squirrel.fritzbox.bytes-totalbytesreceived, 0), '1h', 'sum'), 'download')" }, { "alias": "upload", "dsType": "influxdb", "fields": [ { "func": "mean", "name": "value" } ], "fill": "null", "groupBy": [ { "params": [ "$interval" ], "type": "time" }, { "params": [ "null" ], "type": "fill" } ], "groupByTags": [], "hide": false, "measurement": "upnp.0.WANDevice_-_FRITZ!Box_7490.WANDevice.WANCommonInterfaceConfig.ByteSendRate", "orderByTime": "ASC", "policy": "default", "query": "SELECT mean(\"value\") FROM \"upnp.0.WANDevice_-_FRITZ!Box_7490.WANDevice.WANCommonInterfaceConfig.ByteSendRate\" WHERE $timeFilter GROUP BY time($interval) fill(null)", "rawQuery": true, "refId": "B", "resultFormat": "time_series", "select": [ [ { "params": [ "value" ], "type": "field" }, { "params": [], "type": "mean" } ] ], "tags": [], "target": "alias(summarize(nonNegativeDerivative(collectd.squirrel.fritzbox.bytes-totalbytessent,0),'1h','sum'),'upload')" } ], "thresholds": [], "timeFrom": null, "timeRegions": [], "timeShift": null, "title": "Current Traffic", "tooltip": { "msResolution": false, "query_as_alias": true, "shared": true, "sort": 0, "value_type": "cumulative" }, "type": "graph", "xaxis": { "buckets": null, "mode": "time", "name": null, "show": true, "values": [] }, "yaxes": [ { "format": "decbytes", "logBase": 1, "max": null, "min": 0, "show": true }, { "format": "short", "logBase": 1, "max": null, "min": null, "show": true } ], "yaxis": { "align": false, "alignLevel": null }, "zerofill": true }, { "columns": [], "datasource": "${DS_INFLUXDB-COLLECTD}", "fontSize": "100%", "gridPos": { "h": 6, "w": 10, "x": 0, "y": 12 }, "id": 14, "links": [], "pageSize": null, "scroll": true, "showHeader": true, "sort": { "col": 0, "desc": true }, "styles": [ { "alias": "Time", "dateFormat": "MMMM D, YYYY LT", "pattern": "Time", "type": "date" }, { "alias": "", "colorMode": null, "colors": [ "rgba(245, 54, 54, 0.9)", "rgba(237, 129, 40, 0.89)", "rgba(50, 172, 45, 0.97)" ], "decimals": 2, "pattern": "/.*/", "thresholds": [], "type": "number", "unit": "decbytes" } ], "targets": [ { "alias": "Download", "dsType": "influxdb", "groupBy": [ { "params": [ "1d" ], "type": "time" } ], "measurement": "fritzbox_value", "orderByTime": "ASC", "policy": "default", "query": "SELECT non_negative_difference(last(cumulative_sum))FROM (\nSELECT cumulative_sum(non_negative_difference(last(\"value\"))) FROM \"upnp.0.WANDevice_-_FRITZ!Box_7490.WANDevice.WANCommonInterfaceConfig.TotalBytesReceived\" WHERE $timeFilter GROUP BY time($__interval)\n) WHERE $timeFilter GROUP BY time(1d) tz('Europe/Berlin')", "rawQuery": true, "refId": "A", "resultFormat": "time_series", "select": [ [ { "params": [ "value" ], "type": "field" }, { "params": [], "type": "max" }, { "params": [ "10s" ], "type": "non_negative_derivative" } ] ], "tags": [ { "key": "type_instance", "operator": "=", "value": "totalbytesreceived" } ], "target": "" }, { "alias": "Upload", "dsType": "influxdb", "groupBy": [ { "params": [ "1d" ], "type": "time" } ], "hide": false, "measurement": "fritzbox_value", "orderByTime": "ASC", "policy": "default", "query": "SELECT non_negative_difference(last(cumulative_sum))FROM (\nSELECT cumulative_sum(non_negative_difference(last(\"value\"))) FROM \"upnp.0.WANDevice_-_FRITZ!Box_7490.WANDevice.WANCommonInterfaceConfig.TotalBytesSent\" WHERE $timeFilter GROUP BY time($__interval)\n) WHERE $timeFilter GROUP BY time(1d) tz('Europe/Berlin')", "rawQuery": true, "refId": "B", "resultFormat": "time_series", "select": [ [ { "params": [ "value" ], "type": "field" }, { "params": [], "type": "max" }, { "params": [ "10s" ], "type": "non_negative_derivative" } ] ], "tags": [ { "key": "type_instance", "operator": "=", "value": "totalbytesreceived" } ], "target": "" } ], "title": "Daily Traffic", "transform": "timeseries_to_columns", "type": "table" }, { "aliasColors": { "downstream": "#1F78C1", "downstream max": "#0A437C", "upstream": "#EA6460", "upstream max": "#890F02" }, "annotate": { "enable": false }, "bars": false, "dashLength": 10, "dashes": false, "datasource": "${DS_INFLUXDB-COLLECTD}", "editable": true, "fill": 1, "grid": {}, "gridPos": { "h": 6, "w": 10, "x": 10, "y": 12 }, "id": 18, "interval": "10s", "legend": { "avg": false, "current": true, "max": false, "min": false, "show": true, "total": false, "values": true }, "lines": true, "linewidth": 1, "links": [], "nullPointMode": "connected", "percentage": false, "pointradius": 5, "points": false, "renderer": "flot", "resolution": 100, "scale": 1, "seriesOverrides": [], "spaceLength": 10, "stack": false, "steppedLine": false, "targets": [ { "alias": "downstream", "dsType": "influxdb", "fields": [ { "func": "mean", "name": "value" } ], "groupBy": [ { "params": [ "$__interval" ], "type": "time" }, { "params": [ "null" ], "type": "fill" } ], "groupByTags": [], "hide": false, "measurement": "upnp.0.WANDevice_-_FRITZ!Box_7490.WANDevice.WANCommonInterfaceConfig.ByteReceiveRate", "orderByTime": "ASC", "policy": "default", "query": "SELECT mean(value) FROM \"fritzbox_value\" WHERE \"type_instance\" = 'receiverate' AND $timeFilter GROUP BY time($interval)", "refId": "A", "resultFormat": "time_series", "select": [ [ { "params": [ "value" ], "type": "field" }, { "params": [], "type": "mean" }, { "params": [ " / 0.125" ], "type": "math" } ] ], "tags": [], "target": "alias(collectd.squirrel.fritzbox.bitrate-receiverate,'downstream')" }, { "alias": "downstream max", "dsType": "influxdb", "fields": [ { "func": "mean", "name": "value" } ], "groupBy": [ { "params": [ "$__interval" ], "type": "time" }, { "params": [ "null" ], "type": "fill" } ], "groupByTags": [], "hide": false, "measurement": "upnp.0.WANDevice_-_FRITZ!Box_7490.WANDevice.WANCommonInterfaceConfig.Layer1DownstreamMaxBitRate", "orderByTime": "ASC", "policy": "default", "query": "SELECT mean(value) FROM \"fritzbox_value\" WHERE \"type_instance\" = 'downstreammax' AND $timeFilter GROUP BY time($interval)", "refId": "B", "resultFormat": "time_series", "select": [ [ { "params": [ "value" ], "type": "field" }, { "params": [], "type": "mean" } ] ], "tags": [], "target": "alias(collectd.squirrel.fritzbox.bitrate-downstreammax,'downstream max')" }, { "alias": "upstream", "dsType": "influxdb", "fields": [ { "func": "mean", "name": "value" } ], "groupBy": [ { "params": [ "$__interval" ], "type": "time" }, { "params": [ "null" ], "type": "fill" } ], "groupByTags": [], "hide": false, "measurement": "upnp.0.WANDevice_-_FRITZ!Box_7490.WANDevice.WANCommonInterfaceConfig.ByteSendRate", "orderByTime": "ASC", "policy": "default", "query": "SELECT mean(value) FROM \"fritzbox_value\" WHERE \"type_instance\" = 'sendrate' AND $timeFilter GROUP BY time($interval)", "refId": "C", "resultFormat": "time_series", "select": [ [ { "params": [ "value" ], "type": "field" }, { "params": [], "type": "mean" }, { "params": [ " / 0.125" ], "type": "math" } ] ], "tags": [], "target": "alias(collectd.squirrel.fritzbox.bitrate-sendrate,'upstream')" }, { "alias": "upstream max", "dsType": "influxdb", "fields": [ { "func": "mean", "name": "value" } ], "groupBy": [ { "params": [ "$__interval" ], "type": "time" }, { "params": [ "null" ], "type": "fill" } ], "groupByTags": [], "hide": false, "measurement": "upnp.0.WANDevice_-_FRITZ!Box_7490.WANDevice.WANCommonInterfaceConfig.Layer1UpstreamMaxBitRate", "orderByTime": "ASC", "policy": "default", "query": "SELECT mean(value) FROM \"fritzbox_value\" WHERE \"type_instance\" = 'upstreammax' AND $timeFilter GROUP BY time($interval)", "refId": "D", "resultFormat": "time_series", "select": [ [ { "params": [ "value" ], "type": "field" }, { "params": [], "type": "mean" } ] ], "tags": [], "target": "alias(collectd.squirrel.fritzbox.bitrate-upstreammax,'upstream max')" } ], "thresholds": [], "timeFrom": null, "timeRegions": [], "timeShift": null, "title": "Bandwidth", "tooltip": { "msResolution": false, "query_as_alias": true, "shared": true, "sort": 0, "value_type": "cumulative" }, "type": "graph", "xaxis": { "buckets": null, "mode": "time", "name": null, "show": true, "values": [] }, "yaxes": [ { "format": "bps", "logBase": 1, "max": null, "min": "0", "show": true }, { "format": "short", "logBase": 1, "max": null, "min": null, "show": true } ], "yaxis": { "align": false, "alignLevel": null }, "zerofill": true } ], "refresh": "1m", "schemaVersion": 18, "style": "dark", "tags": [], "templating": { "list": [] }, "time": { "from": "now-7d", "to": "now" }, "timepicker": { "refresh_intervals": [ "5s", "10s", "30s", "1m", "5m", "15m", "30m", "1h", "2h", "1d" ], "time_options": [ "5m", "15m", "1h", "6h", "12h", "24h", "2d", "7d", "30d" ] }, "timezone": "", "title": "FRITZ!Box Router Status", "uid": "000000013", "version": 62 } -
hat jmd. von euch plex media server auf proxmox laufen ?
habe einen container erstellt und auch tautulli darauf installiert - es wird ja gerade ein plex adapter gemacht.
plex zieht ganz schön an der performance (cpu zeit) - nicht unbedingt beim anschauen selbst sondern beim anlegen und pflegen der mediatheken - habt ihr da ähnliche erfahrung ?
693
Online32.6k
Users82.3k
Topics1.3m
Posts