

Forecast.solar mit dem Systeminfo Adapter
-
@gargano War die Korrektur aufs LOG bezogen oder auf den "0" Wert?
-
@jb_sullivan Beides, aber es geht ja jetzt ?
@gargano Nein - bei dem einen DP steht immer noch "0", aber es gibt auch keinen aktuellen Fehler LOG Eintrag - ich schalte mal auf DEBUG um.
FEHLER gefunden !!! Beim 2. Eintrag war in meiner API ein Zeichen zu viel
 Shame on me
ioBroker (since 2018) auf Intel Core i3-5005U NUC und Windwos10 Pro
-
@gargano Nein - bei dem einen DP steht immer noch "0", aber es gibt auch keinen aktuellen Fehler LOG Eintrag - ich schalte mal auf DEBUG um.
FEHLER gefunden !!! Beim 2. Eintrag war in meiner API ein Zeichen zu viel
Shame on me@jb_sullivan Post nochmal das Script bitte.
-
@gargano Nein - bei dem einen DP steht immer noch "0", aber es gibt auch keinen aktuellen Fehler LOG Eintrag - ich schalte mal auf DEBUG um.
FEHLER gefunden !!! Beim 2. Eintrag war in meiner API ein Zeichen zu viel
Shame on me@jb_sullivan OK. Dann müssen wir jetzt noch schauen , wie wir die Tabelle in InfluxDB kriegen. Bei einzelnen Datenpunkten ist dies schwierig, weil man ja dann den Datenpunkt nur zu der jeweils entsprechenden Zeit ändern darf. Also wenn ein Punkt um 15:00:00 mit 125 vorhergesagt ist, dann darf man den auch nur um 15:00:00 ändern und nicht schon vorher. Du kannst ja kein Wertepaar (Zeit/Wert) eintragen.
Stell mal ein gesonderten Thread im Forum ein, wie man eine Tabell in InfluxDb bekommt -
@jb_sullivan Post nochmal das Script bitte.
@gargano So der "Nuller" ist jetzt weg und der DP nun auch mit Werten gefüllt.
Ich habe die DB`s mal mit INflux verknüpft, aber da kommt nix bei raus, was von Grafana akzeptiert wird.
ioBroker (since 2018) auf Intel Core i3-5005U NUC und Windwos10 Pro
-
@gargano So der "Nuller" ist jetzt weg und der DP nun auch mit Werten gefüllt.
Ich habe die DB`s mal mit INflux verknüpft, aber da kommt nix bei raus, was von Grafana akzeptiert wird.
-
@jb_sullivan Aber evtl. ist InfludDB gar nicht geeignet sondern Sql.
Wie erwähnt stell mal einen gesonderten Thread zu dem Thema wie man eine Tabelle in die Datenbank bekommt.@gargano In welcher Foren Kategorie macht so ein Thread am meisten Sinn?
Macht es keinen Sinn die Werte alle einzeln als DP`s auszugeben? Wären dann bei 10 Stunden 20 DP - oder ist das Sinnfrei?
ioBroker (since 2018) auf Intel Core i3-5005U NUC und Windwos10 Pro
-
@gargano In welcher Foren Kategorie macht so ein Thread am meisten Sinn?
Macht es keinen Sinn die Werte alle einzeln als DP`s auszugeben? Wären dann bei 10 Stunden 20 DP - oder ist das Sinnfrei?
@jb_sullivan Einfach mal in Allgemein versuchen. Poste dann hier den Link bitte
Wie erwähnt, Du kannst ja nicht ein Wertepaar in den DP eintragen , sondern nur den Wert. InfluxDB (wie auch History..) nehmen dann die aktuelle Uhrzeit aus dem System, wenn sich der Wert ändert. Das ist aber nicht die Uhrzeit von der Vorhersage -
@jb_sullivan Einfach mal in Allgemein versuchen. Poste dann hier den Link bitte
Wie erwähnt, Du kannst ja nicht ein Wertepaar in den DP eintragen , sondern nur den Wert. InfluxDB (wie auch History..) nehmen dann die aktuelle Uhrzeit aus dem System, wenn sich der Wert ändert. Das ist aber nicht die Uhrzeit von der Vorhersage@gargano OK, habe ich gemacht - hier der Link dazu.
Auf jeden Fall DANKE für deine Hilfe bis hierhin - hätte ich alleine NIEEEEE hin bekommen ;)
https://forum.iobroker.net/topic/43005/json-tabelle-in-influxdb-einlesen
ioBroker (since 2018) auf Intel Core i3-5005U NUC und Windwos10 Pro
-
@gargano OK, habe ich gemacht - hier der Link dazu.
Auf jeden Fall DANKE für deine Hilfe bis hierhin - hätte ich alleine NIEEEEE hin bekommen ;)
https://forum.iobroker.net/topic/43005/json-tabelle-in-influxdb-einlesen
@jb_sullivan Mir ist noch was eingefallen: Wenn Du nicht unbedingt eine DB brauchst: Schau mal beim Scrounger, da gibts Diagramme Widgets die Wertepaare können (JSON Chart)
Da müssen wir dann aber im Script noch etwas aufbereiten , wie bei SolarJSONGraph)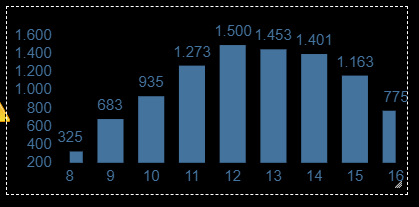
-
@jb_sullivan Mir ist noch was eingefallen: Wenn Du nicht unbedingt eine DB brauchst: Schau mal beim Scrounger, da gibts Diagramme Widgets die Wertepaare können (JSON Chart)
Da müssen wir dann aber im Script noch etwas aufbereiten , wie bei SolarJSONGraph)Ja ich weiß, genau so habe ich es in der Vergangenheit auch gemacht. Das Problem ist, das de beiden neuen Datenpunkt von der Formatierung nicht mit der materialdesign json Tabelle zusammen spielen möchten. (siehe unten)
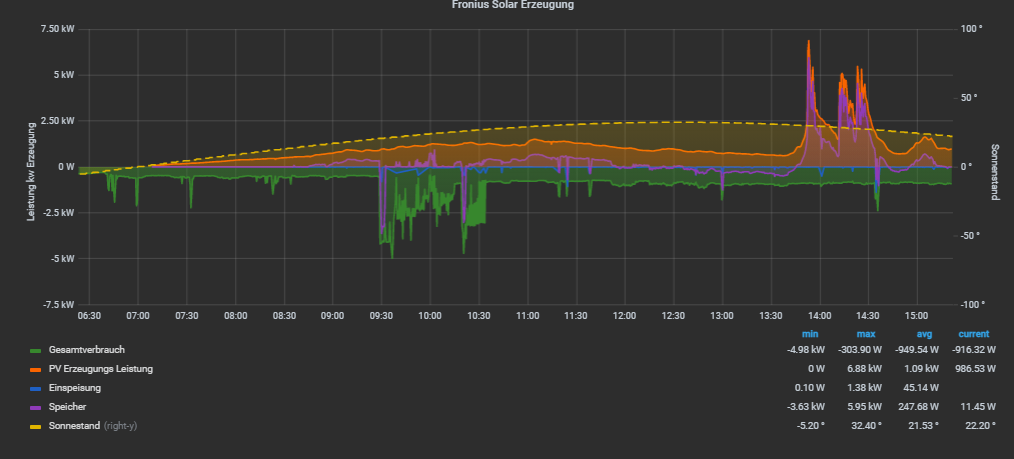
Die Werte in der DB und dann in Grafana wäre schon cool, dann kann man die Kurven der PV Anlage direkt übereinander legen und kann so sehen was die Prognose sagt und was letzendlich tatsächlich dabei rum gekommen ist.
ioBroker (since 2018) auf Intel Core i3-5005U NUC und Windwos10 Pro
-
Ja ich weiß, genau so habe ich es in der Vergangenheit auch gemacht. Das Problem ist, das de beiden neuen Datenpunkt von der Formatierung nicht mit der materialdesign json Tabelle zusammen spielen möchten. (siehe unten)
Die Werte in der DB und dann in Grafana wäre schon cool, dann kann man die Kurven der PV Anlage direkt übereinander legen und kann so sehen was die Prognose sagt und was letzendlich tatsächlich dabei rum gekommen ist.
-
@jb_sullivan ja , da müsste ich dann noch anpassen. Aber schaun wir mal ob es eine Möglichkeit in InfluxDB gibt
@gargano .... und wie würde man die mehrtägige Vorschau Prognose darstellen? Mit dem gekaufen API, kommt das ja alles auf "einer Seite " als Ergebnis.
Wie bekäme man das in ioBroker integriert?
ioBroker (since 2018) auf Intel Core i3-5005U NUC und Windwos10 Pro
-
@gargano .... und wie würde man die mehrtägige Vorschau Prognose darstellen? Mit dem gekaufen API, kommt das ja alles auf "einer Seite " als Ergebnis.
Wie bekäme man das in ioBroker integriert?
@jb_sullivan Im Scrounger Chart würde dann in der X-Achse das gesamte Datum stehen. (Hoffe ich) . Ich kanns ja mal probieren.
-
@gargano .... und wie würde man die mehrtägige Vorschau Prognose darstellen? Mit dem gekaufen API, kommt das ja alles auf "einer Seite " als Ergebnis.
Wie bekäme man das in ioBroker integriert?
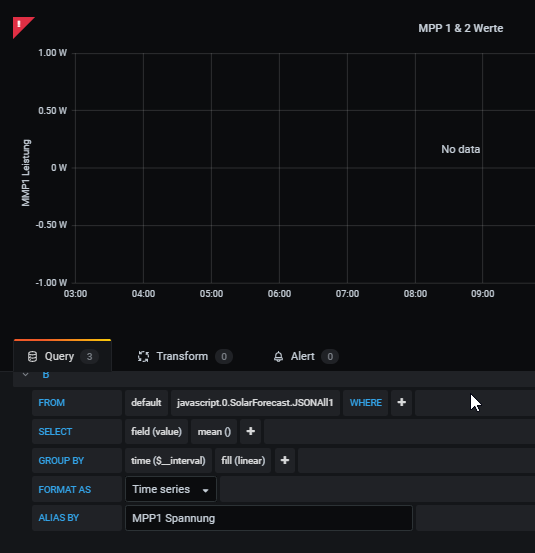
@jb_sullivan Probier mal aus. Da wird noch "javascript.0.SolarForecast.JSONGraphAll1" und "javascript.0.SolarForecast.JSONGraphAll2" angelegt. mit denen sollte der JsonChart zurecht kommen
const SolarJSON1        = "javascript.0.SolarForecast.JSON1";
const SolarJSON2        = "javascript.0.SolarForecast.JSON2";
const SolarJSONAll1        = "javascript.0.SolarForecast.JSONAll1";
const SolarJSONAll2        = "javascript.0.SolarForecast.JSONAll2";
const SolarJSONGraphAll1        = "javascript.0.SolarForecast.JSONGraphAll1";
const SolarJSONGraphAll2        = "javascript.0.SolarForecast.JSONGraphAll2";
const SolarJSONTable    = "javascript.0.SolarForecast.JSONTable";
const SolarJSONGraph    = "javascript.0.SolarForecast.JSONGraph";

const creatStateList = [
    {name :SolarJSON1, type:"string", role : "value"},
    {name :SolarJSON2, type:"string", role : "value"},
    {name :SolarJSONAll1, type:"string", role : "value"},
    {name :SolarJSONAll2, type:"string", role : "value"},
    {name :SolarJSONGraphAll1, type:"string", role : "value"},
    {name :SolarJSONGraphAll2, type:"string", role : "value"},
    {name :SolarJSONTable, type:"string", role : "value"},
    {name :SolarJSONGraph, type:"string", role : "value"}
]


creatStateList.forEach (function(item) {
    createState(item.name, {
        type: item.type,
        min: 0,
        def: 0,
        role: item.role
    });
});

var request = require('request');
var options1 = {url: 'https://api.forecast.solar/estimate/52.xx/10.xx/40/90/7.26', method: 'GET', headers: { 'User-Agent': 'request' }};
var options2 = {url: 'https://api.forecast.solar/estimate/52.xx/10.xx/40/-90/2.64', method: 'GET', headers: { 'User-Agent': 'request' }};


var urls = [
  {myUrl:options1,mySolarJSON:SolarJSON1,mySolarJSONAll:SolarJSONAll1,mySolarJSONGraphAll:SolarJSONGraphAll1},
  {myUrl:options2,mySolarJSON:SolarJSON2,mySolarJSONAll:SolarJSONAll2,mySolarJSONGraphAll:SolarJSONGraphAll2}
]

var promises = urls.map(myAsyncRequest);
schedule('6 6-22 * * *', getSolar);

getSolar();


function myAsyncRequest(myUrl) {
  log('Request '+myUrl.myUrl.url);
  return new Promise((resolve, reject) => {
     request(myUrl.myUrl.url, function(error, response, body) {
        if (!error && response.statusCode == 200) {
            let today = formatDate(new Date(), 'YYYY-MM-DD');
            let watts = JSON.parse(body).result.watts;
            setState(myUrl.mySolarJSONAll, JSON.stringify(watts), true);
            let table = [];
            for(let time in watts) {
                let pos = time.indexOf(':00:00');
                if(time.includes(today) && pos != -1) {
                    let entry = {};
                    entry.Uhrzeit = time.substr(pos - 2, 5);
                    entry.Leistung = watts[time];
                    table.push(entry);
                }
            }
            log ('JSON: '+myUrl.mySolarJSON);
            setState(myUrl.mySolarJSON, JSON.stringify(table), true);
        // make GraphTable

            let graphTimeData = [];

            for(let time in watts) {
                    let graphEntry ={};
                    graphEntry.t = Date.parse(time);
                    graphEntry.y = watts[time];
                    graphTimeData.push(graphEntry);
            }
            var graph = {};
            var graphData ={};
            var graphAllData = [];
            graphData.data = graphTimeData;
            graphAllData.push(graphData);
            graph.graphs=graphAllData;
            setState(myUrl.mySolarJSONGraphAll, JSON.stringify(graph), true);

            resolve (body);
        }
    });
  })
}

function makeTable () {
    log ('MakeTable');
    let watts1 = JSON.parse(getState(SolarJSON1).val);
    let watts2 = JSON.parse(getState(SolarJSON2).val);
    log ('Items: '+watts1.length);
    let today = formatDate(new Date(), 'YYYY-MM-DD');
    let table = [];
    let graphTimeData = [];

    for(var n=0;n<watts1.length;n++) {
            let entry = {};
            let graphEntry ={};
            let thisTime = today +' '+ watts1[n].Uhrzeit;
            log (thisTime);
            entry.Uhrzeit = watts1[n].Uhrzeit;
            entry.Leistung1 = watts1[n].Leistung;
            entry.Leistung2 = watts2[n].Leistung;
            entry.Summe = watts1[n].Leistung + watts2[n].Leistung;
            table.push(entry);
            graphEntry.t = Date.parse(thisTime);
            graphEntry.y = watts1[n].Leistung + watts2[n].Leistung;
            graphTimeData.push(graphEntry);
    }

    var graph = {};
    var graphData ={};
    var graphAllData = [];
    graphData.data = graphTimeData;
    graphAllData.push(graphData);
    graph.graphs=graphAllData;
    setState(SolarJSONTable, JSON.stringify(table), true);
    setState(SolarJSONGraph, JSON.stringify(graph), true);
}

function getSolar() {
  Promise.all(promises)
  .then(function(bodys) {
    console.log("All url loaded");
    makeTable();
  })
}
und falls Du nur den heutigen Tag brauchst:
for(let time in watts) { if(time.includes(today){ let graphEntry ={}; graphEntry.t = Date.parse(time); graphEntry.y = watts[time]; graphTimeData.push(graphEntry); } } -
@jb_sullivan Probier mal aus. Da wird noch "javascript.0.SolarForecast.JSONGraphAll1" und "javascript.0.SolarForecast.JSONGraphAll2" angelegt. mit denen sollte der JsonChart zurecht kommen
const SolarJSON1        = "javascript.0.SolarForecast.JSON1";
const SolarJSON2        = "javascript.0.SolarForecast.JSON2";
const SolarJSONAll1        = "javascript.0.SolarForecast.JSONAll1";
const SolarJSONAll2        = "javascript.0.SolarForecast.JSONAll2";
const SolarJSONGraphAll1        = "javascript.0.SolarForecast.JSONGraphAll1";
const SolarJSONGraphAll2        = "javascript.0.SolarForecast.JSONGraphAll2";
const SolarJSONTable    = "javascript.0.SolarForecast.JSONTable";
const SolarJSONGraph    = "javascript.0.SolarForecast.JSONGraph";

const creatStateList = [
    {name :SolarJSON1, type:"string", role : "value"},
    {name :SolarJSON2, type:"string", role : "value"},
    {name :SolarJSONAll1, type:"string", role : "value"},
    {name :SolarJSONAll2, type:"string", role : "value"},
    {name :SolarJSONGraphAll1, type:"string", role : "value"},
    {name :SolarJSONGraphAll2, type:"string", role : "value"},
    {name :SolarJSONTable, type:"string", role : "value"},
    {name :SolarJSONGraph, type:"string", role : "value"}
]


creatStateList.forEach (function(item) {
    createState(item.name, {
        type: item.type,
        min: 0,
        def: 0,
        role: item.role
    });
});

var request = require('request');
var options1 = {url: 'https://api.forecast.solar/estimate/52.xx/10.xx/40/90/7.26', method: 'GET', headers: { 'User-Agent': 'request' }};
var options2 = {url: 'https://api.forecast.solar/estimate/52.xx/10.xx/40/-90/2.64', method: 'GET', headers: { 'User-Agent': 'request' }};


var urls = [
  {myUrl:options1,mySolarJSON:SolarJSON1,mySolarJSONAll:SolarJSONAll1,mySolarJSONGraphAll:SolarJSONGraphAll1},
  {myUrl:options2,mySolarJSON:SolarJSON2,mySolarJSONAll:SolarJSONAll2,mySolarJSONGraphAll:SolarJSONGraphAll2}
]

var promises = urls.map(myAsyncRequest);
schedule('6 6-22 * * *', getSolar);

getSolar();


function myAsyncRequest(myUrl) {
  log('Request '+myUrl.myUrl.url);
  return new Promise((resolve, reject) => {
     request(myUrl.myUrl.url, function(error, response, body) {
        if (!error && response.statusCode == 200) {
            let today = formatDate(new Date(), 'YYYY-MM-DD');
            let watts = JSON.parse(body).result.watts;
            setState(myUrl.mySolarJSONAll, JSON.stringify(watts), true);
            let table = [];
            for(let time in watts) {
                let pos = time.indexOf(':00:00');
                if(time.includes(today) && pos != -1) {
                    let entry = {};
                    entry.Uhrzeit = time.substr(pos - 2, 5);
                    entry.Leistung = watts[time];
                    table.push(entry);
                }
            }
            log ('JSON: '+myUrl.mySolarJSON);
            setState(myUrl.mySolarJSON, JSON.stringify(table), true);
        // make GraphTable

            let graphTimeData = [];

            for(let time in watts) {
                    let graphEntry ={};
                    graphEntry.t = Date.parse(time);
                    graphEntry.y = watts[time];
                    graphTimeData.push(graphEntry);
            }
            var graph = {};
            var graphData ={};
            var graphAllData = [];
            graphData.data = graphTimeData;
            graphAllData.push(graphData);
            graph.graphs=graphAllData;
            setState(myUrl.mySolarJSONGraphAll, JSON.stringify(graph), true);

            resolve (body);
        }
    });
  })
}

function makeTable () {
    log ('MakeTable');
    let watts1 = JSON.parse(getState(SolarJSON1).val);
    let watts2 = JSON.parse(getState(SolarJSON2).val);
    log ('Items: '+watts1.length);
    let today = formatDate(new Date(), 'YYYY-MM-DD');
    let table = [];
    let graphTimeData = [];

    for(var n=0;n<watts1.length;n++) {
            let entry = {};
            let graphEntry ={};
            let thisTime = today +' '+ watts1[n].Uhrzeit;
            log (thisTime);
            entry.Uhrzeit = watts1[n].Uhrzeit;
            entry.Leistung1 = watts1[n].Leistung;
            entry.Leistung2 = watts2[n].Leistung;
            entry.Summe = watts1[n].Leistung + watts2[n].Leistung;
            table.push(entry);
            graphEntry.t = Date.parse(thisTime);
            graphEntry.y = watts1[n].Leistung + watts2[n].Leistung;
            graphTimeData.push(graphEntry);
    }

    var graph = {};
    var graphData ={};
    var graphAllData = [];
    graphData.data = graphTimeData;
    graphAllData.push(graphData);
    graph.graphs=graphAllData;
    setState(SolarJSONTable, JSON.stringify(table), true);
    setState(SolarJSONGraph, JSON.stringify(graph), true);
}

function getSolar() {
  Promise.all(promises)
  .then(function(bodys) {
    console.log("All url loaded");
    makeTable();
  })
}
und falls Du nur den heutigen Tag brauchst:
for(let time in watts) { if(time.includes(today){ let graphEntry ={}; graphEntry.t = Date.parse(time); graphEntry.y = watts[time]; graphTimeData.push(graphEntry); } }@gargano Scheint soweit zu funktionieren.
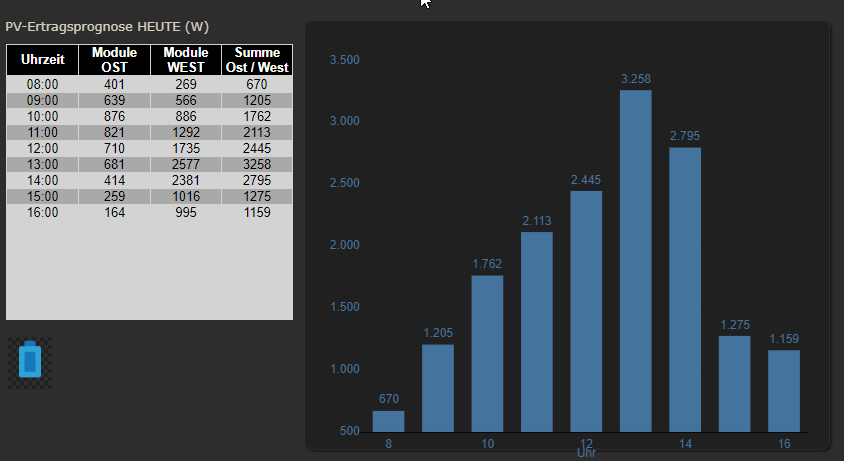
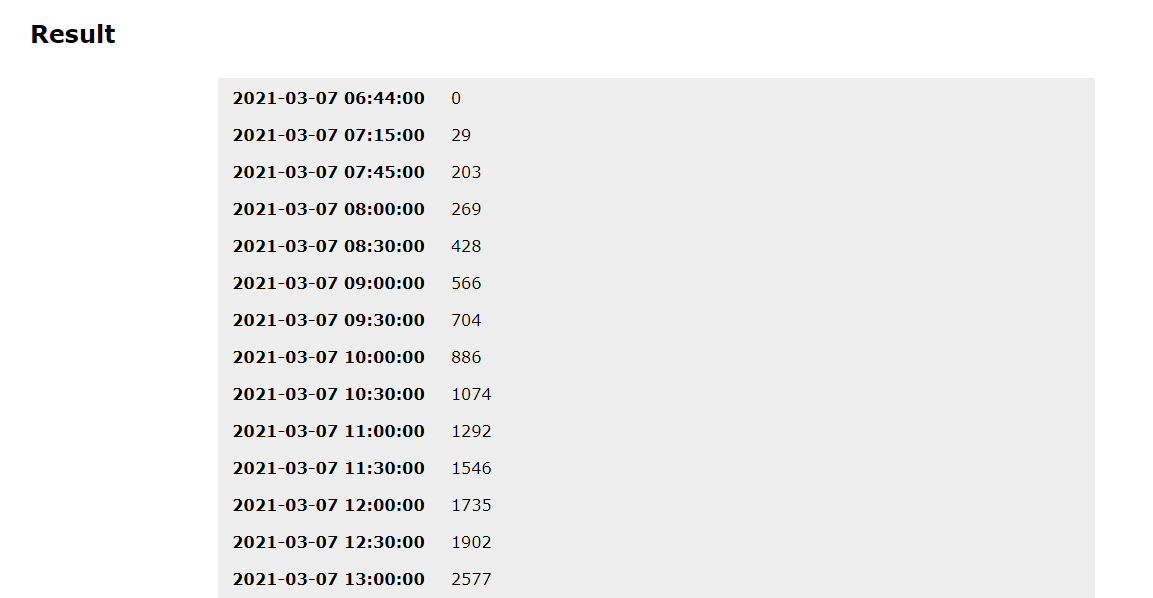
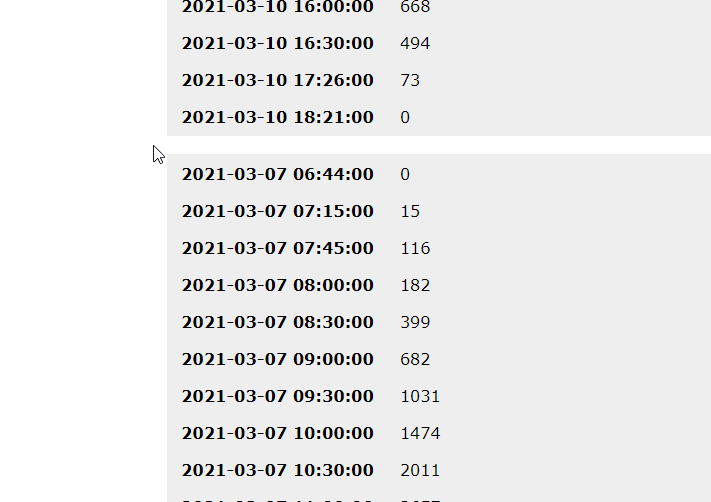
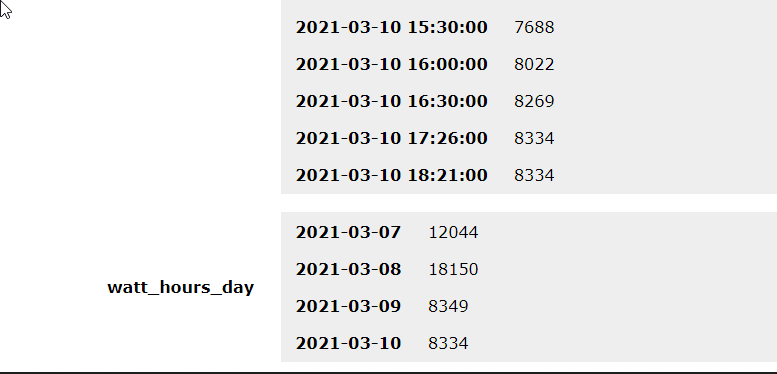
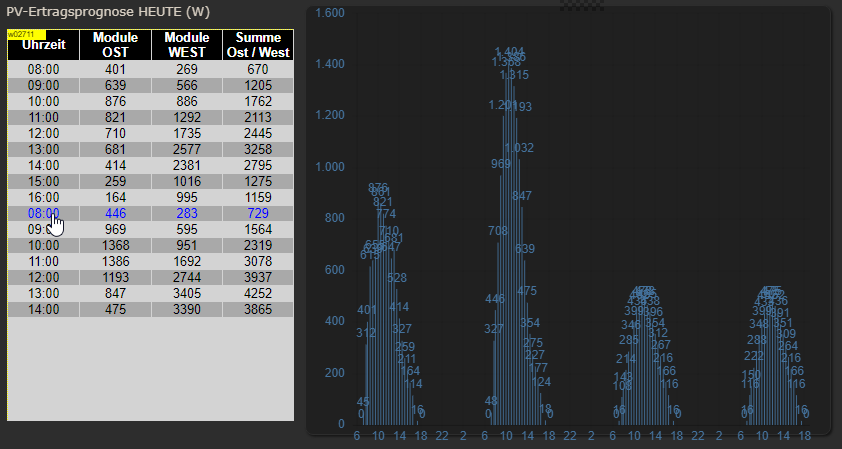
Der Tages Graph ist ja schon drin - das ist der DP "javascript.0.SolarForecast.JSONGraph".
Der basiert auf der javascript.0.SolarForecast.JSONTableDie beiden neuen DP`s - javascript.0.SolarForecast.JSONGraphAll1 und - javascript.0.SolarForecast.JSONGraphAll2 zeigen ja jeweils die mehrtägigen Werte einmal der OST und einmal der WEST Seite an.
Im Grunde fehlt jetzt noch ein Graph aus der Addition von OST & West als mehrtägige Darstellung ;)
ioBroker (since 2018) auf Intel Core i3-5005U NUC und Windwos10 Pro
-
@gargano Scheint soweit zu funktionieren.
Der Tages Graph ist ja schon drin - das ist der DP "javascript.0.SolarForecast.JSONGraph".
Der basiert auf der javascript.0.SolarForecast.JSONTableDie beiden neuen DP`s - javascript.0.SolarForecast.JSONGraphAll1 und - javascript.0.SolarForecast.JSONGraphAll2 zeigen ja jeweils die mehrtägigen Werte einmal der OST und einmal der WEST Seite an.
Im Grunde fehlt jetzt noch ein Graph aus der Addition von OST & West als mehrtägige Darstellung ;)
-
@jb_sullivan Kannst mal probeiren , indem Du in der Zeile
if(time.includes(today) && pos != -1) {time.includes(today) &&weglässt
let table = []; for(let time in watts) { let pos = time.indexOf(':00:00'); if(pos != -1) {Ne, ich glaube das war es nicht was ich meine. Die mehrtägigen Graphen stellen ja jeweils nur die OST bzw. die WEST Seite da. Es gibt keinen Graphen der die mehrtägigen Graphen O/W addiert.
Mit der Änderung wird nur die Tabelle um einen weiteren Tag in der Stunden Anzeige verlängert.
ioBroker (since 2018) auf Intel Core i3-5005U NUC und Windwos10 Pro
-
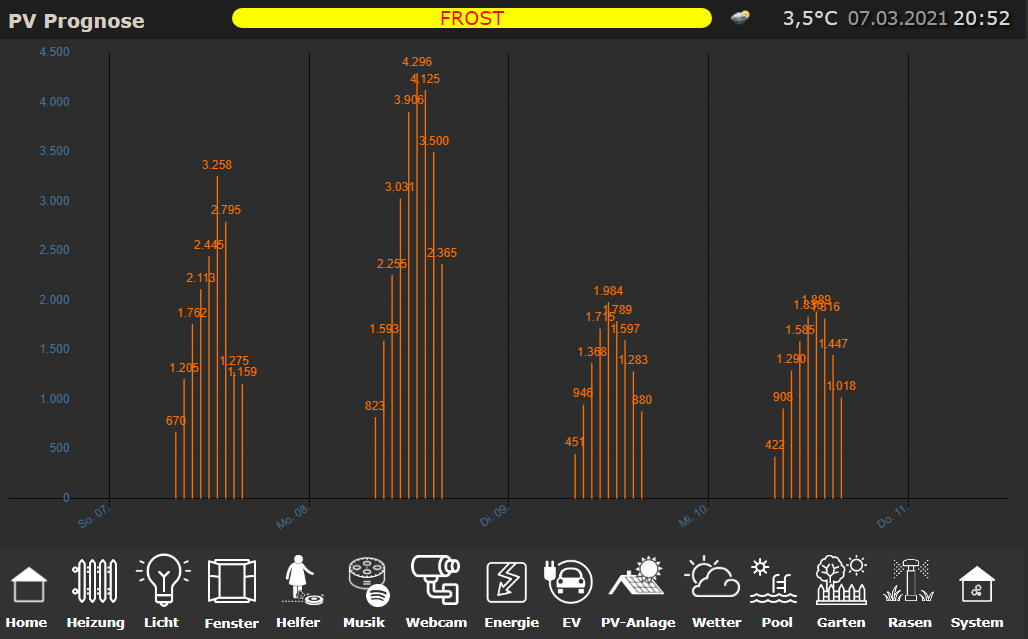
Ne, ich glaube das war es nicht was ich meine. Die mehrtägigen Graphen stellen ja jeweils nur die OST bzw. die WEST Seite da. Es gibt keinen Graphen der die mehrtägigen Graphen O/W addiert.
Mit der Änderung wird nur die Tabelle um einen weiteren Tag in der Stunden Anzeige verlängert.
@jb_sullivan Wenn Du wie oben beschreiben
time.includes(today) &&rausnimmst, dann müsste in "javascript.0.SolarForecast.JSONGraph" und "javascript.0.SolarForecast.JSONTable" die ganzen Tage enthalten sein mit der Summe
Noch was , zusätzlich in
entry.Uhrzeit = time.substr(pos - 2, 5)ändern in
entry.Uhrzeit = timeund in
function makeTable () {
    log ('MakeTable');
    let watts1 = JSON.parse(getState(SolarJSON1).val);
    let watts2 = JSON.parse(getState(SolarJSON2).val);
    log ('Items: '+watts1.length);
    let today = formatDate(new Date(), 'YYYY-MM-DD');
    let table = [];
    let graphTimeData = [];

    for(var n=0;n<watts1.length;n++) {
            let entry = {};
            let graphEntry ={};
            let thisTime = today +' '+ watts1[n].Uhrzeit;
let thisTime = today +' '+ watts1[n].Uhrzeit;ändern in
let thisTime = watts1[n].Uhrzeit; -
@jb_sullivan Wenn Du wie oben beschreiben
time.includes(today) &&rausnimmst, dann müsste in "javascript.0.SolarForecast.JSONGraph" und "javascript.0.SolarForecast.JSONTable" die ganzen Tage enthalten sein mit der Summe
Noch was , zusätzlich in
entry.Uhrzeit = time.substr(pos - 2, 5)ändern in
entry.Uhrzeit = timeund in
function makeTable () {
    log ('MakeTable');
    let watts1 = JSON.parse(getState(SolarJSON1).val);
    let watts2 = JSON.parse(getState(SolarJSON2).val);
    log ('Items: '+watts1.length);
    let today = formatDate(new Date(), 'YYYY-MM-DD');
    let table = [];
    let graphTimeData = [];

    for(var n=0;n<watts1.length;n++) {
            let entry = {};
            let graphEntry ={};
            let thisTime = today +' '+ watts1[n].Uhrzeit;
let thisTime = today +' '+ watts1[n].Uhrzeit;ändern in
let thisTime = watts1[n].Uhrzeit;So, was dein Skript betrifft, sieht jetzt alles ziemlich gut aus. Leider sind die Formatierungsmöglichkeiten in dem materialdesign json chart doch sehr begrenzt. Die Werte lassen sich z.B. nicht von den Balken für eine bessere Sichtbarkeit entkoppeln. Auch die Schriftfarbe der Werte ist immer die gleiche wie die der Balken.
Mal schauen, vielleicht meldet sich ja noch jemand zu dem anderen Thread zu Wort und wir bekommen die Werte irgendwie InfluxDB kompatibel verpackt.
Ich kann es nur immer wieder betonen, vielen Dank für die Zeit die du dir für dieses Script genommen hast. Ich hoffe du hast wenigstens auch etwas davon und kannst es ggf. auch irgendwie einsetzen oder verwenden.
Hey! Du scheinst an dieser Unterhaltung interessiert zu sein, hast aber noch kein Konto.
Hast du es satt, bei jedem Besuch durch die gleichen Beiträge zu scrollen? Wenn du dich für ein Konto anmeldest, kommst du immer genau dorthin zurück, wo du zuvor warst, und kannst dich über neue Antworten benachrichtigen lassen (entweder per E-Mail oder Push-Benachrichtigung). Du kannst auch Lesezeichen speichern und Beiträge positiv bewerten, um anderen Community-Mitgliedern deine Wertschätzung zu zeigen.
Mit deinem Input könnte dieser Beitrag noch besser werden 💗
Registrieren Anmelden411
Online33.0k
Benutzer83.5k
Themen1.3m
Beiträge