

[gelöst]Parser Adapter Refusol Inverter - der richtige Weg?
-
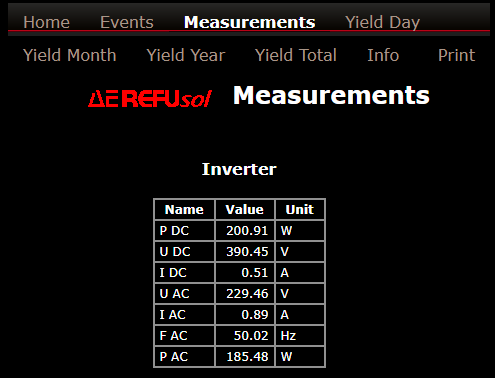
@Aiouh was bekommst du denn wenn du auf der Website mit der rechten Maustaste klickst und Quelltext anzeigen auswählst?
-
Rechte Maustaste "view page source", dann bekomme ich was ich zuerst gepostet hatte.
Bei "Inspect Page" bekomme ich: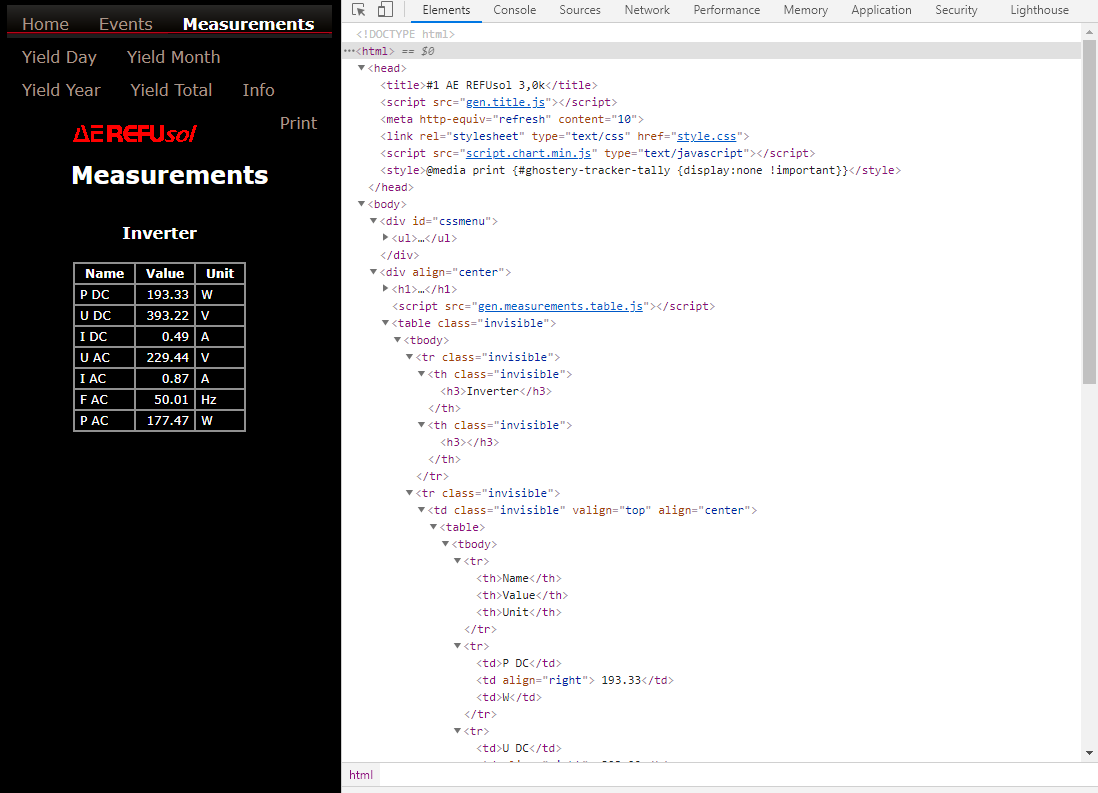
(hab noch nicht rausgefunden wie ich das komplett aufklappen und als Text kopieren kann)
-
Rechte Maustaste "view page source", dann bekomme ich was ich zuerst gepostet hatte.
Bei "Inspect Page" bekomme ich:(hab noch nicht rausgefunden wie ich das komplett aufklappen und als Text kopieren kann)
@Aiouh sagte in Parser Adapter Refusol Inverter - der richtige Weg?:
Bei "Inspect Page" bekomme ich:
das ist ja auch der Inhalt der über js aufbereiteten Seite.
@Aiouh sagte in Parser Adapter Refusol Inverter - der richtige Weg?:
Rechte Maustaste "view page source", dann bekomme ich was ich zuerst gepostet hatte.
das ist der echte Quelltext
... dann geht es nicht mit dem parser.
Du kannst jetzt mal unter events (??) nachsehen, wie diese Werte ausgelesen werden und ggf. diesen Befehl über js absetzen
oder kannst du das js-script gen.measurements.table.js sehen?
-
Zu früh gefreut, geht nicht :(, der Parser Adapter sieht nur nur das was unter "page source" gezeigt wird. Und da nutzt das parsen ja Nix
@Aiouh ... oder du schaust mal unter "Netzwerk" welche Requests gemacht werden. Wahrscheinlich wirst du in einer der Antworten die Werte finden. Dumm wäre nur, wenn es über WebSocket geht, dann bringt dir der Parser nichts. Für alle anderen Antworten sollte es gehen.
Bitte bei Problemen mit meinen Adaptern, Issue auf GitHub erfassen: Loxone | I2C | Luxtronik2
♡-lichen Dank an meine Sponsoren -
@Aiouh ... oder du schaust mal unter "Netzwerk" welche Requests gemacht werden. Wahrscheinlich wirst du in einer der Antworten die Werte finden. Dumm wäre nur, wenn es über WebSocket geht, dann bringt dir der Parser nichts. Für alle anderen Antworten sollte es gehen.
@UncleSam sagte in Parser Adapter Refusol Inverter - der richtige Weg?:
du schaust mal unter "Netzwerk" welche Requests gemacht werden.
Ach ja, so heisst das ;-)
-
@Aiouh sagte in Parser Adapter Refusol Inverter - der richtige Weg?:
Bei "Inspect Page" bekomme ich:
das ist ja auch der Inhalt der über js aufbereiteten Seite.
@Aiouh sagte in Parser Adapter Refusol Inverter - der richtige Weg?:
Rechte Maustaste "view page source", dann bekomme ich was ich zuerst gepostet hatte.
das ist der echte Quelltext
... dann geht es nicht mit dem parser.
Du kannst jetzt mal unter events (??) nachsehen, wie diese Werte ausgelesen werden und ggf. diesen Befehl über js absetzen
oder kannst du das js-script gen.measurements.table.js sehen?
js-script gen.measurements.table.js sieht wie folgt aus
document.write("<table class='invisible'><tr class='invisible'><th class='invisible'><h3>Inverter</h3></th><th class='invisible'><h3></h3></th></tr><tr class='invisible'><td class='invisible' valign='top' align='center'><table><tr><th>Name</th><th>Value</th><th>Unit</th></tr><tr><td>P DC</td><td align='right'> 72.20</td><td>W</td></tr><tr><td>U DC</td><td align='right'> 221.75</td><td>V</td></tr><tr><td>I DC</td><td align='right'> 0.33</td><td>A</td></tr><tr><td>U AC</td><td align='right'> 231.10</td><td>V</td></tr><tr><td>I AC</td><td align='right'> 0.31</td><td>A</td></tr><tr><td>F AC</td><td align='right'> 50.01</td><td>Hz</td></tr><tr><td>P AC</td><td align='right'> 56.62</td><td>W</td></tr></table></td><td class='invisible' valign='top' align='center'></table></td></tr></table>");da gibt es auch noch script.chart.min.js
var Chart = function(s) { function v(a, c, b) { a = A((a - c.graphMin) / (c.steps * c.stepValue), 1, 0); return b * c.steps * a } function x(a, c, b, e) { function h() { g += f; var k = a.animation ? A(d(g), null, 0) : 1; e.clearRect(0, 0, q, u); a.scaleOverlay ? (b(k), c()) : (c(), b(k)); if (1 >= g) D(h); else if ("function" == typeof a.onAnimationComplete) a.onAnimationComplete() } var f = a.animation ? 1 / A(a.animationSteps, Number.MAX_VALUE, 1) : 1 , d = B[a.animationEasing] , g = a.animation ? 0 : 1; "function" !== typeof c && (c = function() {} ); D(h) } function C(a, c, b, e, h, f) { var d; a = Math.floor(Math.log(e - h) / Math.LN10); h = Math.floor(h / (1 * Math.pow(10, a))) * Math.pow(10, a); e = Math.ceil(e / (1 * Math.pow(10, a))) * Math.pow(10, a) - h; a = Math.pow(10, a); for (d = Math.round(e / a); d < b || d > c; ) a = d < b ? a / 2 : 2 * a, d = Math.round(e / a); c = []; z(f, c, d, h, a); return { steps: d, stepValue: a, graphMin: h, labels: c } } function z(a, c, b, e, h) { if (a) for (var f = 1; f < b + 1; f++) c.push(E(a, { value: (e + h * f).toFixed(0 != h % 1 ? h.toString().split(".")[1].length : 0) })) } function A(a, c, b) { return !isNaN(parseFloat(c)) && isFinite(c) && a > c ? c : !isNaN(parseFloat(b)) && isFinite(b) && a < b ? b : a } function y(a, c) { var b = {}, e; for (e in a) b[e] = a[e]; for (e in c) b[e] = c[e]; return b } function E(a, c) { var b = !/\W/.test(a) ? F[a] = F[a] || E(document.getElementById(a).innerHTML) : new Function("obj","var p=[],print=function(){p.push.apply(p,arguments);};with(obj){p.push('" + a.replace(/[\r\t\n]/g, " ").split("<%").join("\t").replace(/((^|%>)[^\t]*)'/g, "$1\r").replace(/\t=(.*?)%>/g, "',$1,'").split("\t").join("');").split("%>").join("p.push('").split("\r").join("\\'") + "');}return p.join('');"); return c ? b(c) : b } var r = this , B = { linear: function(a) { return a }, easeInQuad: function(a) { return a * a }, easeOutQuad: function(a) { return -1 * a * (a - 2) }, easeInOutQuad: function(a) { return 1 > (a /= 0.5) ? 0.5 * a * a : -0.5 * (--a * (a - 2) - 1) }, easeInCubic: function(a) { return a * a * a }, easeOutCubic: function(a) { return 1 * ((a = a / 1 - 1) * a * a + 1) }, easeInOutCubic: function(a) { return 1 > (a /= 0.5) ? 0.5 * a * a * a : 0.5 * ((a -= 2) * a * a + 2) }, easeInQuart: function(a) { return a * a * a * a }, easeOutQuart: function(a) { return -1 * ((a = a / 1 - 1) * a * a * a - 1) }, easeInOutQuart: function(a) { return 1 > (a /= 0.5) ? 0.5 * a * a * a * a : -0.5 * ((a -= 2) * a * a * a - 2) }, easeInQuint: function(a) { return 1 * (a /= 1) * a * a * a * a }, easeOutQuint: function(a) { return 1 * ((a = a / 1 - 1) * a * a * a * a + 1) }, easeInOutQuint: function(a) { return 1 > (a /= 0.5) ? 0.5 * a * a * a * a * a : 0.5 * ((a -= 2) * a * a * a * a + 2) }, easeInSine: function(a) { return -1 * Math.cos(a / 1 * (Math.PI / 2)) + 1 }, easeOutSine: function(a) { return 1 * Math.sin(a / 1 * (Math.PI / 2)) }, easeInOutSine: function(a) { return -0.5 * (Math.cos(Math.PI * a / 1) - 1) }, easeInExpo: function(a) { return 0 == a ? 1 : 1 * Math.pow(2, 10 * (a / 1 - 1)) }, easeOutExpo: function(a) { return 1 == a ? 1 : 1 * (-Math.pow(2, -10 * a / 1) + 1) }, easeInOutExpo: function(a) { return 0 == a ? 0 : 1 == a ? 1 : 1 > (a /= 0.5) ? 0.5 * Math.pow(2, 10 * (a - 1)) : 0.5 * (-Math.pow(2, -10 * --a) + 2) }, easeInCirc: function(a) { return 1 <= a ? a : -1 * (Math.sqrt(1 - (a /= 1) * a) - 1) }, easeOutCirc: function(a) { return 1 * Math.sqrt(1 - (a = a / 1 - 1) * a) }, easeInOutCirc: function(a) { return 1 > (a /= 0.5) ? -0.5 * (Math.sqrt(1 - a * a) - 1) : 0.5 * (Math.sqrt(1 - (a -= 2) * a) + 1) }, easeInElastic: function(a) { var c = 1.70158 , b = 0 , e = 1; if (0 == a) return 0; if (1 == (a /= 1)) return 1; b || (b = 0.3); e < Math.abs(1) ? (e = 1, c = b / 4) : c = b / (2 * Math.PI) * Math.asin(1 / e); return -(e * Math.pow(2, 10 * (a -= 1)) * Math.sin((1 * a - c) * 2 * Math.PI / b)) }, easeOutElastic: function(a) { var c = 1.70158 , b = 0 , e = 1; if (0 == a) return 0; if (1 == (a /= 1)) return 1; b || (b = 0.3); e < Math.abs(1) ? (e = 1, c = b / 4) : c = b / (2 * Math.PI) * Math.asin(1 / e); return e * Math.pow(2, -10 * a) * Math.sin((1 * a - c) * 2 * Math.PI / b) + 1 }, easeInOutElastic: function(a) { var c = 1.70158 , b = 0 , e = 1; if (0 == a) return 0; if (2 == (a /= 0.5)) return 1; b || (b = 1 * 0.3 * 1.5); e < Math.abs(1) ? (e = 1, c = b / 4) : c = b / (2 * Math.PI) * Math.asin(1 / e); return 1 > a ? -0.5 * e * Math.pow(2, 10 * (a -= 1)) * Math.sin((1 * a - c) * 2 * Math.PI / b) : 0.5 * e * Math.pow(2, -10 * (a -= 1)) * Math.sin((1 * a - c) * 2 * Math.PI / b) + 1 }, easeInBack: function(a) { return 1 * (a /= 1) * a * (2.70158 * a - 1.70158) }, easeOutBack: function(a) { return 1 * ((a = a / 1 - 1) * a * (2.70158 * a + 1.70158) + 1) }, easeInOutBack: function(a) { var c = 1.70158; return 1 > (a /= 0.5) ? 0.5 * a * a * (((c *= 1.525) + 1) * a - c) : 0.5 * ((a -= 2) * a * (((c *= 1.525) + 1) * a + c) + 2) }, easeInBounce: function(a) { return 1 - B.easeOutBounce(1 - a) }, easeOutBounce: function(a) { return (a /= 1) < 1 / 2.75 ? 1 * 7.5625 * a * a : a < 2 / 2.75 ? 1 * (7.5625 * (a -= 1.5 / 2.75) * a + 0.75) : a < 2.5 / 2.75 ? 1 * (7.5625 * (a -= 2.25 / 2.75) * a + 0.9375) : 1 * (7.5625 * (a -= 2.625 / 2.75) * a + 0.984375) }, easeInOutBounce: function(a) { return 0.5 > a ? 0.5 * B.easeInBounce(2 * a) : 0.5 * B.easeOutBounce(2 * a - 1) + 0.5 } } , q = s.canvas.width , u = s.canvas.height; window.devicePixelRatio && (s.canvas.style.width = q + "px", s.canvas.style.height = u + "px", s.canvas.height = u * window.devicePixelRatio, s.canvas.width = q * window.devicePixelRatio, s.scale(window.devicePixelRatio, window.devicePixelRatio)); this.PolarArea = function(a, c) { r.PolarArea.defaults = { scaleOverlay: !0, scaleOverride: !1, scaleSteps: null, scaleStepWidth: null, scaleStartValue: null, scaleShowLine: !0, scaleLineColor: "rgba(0,0,0,.1)", scaleLineWidth: 1, scaleShowLabels: !0, scaleLabel: "<%=value%>", scaleFontFamily: "'Arial'", scaleFontSize: 12, scaleFontStyle: "normal", scaleFontColor: "#666", scaleShowLabelBackdrop: !0, scaleBackdropColor: "rgba(255,255,255,0.75)", scaleBackdropPaddingY: 2, scaleBackdropPaddingX: 2, segmentShowStroke: !0, segmentStrokeColor: "#fff", segmentStrokeWidth: 2, animation: !0, animationSteps: 100, animationEasing: "easeOutBounce", animateRotate: !0, animateScale: !1, onAnimationComplete: null }; var b = c ? y(r.PolarArea.defaults, c) : r.PolarArea.defaults; return new G(a,b,s) } ; this.Radar = function(a, c) { r.Radar.defaults = { scaleOverlay: !1, scaleOverride: !1, scaleSteps: null, scaleStepWidth: null, scaleStartValue: null, scaleShowLine: !0, scaleLineColor: "rgba(0,0,0,.1)", scaleLineWidth: 1, scaleShowLabels: !1, scaleLabel: "<%=value%>", scaleFontFamily: "'Arial'", scaleFontSize: 12, scaleFontStyle: "normal", scaleFontColor: "#666", scaleShowLabelBackdrop: !0, scaleBackdropColor: "rgba(255,255,255,0.75)", scaleBackdropPaddingY: 2, scaleBackdropPaddingX: 2, angleShowLineOut: !0, angleLineColor: "rgba(0,0,0,.1)", angleLineWidth: 1, pointLabelFontFamily: "'Arial'", pointLabelFontStyle: "normal", pointLabelFontSize: 12, pointLabelFontColor: "#666", pointDot: !0, pointDotRadius: 3, pointDotStrokeWidth: 1, datasetStroke: !0, datasetStrokeWidth: 2, datasetFill: !0, animation: !0, animationSteps: 60, animationEasing: "easeOutQuart", onAnimationComplete: null }; var b = c ? y(r.Radar.defaults, c) : r.Radar.defaults; return new H(a,b,s) } ; this.Pie = function(a, c) { r.Pie.defaults = { segmentShowStroke: !0, segmentStrokeColor: "#fff", segmentStrokeWidth: 2, animation: !0, animationSteps: 100, animationEasing: "easeOutBounce", animateRotate: !0, animateScale: !1, onAnimationComplete: null }; var b = c ? y(r.Pie.defaults, c) : r.Pie.defaults; return new I(a,b,s) } ; this.Doughnut = function(a, c) { r.Doughnut.defaults = { segmentShowStroke: !0, segmentStrokeColor: "#fff", segmentStrokeWidth: 2, percentageInnerCutout: 50, animation: !0, animationSteps: 100, animationEasing: "easeOutBounce", animateRotate: !0, animateScale: !1, onAnimationComplete: null }; var b = c ? y(r.Doughnut.defaults, c) : r.Doughnut.defaults; return new J(a,b,s) } ; this.Line = function(a, c) { r.Line.defaults = { scaleOverlay: !1, scaleOverride: !1, scaleSteps: null, scaleStepWidth: null, scaleStartValue: null, scaleLineColor: "rgba(0,0,0,.1)", scaleLineWidth: 1, scaleShowLabels: !0, scaleLabel: "<%=value%>", scaleFontFamily: "'Arial'", scaleFontSize: 12, scaleFontStyle: "normal", scaleFontColor: "#666", scaleShowGridLines: !0, scaleGridLineColor: "rgba(0,0,0,.05)", scaleGridLineWidth: 1, bezierCurve: !0, pointDot: !0, pointDotRadius: 4, pointDotStrokeWidth: 2, datasetStroke: !0, datasetStrokeWidth: 2, datasetFill: !0, animation: !0, animationSteps: 60, animationEasing: "easeOutQuart", onAnimationComplete: null }; var b = c ? y(r.Line.defaults, c) : r.Line.defaults; return new K(a,b,s) } ; this.Bar = function(a, c) { r.Bar.defaults = { scaleOverlay: !1, scaleOverride: !1, scaleSteps: null, scaleStepWidth: null, scaleStartValue: null, scaleLineColor: "rgba(0,0,0,.1)", scaleLineWidth: 1, scaleShowLabels: !0, scaleLabel: "<%=value%>", scaleFontFamily: "'Arial'", scaleFontSize: 12, scaleFontStyle: "normal", scaleFontColor: "#666", scaleShowGridLines: !0, scaleGridLineColor: "rgba(0,0,0,.05)", scaleGridLineWidth: 1, barShowStroke: !0, barStrokeWidth: 2, barValueSpacing: 5, barDatasetSpacing: 1, animation: !0, animationSteps: 60, animationEasing: "easeOutQuart", onAnimationComplete: null }; var b = c ? y(r.Bar.defaults, c) : r.Bar.defaults; return new L(a,b,s) } ; var G = function(a, c, b) { var e, h, f, d, g, k, j, l, m; g = Math.min.apply(Math, [q, u]) / 2; g -= Math.max.apply(Math, [0.5 * c.scaleFontSize, 0.5 * c.scaleLineWidth]); d = 2 * c.scaleFontSize; c.scaleShowLabelBackdrop && (d += 2 * c.scaleBackdropPaddingY, g -= 1.5 * c.scaleBackdropPaddingY); l = g; d = d ? d : 5; e = Number.MIN_VALUE; h = Number.MAX_VALUE; for (f = 0; f < a.length; f++) a[f].value > e && (e = a[f].value), a[f].value < h && (h = a[f].value); f = Math.floor(l / (0.66 * d)); d = Math.floor(0.5 * (l / d)); m = c.scaleShowLabels ? c.scaleLabel : null; c.scaleOverride ? (j = { steps: c.scaleSteps, stepValue: c.scaleStepWidth, graphMin: c.scaleStartValue, labels: [] }, z(m, j.labels, j.steps, c.scaleStartValue, c.scaleStepWidth)) : j = C(l, f, d, e, h, m); k = g / j.steps; x(c, function() { for (var a = 0; a < j.steps; a++) if (c.scaleShowLine && (b.beginPath(), b.arc(q / 2, u / 2, k * (a + 1), 0, 2 * Math.PI, !0), b.strokeStyle = c.scaleLineColor, b.lineWidth = c.scaleLineWidth, b.stroke()), c.scaleShowLabels) { b.textAlign = "center"; b.font = c.scaleFontStyle + " " + c.scaleFontSize + "px " + c.scaleFontFamily; var e = j.labels[a]; if (c.scaleShowLabelBackdrop) { var d = b.measureText(e).width; b.fillStyle = c.scaleBackdropColor; b.beginPath(); b.rect(Math.round(q / 2 - d / 2 - c.scaleBackdropPaddingX), Math.round(u / 2 - k * (a + 1) - 0.5 * c.scaleFontSize - c.scaleBackdropPaddingY), Math.round(d + 2 * c.scaleBackdropPaddingX), Math.round(c.scaleFontSize + 2 * c.scaleBackdropPaddingY)); b.fill() } b.textBaseline = "middle"; b.fillStyle = c.scaleFontColor; b.fillText(e, q / 2, u / 2 - k * (a + 1)) } }, function(e) { var d = -Math.PI / 2 , g = 2 * Math.PI / a.length , f = 1 , h = 1; c.animation && (c.animateScale && (f = e), c.animateRotate && (h = e)); for (e = 0; e < a.length; e++) b.beginPath(), b.arc(q / 2, u / 2, f * v(a[e].value, j, k), d, d + h * g, !1), b.lineTo(q / 2, u / 2), b.closePath(), b.fillStyle = a[e].color, b.fill(), c.segmentShowStroke && (b.strokeStyle = c.segmentStrokeColor, b.lineWidth = c.segmentStrokeWidth, b.stroke()), d += h * g }, b) } , H = function(a, c, b) { var e, h, f, d, g, k, j, l, m; a.labels || (a.labels = []); g = Math.min.apply(Math, [q, u]) / 2; d = 2 * c.scaleFontSize; for (e = l = 0; e < a.labels.length; e++) b.font = c.pointLabelFontStyle + " " + c.pointLabelFontSize + "px " + c.pointLabelFontFamily, h = b.measureText(a.labels[e]).width, h > l && (l = h); g -= Math.max.apply(Math, [l, 1.5 * (c.pointLabelFontSize / 2)]); g -= c.pointLabelFontSize; l = g = A(g, null, 0); d = d ? d : 5; e = Number.MIN_VALUE; h = Number.MAX_VALUE; for (f = 0; f < a.datasets.length; f++) for (m = 0; m < a.datasets[f].data.length; m++) a.datasets[f].data[m] > e && (e = a.datasets[f].data[m]), a.datasets[f].data[m] < h && (h = a.datasets[f].data[m]); f = Math.floor(l / (0.66 * d)); d = Math.floor(0.5 * (l / d)); m = c.scaleShowLabels ? c.scaleLabel : null; c.scaleOverride ? (j = { steps: c.scaleSteps, stepValue: c.scaleStepWidth, graphMin: c.scaleStartValue, labels: [] }, z(m, j.labels, j.steps, c.scaleStartValue, c.scaleStepWidth)) : j = C(l, f, d, e, h, m); k = g / j.steps; x(c, function() { var e = 2 * Math.PI / a.datasets[0].data.length; b.save(); b.translate(q / 2, u / 2); if (c.angleShowLineOut) { b.strokeStyle = c.angleLineColor; b.lineWidth = c.angleLineWidth; for (var d = 0; d < a.datasets[0].data.length; d++) b.rotate(e), b.beginPath(), b.moveTo(0, 0), b.lineTo(0, -g), b.stroke() } for (d = 0; d < j.steps; d++) { b.beginPath(); if (c.scaleShowLine) { b.strokeStyle = c.scaleLineColor; b.lineWidth = c.scaleLineWidth; b.moveTo(0, -k * (d + 1)); for (var f = 0; f < a.datasets[0].data.length; f++) b.rotate(e), b.lineTo(0, -k * (d + 1)); b.closePath(); b.stroke() } c.scaleShowLabels && (b.textAlign = "center", b.font = c.scaleFontStyle + " " + c.scaleFontSize + "px " + c.scaleFontFamily, b.textBaseline = "middle", c.scaleShowLabelBackdrop && (f = b.measureText(j.labels[d]).width, b.fillStyle = c.scaleBackdropColor, b.beginPath(), b.rect(Math.round(-f / 2 - c.scaleBackdropPaddingX), Math.round(-k * (d + 1) - 0.5 * c.scaleFontSize - c.scaleBackdropPaddingY), Math.round(f + 2 * c.scaleBackdropPaddingX), Math.round(c.scaleFontSize + 2 * c.scaleBackdropPaddingY)), b.fill()), b.fillStyle = c.scaleFontColor, b.fillText(j.labels[d], 0, -k * (d + 1))) } for (d = 0; d < a.labels.length; d++) { b.font = c.pointLabelFontStyle + " " + c.pointLabelFontSize + "px " + c.pointLabelFontFamily; b.fillStyle = c.pointLabelFontColor; var f = Math.sin(e * d) * (g + c.pointLabelFontSize) , h = Math.cos(e * d) * (g + c.pointLabelFontSize); b.textAlign = e * d == Math.PI || 0 == e * d ? "center" : e * d > Math.PI ? "right" : "left"; b.textBaseline = "middle"; b.fillText(a.labels[d], f, -h) } b.restore() }, function(d) { var e = 2 * Math.PI / a.datasets[0].data.length; b.save(); b.translate(q / 2, u / 2); for (var g = 0; g < a.datasets.length; g++) { b.beginPath(); b.moveTo(0, d * -1 * v(a.datasets[g].data[0], j, k)); for (var f = 1; f < a.datasets[g].data.length; f++) b.rotate(e), b.lineTo(0, d * -1 * v(a.datasets[g].data[f], j, k)); b.closePath(); b.fillStyle = a.datasets[g].fillColor; b.strokeStyle = a.datasets[g].strokeColor; b.lineWidth = c.datasetStrokeWidth; b.fill(); b.stroke(); if (c.pointDot) { b.fillStyle = a.datasets[g].pointColor; b.strokeStyle = a.datasets[g].pointStrokeColor; b.lineWidth = c.pointDotStrokeWidth; for (f = 0; f < a.datasets[g].data.length; f++) b.rotate(e), b.beginPath(), b.arc(0, d * -1 * v(a.datasets[g].data[f], j, k), c.pointDotRadius, 2 * Math.PI, !1), b.fill(), b.stroke() } b.rotate(e) } b.restore() }, b) } , I = function(a, c, b) { for (var e = 0, h = Math.min.apply(Math, [u / 2, q / 2]) - 5, f = 0; f < a.length; f++) e += a[f].value; x(c, null, function(d) { var g = -Math.PI / 2 , f = 1 , j = 1; c.animation && (c.animateScale && (f = d), c.animateRotate && (j = d)); for (d = 0; d < a.length; d++) { var l = j * a[d].value / e * 2 * Math.PI; b.beginPath(); b.arc(q / 2, u / 2, f * h, g, g + l); b.lineTo(q / 2, u / 2); b.closePath(); b.fillStyle = a[d].color; b.fill(); c.segmentShowStroke && (b.lineWidth = c.segmentStrokeWidth, b.strokeStyle = c.segmentStrokeColor, b.stroke()); g += l } }, b) } , J = function(a, c, b) { for (var e = 0, h = Math.min.apply(Math, [u / 2, q / 2]) - 5, f = h * (c.percentageInnerCutout / 100), d = 0; d < a.length; d++) e += a[d].value; x(c, null, function(d) { var k = -Math.PI / 2 , j = 1 , l = 1; c.animation && (c.animateScale && (j = d), c.animateRotate && (l = d)); for (d = 0; d < a.length; d++) { var m = l * a[d].value / e * 2 * Math.PI; b.beginPath(); b.arc(q / 2, u / 2, j * h, k, k + m, !1); b.arc(q / 2, u / 2, j * f, k + m, k, !0); b.closePath(); b.fillStyle = a[d].color; b.fill(); c.segmentShowStroke && (b.lineWidth = c.segmentStrokeWidth, b.strokeStyle = c.segmentStrokeColor, b.stroke()); k += m } }, b) } , K = function(a, c, b) { var e, h, f, d, g, k, j, l, m, t, r, n, p, s = 0; g = u; b.font = c.scaleFontStyle + " " + c.scaleFontSize + "px " + c.scaleFontFamily; t = 1; for (d = 0; d < a.labels.length; d++) e = b.measureText(a.labels[d]).width, t = e > t ? e : t; q / a.labels.length < t ? (s = 45, q / a.labels.length < Math.cos(s) * t ? (s = 90, g -= t) : g -= Math.sin(s) * t) : g -= c.scaleFontSize; d = c.scaleFontSize; g = g - 5 - d; e = Number.MIN_VALUE; h = Number.MAX_VALUE; for (f = 0; f < a.datasets.length; f++) for (l = 0; l < a.datasets[f].data.length; l++) a.datasets[f].data[l] > e && (e = a.datasets[f].data[l]), a.datasets[f].data[l] < h && (h = a.datasets[f].data[l]); f = Math.floor(g / (0.66 * d)); d = Math.floor(0.5 * (g / d)); l = c.scaleShowLabels ? c.scaleLabel : ""; c.scaleOverride ? (j = { steps: c.scaleSteps, stepValue: c.scaleStepWidth, graphMin: c.scaleStartValue, labels: [] }, z(l, j.labels, j.steps, c.scaleStartValue, c.scaleStepWidth)) : j = C(g, f, d, e, h, l); k = Math.floor(g / j.steps); d = 1; if (c.scaleShowLabels) { b.font = c.scaleFontStyle + " " + c.scaleFontSize + "px " + c.scaleFontFamily; for (e = 0; e < j.labels.length; e++) h = b.measureText(j.labels[e]).width, d = h > d ? h : d; d += 10 } r = q - d - t; m = Math.floor(r / (a.labels.length - 1)); n = q - t / 2 - r; p = g + c.scaleFontSize / 2; x(c, function() { b.lineWidth = c.scaleLineWidth; b.strokeStyle = c.scaleLineColor; b.beginPath(); b.moveTo(q - t / 2 + 5, p); b.lineTo(q - t / 2 - r - 5, p); b.stroke(); 0 < s ? (b.save(), b.textAlign = "right") : b.textAlign = "center"; b.fillStyle = c.scaleFontColor; for (var d = 0; d < a.labels.length; d++) b.save(), 0 < s ? (b.translate(n + d * m, p + c.scaleFontSize), b.rotate(-(s * (Math.PI / 180))), b.fillText(a.labels[d], 0, 0), b.restore()) : b.fillText(a.labels[d], n + d * m, p + c.scaleFontSize + 3), b.beginPath(), b.moveTo(n + d * m, p + 3), c.scaleShowGridLines && 0 < d ? (b.lineWidth = c.scaleGridLineWidth, b.strokeStyle = c.scaleGridLineColor, b.lineTo(n + d * m, 5)) : b.lineTo(n + d * m, p + 3), b.stroke(); b.lineWidth = c.scaleLineWidth; b.strokeStyle = c.scaleLineColor; b.beginPath(); b.moveTo(n, p + 5); b.lineTo(n, 5); b.stroke(); b.textAlign = "right"; b.textBaseline = "middle"; for (d = 0; d < j.steps; d++) b.beginPath(), b.moveTo(n - 3, p - (d + 1) * k), c.scaleShowGridLines ? (b.lineWidth = c.scaleGridLineWidth, b.strokeStyle = c.scaleGridLineColor, b.lineTo(n + r + 5, p - (d + 1) * k)) : b.lineTo(n - 0.5, p - (d + 1) * k), b.stroke(), c.scaleShowLabels && b.fillText(j.labels[d], n - 8, p - (d + 1) * k) }, function(d) { function e(b, c) { return p - d * v(a.datasets[b].data[c], j, k) } for (var f = 0; f < a.datasets.length; f++) { b.strokeStyle = a.datasets[f].strokeColor; b.lineWidth = c.datasetStrokeWidth; b.beginPath(); b.moveTo(n, p - d * v(a.datasets[f].data[0], j, k)); for (var g = 1; g < a.datasets[f].data.length; g++) c.bezierCurve ? b.bezierCurveTo(n + m * (g - 0.5), e(f, g - 1), n + m * (g - 0.5), e(f, g), n + m * g, e(f, g)) : b.lineTo(n + m * g, e(f, g)); b.stroke(); c.datasetFill ? (b.lineTo(n + m * (a.datasets[f].data.length - 1), p), b.lineTo(n, p), b.closePath(), b.fillStyle = a.datasets[f].fillColor, b.fill()) : b.closePath(); if (c.pointDot) { b.fillStyle = a.datasets[f].pointColor; b.strokeStyle = a.datasets[f].pointStrokeColor; b.lineWidth = c.pointDotStrokeWidth; for (g = 0; g < a.datasets[f].data.length; g++) b.beginPath(), b.arc(n + m * g, p - d * v(a.datasets[f].data[g], j, k), c.pointDotRadius, 0, 2 * Math.PI, !0), b.fill(), b.stroke() } } }, b) } , L = function(a, c, b) { var e, h, f, d, g, k, j, l, m, t, r, n, p, s, w = 0; g = u; b.font = c.scaleFontStyle + " " + c.scaleFontSize + "px " + c.scaleFontFamily; t = 1; for (d = 0; d < a.labels.length; d++) e = b.measureText(a.labels[d]).width, t = e > t ? e : t; q / a.labels.length < t ? (w = 45, q / a.labels.length < Math.cos(w) * t ? (w = 90, g -= t) : g -= Math.sin(w) * t) : g -= c.scaleFontSize; d = c.scaleFontSize; g = g - 5 - d; e = Number.MIN_VALUE; h = Number.MAX_VALUE; for (f = 0; f < a.datasets.length; f++) for (l = 0; l < a.datasets[f].data.length; l++) a.datasets[f].data[l] > e && (e = a.datasets[f].data[l]), a.datasets[f].data[l] < h && (h = a.datasets[f].data[l]); f = Math.floor(g / (0.66 * d)); d = Math.floor(0.5 * (g / d)); l = c.scaleShowLabels ? c.scaleLabel : ""; c.scaleOverride ? (j = { steps: c.scaleSteps, stepValue: c.scaleStepWidth, graphMin: c.scaleStartValue, labels: [] }, z(l, j.labels, j.steps, c.scaleStartValue, c.scaleStepWidth)) : j = C(g, f, d, e, h, l); k = Math.floor(g / j.steps); d = 1; if (c.scaleShowLabels) { b.font = c.scaleFontStyle + " " + c.scaleFontSize + "px " + c.scaleFontFamily; for (e = 0; e < j.labels.length; e++) h = b.measureText(j.labels[e]).width, d = h > d ? h : d; d += 10 } r = q - d - t; m = Math.floor(r / a.labels.length); s = (m - 2 * c.scaleGridLineWidth - 2 * c.barValueSpacing - (c.barDatasetSpacing * a.datasets.length - 1) - (c.barStrokeWidth / 2 * a.datasets.length - 1)) / a.datasets.length; n = q - t / 2 - r; p = g + c.scaleFontSize / 2; x(c, function() { b.lineWidth = c.scaleLineWidth; b.strokeStyle = c.scaleLineColor; b.beginPath(); b.moveTo(q - t / 2 + 5, p); b.lineTo(q - t / 2 - r - 5, p); b.stroke(); 0 < w ? (b.save(), b.textAlign = "right") : b.textAlign = "center"; b.fillStyle = c.scaleFontColor; for (var d = 0; d < a.labels.length; d++) b.save(), 0 < w ? (b.translate(n + d * m, p + c.scaleFontSize), b.rotate(-(w * (Math.PI / 180))), b.fillText(a.labels[d], 0, 0), b.restore()) : b.fillText(a.labels[d], n + d * m + m / 2, p + c.scaleFontSize + 3), b.beginPath(), b.moveTo(n + (d + 1) * m, p + 3), b.lineWidth = c.scaleGridLineWidth, b.strokeStyle = c.scaleGridLineColor, b.lineTo(n + (d + 1) * m, 5), b.stroke(); b.lineWidth = c.scaleLineWidth; b.strokeStyle = c.scaleLineColor; b.beginPath(); b.moveTo(n, p + 5); b.lineTo(n, 5); b.stroke(); b.textAlign = "right"; b.textBaseline = "middle"; for (d = 0; d < j.steps; d++) b.beginPath(), b.moveTo(n - 3, p - (d + 1) * k), c.scaleShowGridLines ? (b.lineWidth = c.scaleGridLineWidth, b.strokeStyle = c.scaleGridLineColor, b.lineTo(n + r + 5, p - (d + 1) * k)) : b.lineTo(n - 0.5, p - (d + 1) * k), b.stroke(), c.scaleShowLabels && b.fillText(j.labels[d], n - 8, p - (d + 1) * k) }, function(d) { b.lineWidth = c.barStrokeWidth; for (var e = 0; e < a.datasets.length; e++) { b.fillStyle = a.datasets[e].fillColor; b.strokeStyle = a.datasets[e].strokeColor; for (var f = 0; f < a.datasets[e].data.length; f++) { var g = n + c.barValueSpacing + m * f + s * e + c.barDatasetSpacing * e + c.barStrokeWidth * e; b.beginPath(); b.moveTo(g, p); b.lineTo(g, p - d * v(a.datasets[e].data[f], j, k) + c.barStrokeWidth / 2); b.lineTo(g + s, p - d * v(a.datasets[e].data[f], j, k) + c.barStrokeWidth / 2); b.lineTo(g + s, p); c.barShowStroke && b.stroke(); b.closePath(); b.fill() } } }, b) } , D = window.requestAnimationFrame || window.webkitRequestAnimationFrame || window.mozRequestAnimationFrame || window.oRequestAnimationFrame || window.msRequestAnimationFrame || function(a) { window.setTimeout(a, 1E3 / 60) } , F = {} };Unter Network siehts so aus

-
js-script gen.measurements.table.js sieht wie folgt aus
document.write("<table class='invisible'><tr class='invisible'><th class='invisible'><h3>Inverter</h3></th><th class='invisible'><h3></h3></th></tr><tr class='invisible'><td class='invisible' valign='top' align='center'><table><tr><th>Name</th><th>Value</th><th>Unit</th></tr><tr><td>P DC</td><td align='right'> 72.20</td><td>W</td></tr><tr><td>U DC</td><td align='right'> 221.75</td><td>V</td></tr><tr><td>I DC</td><td align='right'> 0.33</td><td>A</td></tr><tr><td>U AC</td><td align='right'> 231.10</td><td>V</td></tr><tr><td>I AC</td><td align='right'> 0.31</td><td>A</td></tr><tr><td>F AC</td><td align='right'> 50.01</td><td>Hz</td></tr><tr><td>P AC</td><td align='right'> 56.62</td><td>W</td></tr></table></td><td class='invisible' valign='top' align='center'></table></td></tr></table>");da gibt es auch noch script.chart.min.js
var Chart = function(s) { function v(a, c, b) { a = A((a - c.graphMin) / (c.steps * c.stepValue), 1, 0); return b * c.steps * a } function x(a, c, b, e) { function h() { g += f; var k = a.animation ? A(d(g), null, 0) : 1; e.clearRect(0, 0, q, u); a.scaleOverlay ? (b(k), c()) : (c(), b(k)); if (1 >= g) D(h); else if ("function" == typeof a.onAnimationComplete) a.onAnimationComplete() } var f = a.animation ? 1 / A(a.animationSteps, Number.MAX_VALUE, 1) : 1 , d = B[a.animationEasing] , g = a.animation ? 0 : 1; "function" !== typeof c && (c = function() {} ); D(h) } function C(a, c, b, e, h, f) { var d; a = Math.floor(Math.log(e - h) / Math.LN10); h = Math.floor(h / (1 * Math.pow(10, a))) * Math.pow(10, a); e = Math.ceil(e / (1 * Math.pow(10, a))) * Math.pow(10, a) - h; a = Math.pow(10, a); for (d = Math.round(e / a); d < b || d > c; ) a = d < b ? a / 2 : 2 * a, d = Math.round(e / a); c = []; z(f, c, d, h, a); return { steps: d, stepValue: a, graphMin: h, labels: c } } function z(a, c, b, e, h) { if (a) for (var f = 1; f < b + 1; f++) c.push(E(a, { value: (e + h * f).toFixed(0 != h % 1 ? h.toString().split(".")[1].length : 0) })) } function A(a, c, b) { return !isNaN(parseFloat(c)) && isFinite(c) && a > c ? c : !isNaN(parseFloat(b)) && isFinite(b) && a < b ? b : a } function y(a, c) { var b = {}, e; for (e in a) b[e] = a[e]; for (e in c) b[e] = c[e]; return b } function E(a, c) { var b = !/\W/.test(a) ? F[a] = F[a] || E(document.getElementById(a).innerHTML) : new Function("obj","var p=[],print=function(){p.push.apply(p,arguments);};with(obj){p.push('" + a.replace(/[\r\t\n]/g, " ").split("<%").join("\t").replace(/((^|%>)[^\t]*)'/g, "$1\r").replace(/\t=(.*?)%>/g, "',$1,'").split("\t").join("');").split("%>").join("p.push('").split("\r").join("\\'") + "');}return p.join('');"); return c ? b(c) : b } var r = this , B = { linear: function(a) { return a }, easeInQuad: function(a) { return a * a }, easeOutQuad: function(a) { return -1 * a * (a - 2) }, easeInOutQuad: function(a) { return 1 > (a /= 0.5) ? 0.5 * a * a : -0.5 * (--a * (a - 2) - 1) }, easeInCubic: function(a) { return a * a * a }, easeOutCubic: function(a) { return 1 * ((a = a / 1 - 1) * a * a + 1) }, easeInOutCubic: function(a) { return 1 > (a /= 0.5) ? 0.5 * a * a * a : 0.5 * ((a -= 2) * a * a + 2) }, easeInQuart: function(a) { return a * a * a * a }, easeOutQuart: function(a) { return -1 * ((a = a / 1 - 1) * a * a * a - 1) }, easeInOutQuart: function(a) { return 1 > (a /= 0.5) ? 0.5 * a * a * a * a : -0.5 * ((a -= 2) * a * a * a - 2) }, easeInQuint: function(a) { return 1 * (a /= 1) * a * a * a * a }, easeOutQuint: function(a) { return 1 * ((a = a / 1 - 1) * a * a * a * a + 1) }, easeInOutQuint: function(a) { return 1 > (a /= 0.5) ? 0.5 * a * a * a * a * a : 0.5 * ((a -= 2) * a * a * a * a + 2) }, easeInSine: function(a) { return -1 * Math.cos(a / 1 * (Math.PI / 2)) + 1 }, easeOutSine: function(a) { return 1 * Math.sin(a / 1 * (Math.PI / 2)) }, easeInOutSine: function(a) { return -0.5 * (Math.cos(Math.PI * a / 1) - 1) }, easeInExpo: function(a) { return 0 == a ? 1 : 1 * Math.pow(2, 10 * (a / 1 - 1)) }, easeOutExpo: function(a) { return 1 == a ? 1 : 1 * (-Math.pow(2, -10 * a / 1) + 1) }, easeInOutExpo: function(a) { return 0 == a ? 0 : 1 == a ? 1 : 1 > (a /= 0.5) ? 0.5 * Math.pow(2, 10 * (a - 1)) : 0.5 * (-Math.pow(2, -10 * --a) + 2) }, easeInCirc: function(a) { return 1 <= a ? a : -1 * (Math.sqrt(1 - (a /= 1) * a) - 1) }, easeOutCirc: function(a) { return 1 * Math.sqrt(1 - (a = a / 1 - 1) * a) }, easeInOutCirc: function(a) { return 1 > (a /= 0.5) ? -0.5 * (Math.sqrt(1 - a * a) - 1) : 0.5 * (Math.sqrt(1 - (a -= 2) * a) + 1) }, easeInElastic: function(a) { var c = 1.70158 , b = 0 , e = 1; if (0 == a) return 0; if (1 == (a /= 1)) return 1; b || (b = 0.3); e < Math.abs(1) ? (e = 1, c = b / 4) : c = b / (2 * Math.PI) * Math.asin(1 / e); return -(e * Math.pow(2, 10 * (a -= 1)) * Math.sin((1 * a - c) * 2 * Math.PI / b)) }, easeOutElastic: function(a) { var c = 1.70158 , b = 0 , e = 1; if (0 == a) return 0; if (1 == (a /= 1)) return 1; b || (b = 0.3); e < Math.abs(1) ? (e = 1, c = b / 4) : c = b / (2 * Math.PI) * Math.asin(1 / e); return e * Math.pow(2, -10 * a) * Math.sin((1 * a - c) * 2 * Math.PI / b) + 1 }, easeInOutElastic: function(a) { var c = 1.70158 , b = 0 , e = 1; if (0 == a) return 0; if (2 == (a /= 0.5)) return 1; b || (b = 1 * 0.3 * 1.5); e < Math.abs(1) ? (e = 1, c = b / 4) : c = b / (2 * Math.PI) * Math.asin(1 / e); return 1 > a ? -0.5 * e * Math.pow(2, 10 * (a -= 1)) * Math.sin((1 * a - c) * 2 * Math.PI / b) : 0.5 * e * Math.pow(2, -10 * (a -= 1)) * Math.sin((1 * a - c) * 2 * Math.PI / b) + 1 }, easeInBack: function(a) { return 1 * (a /= 1) * a * (2.70158 * a - 1.70158) }, easeOutBack: function(a) { return 1 * ((a = a / 1 - 1) * a * (2.70158 * a + 1.70158) + 1) }, easeInOutBack: function(a) { var c = 1.70158; return 1 > (a /= 0.5) ? 0.5 * a * a * (((c *= 1.525) + 1) * a - c) : 0.5 * ((a -= 2) * a * (((c *= 1.525) + 1) * a + c) + 2) }, easeInBounce: function(a) { return 1 - B.easeOutBounce(1 - a) }, easeOutBounce: function(a) { return (a /= 1) < 1 / 2.75 ? 1 * 7.5625 * a * a : a < 2 / 2.75 ? 1 * (7.5625 * (a -= 1.5 / 2.75) * a + 0.75) : a < 2.5 / 2.75 ? 1 * (7.5625 * (a -= 2.25 / 2.75) * a + 0.9375) : 1 * (7.5625 * (a -= 2.625 / 2.75) * a + 0.984375) }, easeInOutBounce: function(a) { return 0.5 > a ? 0.5 * B.easeInBounce(2 * a) : 0.5 * B.easeOutBounce(2 * a - 1) + 0.5 } } , q = s.canvas.width , u = s.canvas.height; window.devicePixelRatio && (s.canvas.style.width = q + "px", s.canvas.style.height = u + "px", s.canvas.height = u * window.devicePixelRatio, s.canvas.width = q * window.devicePixelRatio, s.scale(window.devicePixelRatio, window.devicePixelRatio)); this.PolarArea = function(a, c) { r.PolarArea.defaults = { scaleOverlay: !0, scaleOverride: !1, scaleSteps: null, scaleStepWidth: null, scaleStartValue: null, scaleShowLine: !0, scaleLineColor: "rgba(0,0,0,.1)", scaleLineWidth: 1, scaleShowLabels: !0, scaleLabel: "<%=value%>", scaleFontFamily: "'Arial'", scaleFontSize: 12, scaleFontStyle: "normal", scaleFontColor: "#666", scaleShowLabelBackdrop: !0, scaleBackdropColor: "rgba(255,255,255,0.75)", scaleBackdropPaddingY: 2, scaleBackdropPaddingX: 2, segmentShowStroke: !0, segmentStrokeColor: "#fff", segmentStrokeWidth: 2, animation: !0, animationSteps: 100, animationEasing: "easeOutBounce", animateRotate: !0, animateScale: !1, onAnimationComplete: null }; var b = c ? y(r.PolarArea.defaults, c) : r.PolarArea.defaults; return new G(a,b,s) } ; this.Radar = function(a, c) { r.Radar.defaults = { scaleOverlay: !1, scaleOverride: !1, scaleSteps: null, scaleStepWidth: null, scaleStartValue: null, scaleShowLine: !0, scaleLineColor: "rgba(0,0,0,.1)", scaleLineWidth: 1, scaleShowLabels: !1, scaleLabel: "<%=value%>", scaleFontFamily: "'Arial'", scaleFontSize: 12, scaleFontStyle: "normal", scaleFontColor: "#666", scaleShowLabelBackdrop: !0, scaleBackdropColor: "rgba(255,255,255,0.75)", scaleBackdropPaddingY: 2, scaleBackdropPaddingX: 2, angleShowLineOut: !0, angleLineColor: "rgba(0,0,0,.1)", angleLineWidth: 1, pointLabelFontFamily: "'Arial'", pointLabelFontStyle: "normal", pointLabelFontSize: 12, pointLabelFontColor: "#666", pointDot: !0, pointDotRadius: 3, pointDotStrokeWidth: 1, datasetStroke: !0, datasetStrokeWidth: 2, datasetFill: !0, animation: !0, animationSteps: 60, animationEasing: "easeOutQuart", onAnimationComplete: null }; var b = c ? y(r.Radar.defaults, c) : r.Radar.defaults; return new H(a,b,s) } ; this.Pie = function(a, c) { r.Pie.defaults = { segmentShowStroke: !0, segmentStrokeColor: "#fff", segmentStrokeWidth: 2, animation: !0, animationSteps: 100, animationEasing: "easeOutBounce", animateRotate: !0, animateScale: !1, onAnimationComplete: null }; var b = c ? y(r.Pie.defaults, c) : r.Pie.defaults; return new I(a,b,s) } ; this.Doughnut = function(a, c) { r.Doughnut.defaults = { segmentShowStroke: !0, segmentStrokeColor: "#fff", segmentStrokeWidth: 2, percentageInnerCutout: 50, animation: !0, animationSteps: 100, animationEasing: "easeOutBounce", animateRotate: !0, animateScale: !1, onAnimationComplete: null }; var b = c ? y(r.Doughnut.defaults, c) : r.Doughnut.defaults; return new J(a,b,s) } ; this.Line = function(a, c) { r.Line.defaults = { scaleOverlay: !1, scaleOverride: !1, scaleSteps: null, scaleStepWidth: null, scaleStartValue: null, scaleLineColor: "rgba(0,0,0,.1)", scaleLineWidth: 1, scaleShowLabels: !0, scaleLabel: "<%=value%>", scaleFontFamily: "'Arial'", scaleFontSize: 12, scaleFontStyle: "normal", scaleFontColor: "#666", scaleShowGridLines: !0, scaleGridLineColor: "rgba(0,0,0,.05)", scaleGridLineWidth: 1, bezierCurve: !0, pointDot: !0, pointDotRadius: 4, pointDotStrokeWidth: 2, datasetStroke: !0, datasetStrokeWidth: 2, datasetFill: !0, animation: !0, animationSteps: 60, animationEasing: "easeOutQuart", onAnimationComplete: null }; var b = c ? y(r.Line.defaults, c) : r.Line.defaults; return new K(a,b,s) } ; this.Bar = function(a, c) { r.Bar.defaults = { scaleOverlay: !1, scaleOverride: !1, scaleSteps: null, scaleStepWidth: null, scaleStartValue: null, scaleLineColor: "rgba(0,0,0,.1)", scaleLineWidth: 1, scaleShowLabels: !0, scaleLabel: "<%=value%>", scaleFontFamily: "'Arial'", scaleFontSize: 12, scaleFontStyle: "normal", scaleFontColor: "#666", scaleShowGridLines: !0, scaleGridLineColor: "rgba(0,0,0,.05)", scaleGridLineWidth: 1, barShowStroke: !0, barStrokeWidth: 2, barValueSpacing: 5, barDatasetSpacing: 1, animation: !0, animationSteps: 60, animationEasing: "easeOutQuart", onAnimationComplete: null }; var b = c ? y(r.Bar.defaults, c) : r.Bar.defaults; return new L(a,b,s) } ; var G = function(a, c, b) { var e, h, f, d, g, k, j, l, m; g = Math.min.apply(Math, [q, u]) / 2; g -= Math.max.apply(Math, [0.5 * c.scaleFontSize, 0.5 * c.scaleLineWidth]); d = 2 * c.scaleFontSize; c.scaleShowLabelBackdrop && (d += 2 * c.scaleBackdropPaddingY, g -= 1.5 * c.scaleBackdropPaddingY); l = g; d = d ? d : 5; e = Number.MIN_VALUE; h = Number.MAX_VALUE; for (f = 0; f < a.length; f++) a[f].value > e && (e = a[f].value), a[f].value < h && (h = a[f].value); f = Math.floor(l / (0.66 * d)); d = Math.floor(0.5 * (l / d)); m = c.scaleShowLabels ? c.scaleLabel : null; c.scaleOverride ? (j = { steps: c.scaleSteps, stepValue: c.scaleStepWidth, graphMin: c.scaleStartValue, labels: [] }, z(m, j.labels, j.steps, c.scaleStartValue, c.scaleStepWidth)) : j = C(l, f, d, e, h, m); k = g / j.steps; x(c, function() { for (var a = 0; a < j.steps; a++) if (c.scaleShowLine && (b.beginPath(), b.arc(q / 2, u / 2, k * (a + 1), 0, 2 * Math.PI, !0), b.strokeStyle = c.scaleLineColor, b.lineWidth = c.scaleLineWidth, b.stroke()), c.scaleShowLabels) { b.textAlign = "center"; b.font = c.scaleFontStyle + " " + c.scaleFontSize + "px " + c.scaleFontFamily; var e = j.labels[a]; if (c.scaleShowLabelBackdrop) { var d = b.measureText(e).width; b.fillStyle = c.scaleBackdropColor; b.beginPath(); b.rect(Math.round(q / 2 - d / 2 - c.scaleBackdropPaddingX), Math.round(u / 2 - k * (a + 1) - 0.5 * c.scaleFontSize - c.scaleBackdropPaddingY), Math.round(d + 2 * c.scaleBackdropPaddingX), Math.round(c.scaleFontSize + 2 * c.scaleBackdropPaddingY)); b.fill() } b.textBaseline = "middle"; b.fillStyle = c.scaleFontColor; b.fillText(e, q / 2, u / 2 - k * (a + 1)) } }, function(e) { var d = -Math.PI / 2 , g = 2 * Math.PI / a.length , f = 1 , h = 1; c.animation && (c.animateScale && (f = e), c.animateRotate && (h = e)); for (e = 0; e < a.length; e++) b.beginPath(), b.arc(q / 2, u / 2, f * v(a[e].value, j, k), d, d + h * g, !1), b.lineTo(q / 2, u / 2), b.closePath(), b.fillStyle = a[e].color, b.fill(), c.segmentShowStroke && (b.strokeStyle = c.segmentStrokeColor, b.lineWidth = c.segmentStrokeWidth, b.stroke()), d += h * g }, b) } , H = function(a, c, b) { var e, h, f, d, g, k, j, l, m; a.labels || (a.labels = []); g = Math.min.apply(Math, [q, u]) / 2; d = 2 * c.scaleFontSize; for (e = l = 0; e < a.labels.length; e++) b.font = c.pointLabelFontStyle + " " + c.pointLabelFontSize + "px " + c.pointLabelFontFamily, h = b.measureText(a.labels[e]).width, h > l && (l = h); g -= Math.max.apply(Math, [l, 1.5 * (c.pointLabelFontSize / 2)]); g -= c.pointLabelFontSize; l = g = A(g, null, 0); d = d ? d : 5; e = Number.MIN_VALUE; h = Number.MAX_VALUE; for (f = 0; f < a.datasets.length; f++) for (m = 0; m < a.datasets[f].data.length; m++) a.datasets[f].data[m] > e && (e = a.datasets[f].data[m]), a.datasets[f].data[m] < h && (h = a.datasets[f].data[m]); f = Math.floor(l / (0.66 * d)); d = Math.floor(0.5 * (l / d)); m = c.scaleShowLabels ? c.scaleLabel : null; c.scaleOverride ? (j = { steps: c.scaleSteps, stepValue: c.scaleStepWidth, graphMin: c.scaleStartValue, labels: [] }, z(m, j.labels, j.steps, c.scaleStartValue, c.scaleStepWidth)) : j = C(l, f, d, e, h, m); k = g / j.steps; x(c, function() { var e = 2 * Math.PI / a.datasets[0].data.length; b.save(); b.translate(q / 2, u / 2); if (c.angleShowLineOut) { b.strokeStyle = c.angleLineColor; b.lineWidth = c.angleLineWidth; for (var d = 0; d < a.datasets[0].data.length; d++) b.rotate(e), b.beginPath(), b.moveTo(0, 0), b.lineTo(0, -g), b.stroke() } for (d = 0; d < j.steps; d++) { b.beginPath(); if (c.scaleShowLine) { b.strokeStyle = c.scaleLineColor; b.lineWidth = c.scaleLineWidth; b.moveTo(0, -k * (d + 1)); for (var f = 0; f < a.datasets[0].data.length; f++) b.rotate(e), b.lineTo(0, -k * (d + 1)); b.closePath(); b.stroke() } c.scaleShowLabels && (b.textAlign = "center", b.font = c.scaleFontStyle + " " + c.scaleFontSize + "px " + c.scaleFontFamily, b.textBaseline = "middle", c.scaleShowLabelBackdrop && (f = b.measureText(j.labels[d]).width, b.fillStyle = c.scaleBackdropColor, b.beginPath(), b.rect(Math.round(-f / 2 - c.scaleBackdropPaddingX), Math.round(-k * (d + 1) - 0.5 * c.scaleFontSize - c.scaleBackdropPaddingY), Math.round(f + 2 * c.scaleBackdropPaddingX), Math.round(c.scaleFontSize + 2 * c.scaleBackdropPaddingY)), b.fill()), b.fillStyle = c.scaleFontColor, b.fillText(j.labels[d], 0, -k * (d + 1))) } for (d = 0; d < a.labels.length; d++) { b.font = c.pointLabelFontStyle + " " + c.pointLabelFontSize + "px " + c.pointLabelFontFamily; b.fillStyle = c.pointLabelFontColor; var f = Math.sin(e * d) * (g + c.pointLabelFontSize) , h = Math.cos(e * d) * (g + c.pointLabelFontSize); b.textAlign = e * d == Math.PI || 0 == e * d ? "center" : e * d > Math.PI ? "right" : "left"; b.textBaseline = "middle"; b.fillText(a.labels[d], f, -h) } b.restore() }, function(d) { var e = 2 * Math.PI / a.datasets[0].data.length; b.save(); b.translate(q / 2, u / 2); for (var g = 0; g < a.datasets.length; g++) { b.beginPath(); b.moveTo(0, d * -1 * v(a.datasets[g].data[0], j, k)); for (var f = 1; f < a.datasets[g].data.length; f++) b.rotate(e), b.lineTo(0, d * -1 * v(a.datasets[g].data[f], j, k)); b.closePath(); b.fillStyle = a.datasets[g].fillColor; b.strokeStyle = a.datasets[g].strokeColor; b.lineWidth = c.datasetStrokeWidth; b.fill(); b.stroke(); if (c.pointDot) { b.fillStyle = a.datasets[g].pointColor; b.strokeStyle = a.datasets[g].pointStrokeColor; b.lineWidth = c.pointDotStrokeWidth; for (f = 0; f < a.datasets[g].data.length; f++) b.rotate(e), b.beginPath(), b.arc(0, d * -1 * v(a.datasets[g].data[f], j, k), c.pointDotRadius, 2 * Math.PI, !1), b.fill(), b.stroke() } b.rotate(e) } b.restore() }, b) } , I = function(a, c, b) { for (var e = 0, h = Math.min.apply(Math, [u / 2, q / 2]) - 5, f = 0; f < a.length; f++) e += a[f].value; x(c, null, function(d) { var g = -Math.PI / 2 , f = 1 , j = 1; c.animation && (c.animateScale && (f = d), c.animateRotate && (j = d)); for (d = 0; d < a.length; d++) { var l = j * a[d].value / e * 2 * Math.PI; b.beginPath(); b.arc(q / 2, u / 2, f * h, g, g + l); b.lineTo(q / 2, u / 2); b.closePath(); b.fillStyle = a[d].color; b.fill(); c.segmentShowStroke && (b.lineWidth = c.segmentStrokeWidth, b.strokeStyle = c.segmentStrokeColor, b.stroke()); g += l } }, b) } , J = function(a, c, b) { for (var e = 0, h = Math.min.apply(Math, [u / 2, q / 2]) - 5, f = h * (c.percentageInnerCutout / 100), d = 0; d < a.length; d++) e += a[d].value; x(c, null, function(d) { var k = -Math.PI / 2 , j = 1 , l = 1; c.animation && (c.animateScale && (j = d), c.animateRotate && (l = d)); for (d = 0; d < a.length; d++) { var m = l * a[d].value / e * 2 * Math.PI; b.beginPath(); b.arc(q / 2, u / 2, j * h, k, k + m, !1); b.arc(q / 2, u / 2, j * f, k + m, k, !0); b.closePath(); b.fillStyle = a[d].color; b.fill(); c.segmentShowStroke && (b.lineWidth = c.segmentStrokeWidth, b.strokeStyle = c.segmentStrokeColor, b.stroke()); k += m } }, b) } , K = function(a, c, b) { var e, h, f, d, g, k, j, l, m, t, r, n, p, s = 0; g = u; b.font = c.scaleFontStyle + " " + c.scaleFontSize + "px " + c.scaleFontFamily; t = 1; for (d = 0; d < a.labels.length; d++) e = b.measureText(a.labels[d]).width, t = e > t ? e : t; q / a.labels.length < t ? (s = 45, q / a.labels.length < Math.cos(s) * t ? (s = 90, g -= t) : g -= Math.sin(s) * t) : g -= c.scaleFontSize; d = c.scaleFontSize; g = g - 5 - d; e = Number.MIN_VALUE; h = Number.MAX_VALUE; for (f = 0; f < a.datasets.length; f++) for (l = 0; l < a.datasets[f].data.length; l++) a.datasets[f].data[l] > e && (e = a.datasets[f].data[l]), a.datasets[f].data[l] < h && (h = a.datasets[f].data[l]); f = Math.floor(g / (0.66 * d)); d = Math.floor(0.5 * (g / d)); l = c.scaleShowLabels ? c.scaleLabel : ""; c.scaleOverride ? (j = { steps: c.scaleSteps, stepValue: c.scaleStepWidth, graphMin: c.scaleStartValue, labels: [] }, z(l, j.labels, j.steps, c.scaleStartValue, c.scaleStepWidth)) : j = C(g, f, d, e, h, l); k = Math.floor(g / j.steps); d = 1; if (c.scaleShowLabels) { b.font = c.scaleFontStyle + " " + c.scaleFontSize + "px " + c.scaleFontFamily; for (e = 0; e < j.labels.length; e++) h = b.measureText(j.labels[e]).width, d = h > d ? h : d; d += 10 } r = q - d - t; m = Math.floor(r / (a.labels.length - 1)); n = q - t / 2 - r; p = g + c.scaleFontSize / 2; x(c, function() { b.lineWidth = c.scaleLineWidth; b.strokeStyle = c.scaleLineColor; b.beginPath(); b.moveTo(q - t / 2 + 5, p); b.lineTo(q - t / 2 - r - 5, p); b.stroke(); 0 < s ? (b.save(), b.textAlign = "right") : b.textAlign = "center"; b.fillStyle = c.scaleFontColor; for (var d = 0; d < a.labels.length; d++) b.save(), 0 < s ? (b.translate(n + d * m, p + c.scaleFontSize), b.rotate(-(s * (Math.PI / 180))), b.fillText(a.labels[d], 0, 0), b.restore()) : b.fillText(a.labels[d], n + d * m, p + c.scaleFontSize + 3), b.beginPath(), b.moveTo(n + d * m, p + 3), c.scaleShowGridLines && 0 < d ? (b.lineWidth = c.scaleGridLineWidth, b.strokeStyle = c.scaleGridLineColor, b.lineTo(n + d * m, 5)) : b.lineTo(n + d * m, p + 3), b.stroke(); b.lineWidth = c.scaleLineWidth; b.strokeStyle = c.scaleLineColor; b.beginPath(); b.moveTo(n, p + 5); b.lineTo(n, 5); b.stroke(); b.textAlign = "right"; b.textBaseline = "middle"; for (d = 0; d < j.steps; d++) b.beginPath(), b.moveTo(n - 3, p - (d + 1) * k), c.scaleShowGridLines ? (b.lineWidth = c.scaleGridLineWidth, b.strokeStyle = c.scaleGridLineColor, b.lineTo(n + r + 5, p - (d + 1) * k)) : b.lineTo(n - 0.5, p - (d + 1) * k), b.stroke(), c.scaleShowLabels && b.fillText(j.labels[d], n - 8, p - (d + 1) * k) }, function(d) { function e(b, c) { return p - d * v(a.datasets[b].data[c], j, k) } for (var f = 0; f < a.datasets.length; f++) { b.strokeStyle = a.datasets[f].strokeColor; b.lineWidth = c.datasetStrokeWidth; b.beginPath(); b.moveTo(n, p - d * v(a.datasets[f].data[0], j, k)); for (var g = 1; g < a.datasets[f].data.length; g++) c.bezierCurve ? b.bezierCurveTo(n + m * (g - 0.5), e(f, g - 1), n + m * (g - 0.5), e(f, g), n + m * g, e(f, g)) : b.lineTo(n + m * g, e(f, g)); b.stroke(); c.datasetFill ? (b.lineTo(n + m * (a.datasets[f].data.length - 1), p), b.lineTo(n, p), b.closePath(), b.fillStyle = a.datasets[f].fillColor, b.fill()) : b.closePath(); if (c.pointDot) { b.fillStyle = a.datasets[f].pointColor; b.strokeStyle = a.datasets[f].pointStrokeColor; b.lineWidth = c.pointDotStrokeWidth; for (g = 0; g < a.datasets[f].data.length; g++) b.beginPath(), b.arc(n + m * g, p - d * v(a.datasets[f].data[g], j, k), c.pointDotRadius, 0, 2 * Math.PI, !0), b.fill(), b.stroke() } } }, b) } , L = function(a, c, b) { var e, h, f, d, g, k, j, l, m, t, r, n, p, s, w = 0; g = u; b.font = c.scaleFontStyle + " " + c.scaleFontSize + "px " + c.scaleFontFamily; t = 1; for (d = 0; d < a.labels.length; d++) e = b.measureText(a.labels[d]).width, t = e > t ? e : t; q / a.labels.length < t ? (w = 45, q / a.labels.length < Math.cos(w) * t ? (w = 90, g -= t) : g -= Math.sin(w) * t) : g -= c.scaleFontSize; d = c.scaleFontSize; g = g - 5 - d; e = Number.MIN_VALUE; h = Number.MAX_VALUE; for (f = 0; f < a.datasets.length; f++) for (l = 0; l < a.datasets[f].data.length; l++) a.datasets[f].data[l] > e && (e = a.datasets[f].data[l]), a.datasets[f].data[l] < h && (h = a.datasets[f].data[l]); f = Math.floor(g / (0.66 * d)); d = Math.floor(0.5 * (g / d)); l = c.scaleShowLabels ? c.scaleLabel : ""; c.scaleOverride ? (j = { steps: c.scaleSteps, stepValue: c.scaleStepWidth, graphMin: c.scaleStartValue, labels: [] }, z(l, j.labels, j.steps, c.scaleStartValue, c.scaleStepWidth)) : j = C(g, f, d, e, h, l); k = Math.floor(g / j.steps); d = 1; if (c.scaleShowLabels) { b.font = c.scaleFontStyle + " " + c.scaleFontSize + "px " + c.scaleFontFamily; for (e = 0; e < j.labels.length; e++) h = b.measureText(j.labels[e]).width, d = h > d ? h : d; d += 10 } r = q - d - t; m = Math.floor(r / a.labels.length); s = (m - 2 * c.scaleGridLineWidth - 2 * c.barValueSpacing - (c.barDatasetSpacing * a.datasets.length - 1) - (c.barStrokeWidth / 2 * a.datasets.length - 1)) / a.datasets.length; n = q - t / 2 - r; p = g + c.scaleFontSize / 2; x(c, function() { b.lineWidth = c.scaleLineWidth; b.strokeStyle = c.scaleLineColor; b.beginPath(); b.moveTo(q - t / 2 + 5, p); b.lineTo(q - t / 2 - r - 5, p); b.stroke(); 0 < w ? (b.save(), b.textAlign = "right") : b.textAlign = "center"; b.fillStyle = c.scaleFontColor; for (var d = 0; d < a.labels.length; d++) b.save(), 0 < w ? (b.translate(n + d * m, p + c.scaleFontSize), b.rotate(-(w * (Math.PI / 180))), b.fillText(a.labels[d], 0, 0), b.restore()) : b.fillText(a.labels[d], n + d * m + m / 2, p + c.scaleFontSize + 3), b.beginPath(), b.moveTo(n + (d + 1) * m, p + 3), b.lineWidth = c.scaleGridLineWidth, b.strokeStyle = c.scaleGridLineColor, b.lineTo(n + (d + 1) * m, 5), b.stroke(); b.lineWidth = c.scaleLineWidth; b.strokeStyle = c.scaleLineColor; b.beginPath(); b.moveTo(n, p + 5); b.lineTo(n, 5); b.stroke(); b.textAlign = "right"; b.textBaseline = "middle"; for (d = 0; d < j.steps; d++) b.beginPath(), b.moveTo(n - 3, p - (d + 1) * k), c.scaleShowGridLines ? (b.lineWidth = c.scaleGridLineWidth, b.strokeStyle = c.scaleGridLineColor, b.lineTo(n + r + 5, p - (d + 1) * k)) : b.lineTo(n - 0.5, p - (d + 1) * k), b.stroke(), c.scaleShowLabels && b.fillText(j.labels[d], n - 8, p - (d + 1) * k) }, function(d) { b.lineWidth = c.barStrokeWidth; for (var e = 0; e < a.datasets.length; e++) { b.fillStyle = a.datasets[e].fillColor; b.strokeStyle = a.datasets[e].strokeColor; for (var f = 0; f < a.datasets[e].data.length; f++) { var g = n + c.barValueSpacing + m * f + s * e + c.barDatasetSpacing * e + c.barStrokeWidth * e; b.beginPath(); b.moveTo(g, p); b.lineTo(g, p - d * v(a.datasets[e].data[f], j, k) + c.barStrokeWidth / 2); b.lineTo(g + s, p - d * v(a.datasets[e].data[f], j, k) + c.barStrokeWidth / 2); b.lineTo(g + s, p); c.barShowStroke && b.stroke(); b.closePath(); b.fill() } } }, b) } , D = window.requestAnimationFrame || window.webkitRequestAnimationFrame || window.mozRequestAnimationFrame || window.oRequestAnimationFrame || window.msRequestAnimationFrame || function(a) { window.setTimeout(a, 1E3 / 60) } , F = {} };Unter Network siehts so aus
@Aiouh sagte in Parser Adapter Refusol Inverter - der richtige Weg?:
js-script gen.measurements.table.js sieht wie folgt aus
wenn sich das von dem ioBroker Server so aufrufen ließe, könnte man wahrscheinlich die Werte auslesen.
Aber da ist @UncleSam der viel bessere Ansprechpartner
-
@Aiouh sagte in Parser Adapter Refusol Inverter - der richtige Weg?:
js-script gen.measurements.table.js sieht wie folgt aus
wenn sich das von dem ioBroker Server so aufrufen ließe, könnte man wahrscheinlich die Werte auslesen.
Aber da ist @UncleSam der viel bessere Ansprechpartner
-
@UncleSam
Darf ich Dich dazu kurz nochmal befragen ob ich hier eine Chance habe weiter zu kommen oder ob das eine Sackgasse ist ? Danke Dir@aiouh sagte in Parser Adapter Refusol Inverter - der richtige Weg?:
@UncleSam
Darf ich Dich dazu kurz nochmal befragen ob ich hier eine Chance habe weiter zu kommen oder ob das eine Sackgasse ist ? Danke DirJa klar.
@homoran sagte in Parser Adapter Refusol Inverter - der richtige Weg?:
Aber da ist @UncleSam der viel bessere Ansprechpartner
Vielen Dank für die

 ...
...Aber eigentlich hat es @Homoran schon geschrieben: du musst einfach die Datei
gen.measurements.table.jsparsen. Wenn du auf den Dateinamen klickst, kannst du sehen, wie die gesamte URL lautet (auf der rechten Seite steht zu oberst "General" > "Request URL"). Diese URL kannst du dann im Parser Adapter verwenden um die Werte rauszuparsen.Du hast ja jeweils drei Werte auf einer Zeile:
<tr><td>U DC</td><td align='right'> 221.75</td><td>V</td></tr>
Nach dem ersten musst du suchen, den zweiten verwenden und den dritten kannst du eigentlich ignorieren (da der eh fix ist).Für obiges Beispiel müsste also das funktionieren:
U DC.+?<td.+?>\s*([\d.]+)\s*<
Siehe hier: https://regex101.com/r/CAi1gr/1 -
@aiouh sagte in Parser Adapter Refusol Inverter - der richtige Weg?:
@UncleSam
Darf ich Dich dazu kurz nochmal befragen ob ich hier eine Chance habe weiter zu kommen oder ob das eine Sackgasse ist ? Danke DirJa klar.
@homoran sagte in Parser Adapter Refusol Inverter - der richtige Weg?:
Aber da ist @UncleSam der viel bessere Ansprechpartner
Vielen Dank für die
...Aber eigentlich hat es @Homoran schon geschrieben: du musst einfach die Datei
gen.measurements.table.jsparsen. Wenn du auf den Dateinamen klickst, kannst du sehen, wie die gesamte URL lautet (auf der rechten Seite steht zu oberst "General" > "Request URL"). Diese URL kannst du dann im Parser Adapter verwenden um die Werte rauszuparsen.Du hast ja jeweils drei Werte auf einer Zeile:
<tr><td>U DC</td><td align='right'> 221.75</td><td>V</td></tr>
Nach dem ersten musst du suchen, den zweiten verwenden und den dritten kannst du eigentlich ignorieren (da der eh fix ist).Für obiges Beispiel müsste also das funktionieren:
U DC.+?<td.+?>\s*([\d.]+)\s*<
Siehe hier: https://regex101.com/r/CAi1gr/1

Hey! Du scheinst an dieser Unterhaltung interessiert zu sein, hast aber noch kein Konto.
Hast du es satt, bei jedem Besuch durch die gleichen Beiträge zu scrollen? Wenn du dich für ein Konto anmeldest, kommst du immer genau dorthin zurück, wo du zuvor warst, und kannst dich über neue Antworten benachrichtigen lassen (entweder per E-Mail oder Push-Benachrichtigung). Du kannst auch Lesezeichen speichern und Beiträge positiv bewerten, um anderen Community-Mitgliedern deine Wertschätzung zu zeigen.
Mit deinem Input könnte dieser Beitrag noch besser werden 💗
Registrieren Anmelden445
Online32.9k
Benutzer83.0k
Themen1.3m
Beiträge