

Corona-Ampel Österreich in VIS anzeigen
-
@liv-in-sky sagte in Corona-Ampel Österreich in VIS anzeigen:
du nutzt das invento json widget für die anzeige?
Die json Tabelle von den ioBroker.vis-materialdesign.
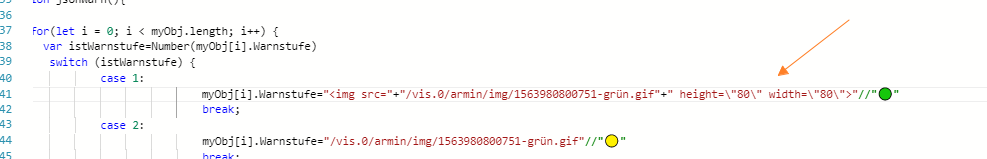
dann evtl im script damit arbeiten:
"<img src="+"/pfad/pfad"+" height=\"80\" width=\"80\">"nicht getestet:
-
@liv-in-sky sagte in Corona-Ampel Österreich in VIS anzeigen:
du nutzt das invento json widget für die anzeige?
Die json Tabelle von den ioBroker.vis-materialdesign.
@bergjet zur auswahl habe ich nur die - evtl eigene machen ?
nach einem gelösten Thread wäre es sinnvoll dies in der Überschrift des ersten Posts einzutragen [gelöst]-... Bitte benutzt das Voting rechts unten im Beitrag wenn er euch geholfen hat. Forum-Tools: PicPick https://picpick.app/en/download/ und ScreenToGif https://www.screentogif.com/downloads.html
-
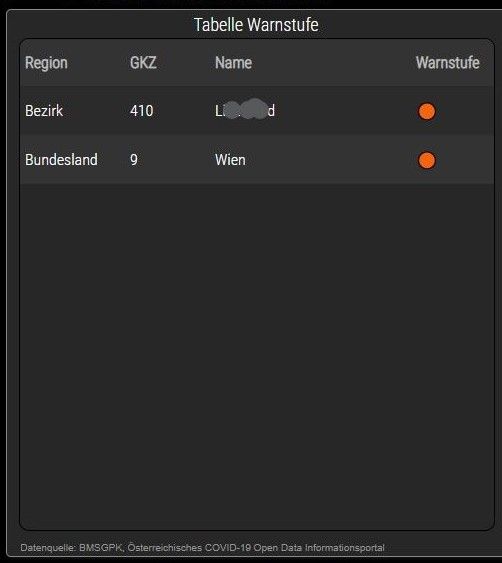
@bergjet zur auswahl habe ich nur die - evtl eigene machen ?
@liv-in-sky Danke, jetzt geht es mit der Skript-Änderung auf Image Dateien. Habe die invento Tabelle nun genommen.


-
@bergjet zur auswahl habe ich nur die - evtl eigene machen ?
Haben die wieder was geändert, es werden nur mehr Warn 3 angezeigt?
var zusatzRegionen=["1","2","3","4","5","6","7","8","9","410"]Bitte benutzt das Voting rechts unten im Beitrag wenn er euch geholfen hat.
Immer Daten sichern! -
Haben die wieder was geändert, es werden nur mehr Warn 3 angezeigt?
var zusatzRegionen=["1","2","3","4","5","6","7","8","9","410"]hast du mal die seiten von denen gecheckt (sind im script ganz oben)
was steht da drin für deine regionen
nach einem gelösten Thread wäre es sinnvoll dies in der Überschrift des ersten Posts einzutragen [gelöst]-... Bitte benutzt das Voting rechts unten im Beitrag wenn er euch geholfen hat. Forum-Tools: PicPick https://picpick.app/en/download/ und ScreenToGif https://www.screentogif.com/downloads.html
-
hast du mal die seiten von denen gecheckt (sind im script ganz oben)
was steht da drin für deine regionen
@liv-in-sky sagte in Corona-Ampel Österreich in VIS anzeigen:
hast du mal die seiten von denen gecheckt (sind im script ganz oben)
was steht da drin für deine regionen
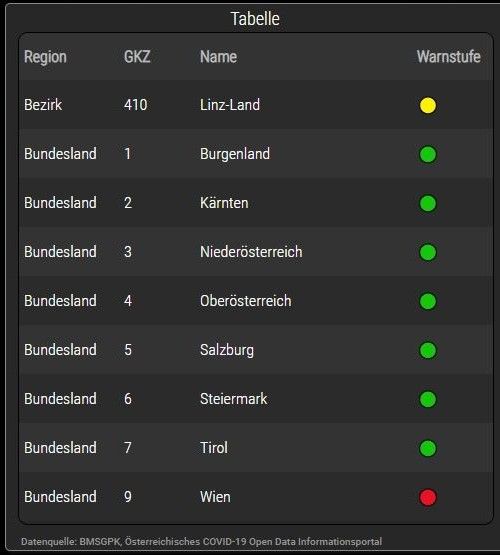
{
        "Region": "Bundesland",
        "GKZ": "1",
        "Name": "Burgenland",
        "Warnstufe": "1"
      },
      {
        "Region": "Bundesland",
        "GKZ": "2",
        "Name": "Kärnten",
        "Warnstufe": "1"
      },
      {
        "Region": "Bundesland",
        "GKZ": "3",
        "Name": "Niederösterreich",
        "Warnstufe": "1"
      },
      {
        "Region": "Bundesland",
        "GKZ": "4",
        "Name": "Oberösterreich",
        "Warnstufe": "1"
      },
      {
        "Region": "Bundesland",
        "GKZ": "5",
        "Name": "Salzburg",
        "Warnstufe": "1"
      },
      {
        "Region": "Bundesland",
        "GKZ": "6",
        "Name": "Steiermark",
        "Warnstufe": "1"
      },
      {
        "Region": "Bundesland",
        "GKZ": "7",
        "Name": "Tirol",
        "Warnstufe": "1"
      },
      {
        "Region": "Bundesland",
        "GKZ": "8",
        "Name": "Vorarlberg",
        "Warnstufe": "1"
      },
      {
        "Region": "Bundesland",
        "GKZ": "9",
        "Name": "Wien",
        "Warnstufe": "2"
      },
      {
        "Region": "Staat",
        "GKZ": "0",
        "Name": null,
        "Warnstufe": "1"
      }
Bitte benutzt das Voting rechts unten im Beitrag wenn er euch geholfen hat.
Immer Daten sichern! -
@liv-in-sky sagte in Corona-Ampel Österreich in VIS anzeigen:
hast du mal die seiten von denen gecheckt (sind im script ganz oben)
was steht da drin für deine regionen
{ "Region": "Bundesland", "GKZ": "1", "Name": "Burgenland", "Warnstufe": "1" }, { "Region": "Bundesland", "GKZ": "2", "Name": "Kärnten", "Warnstufe": "1" }, { "Region": "Bundesland", "GKZ": "3", "Name": "Niederösterreich", "Warnstufe": "1" }, { "Region": "Bundesland", "GKZ": "4", "Name": "Oberösterreich", "Warnstufe": "1" }, { "Region": "Bundesland", "GKZ": "5", "Name": "Salzburg", "Warnstufe": "1" }, { "Region": "Bundesland", "GKZ": "6", "Name": "Steiermark", "Warnstufe": "1" }, { "Region": "Bundesland", "GKZ": "7", "Name": "Tirol", "Warnstufe": "1" }, { "Region": "Bundesland", "GKZ": "8", "Name": "Vorarlberg", "Warnstufe": "1" }, { "Region": "Bundesland", "GKZ": "9", "Name": "Wien", "Warnstufe": "2" }, { "Region": "Staat", "GKZ": "0", "Name": null, "Warnstufe": "1" }@sigi234 sagte in Corona-Ampel Österreich in VIS anzeigen:
was steht da drin für deine regionen
Da geht es um die Zusatzregionen, hat vorher funktioniert, jetzt werden nur mehr 2 Regionen angezeigt obwohl mehr eingetragen sind. ( 9 und 410 gehen )
var zusatzRegionen=["1","2","3","4","5","6","7","8","9","410"]ALT
NEU
-
@sigi234 sagte in Corona-Ampel Österreich in VIS anzeigen:
was steht da drin für deine regionen
Da geht es um die Zusatzregionen, hat vorher funktioniert, jetzt werden nur mehr 2 Regionen angezeigt obwohl mehr eingetragen sind. ( 9 und 410 gehen )
var zusatzRegionen=["1","2","3","4","5","6","7","8","9","410"]ALT
NEU
-
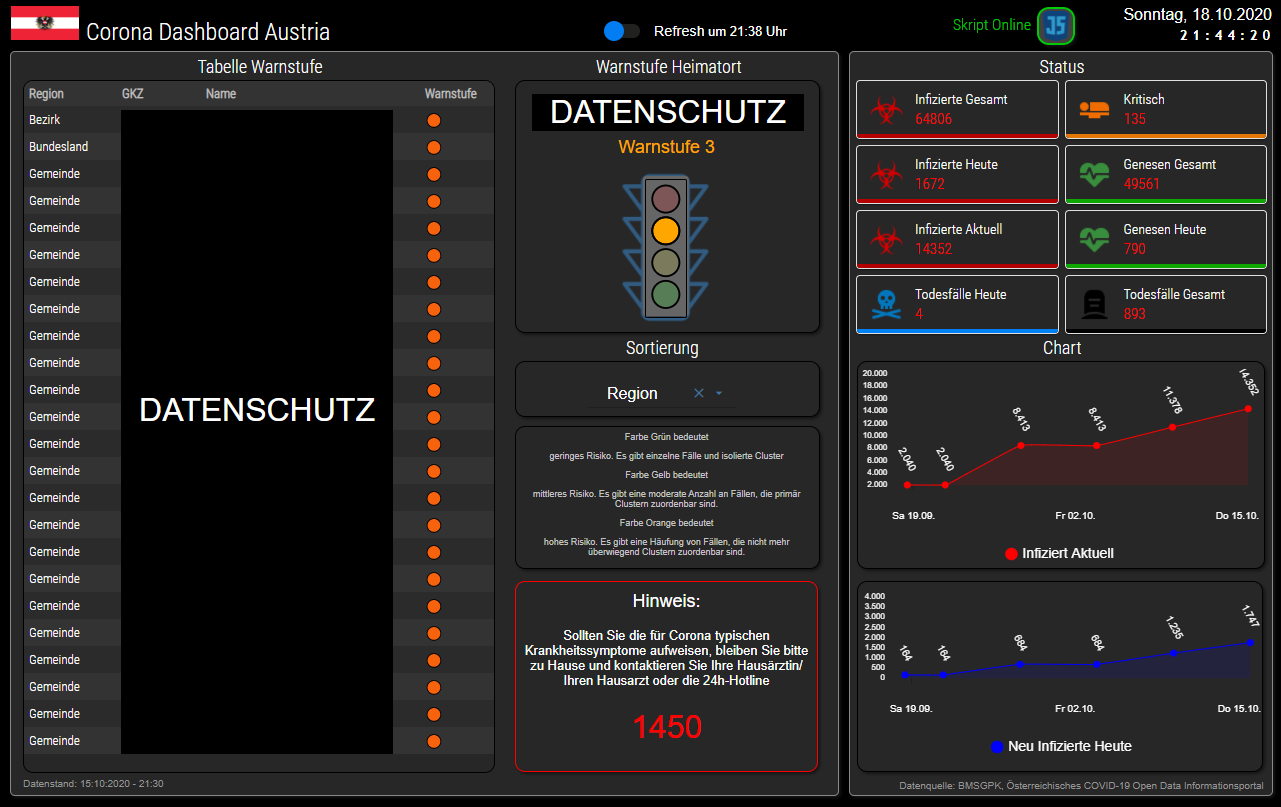
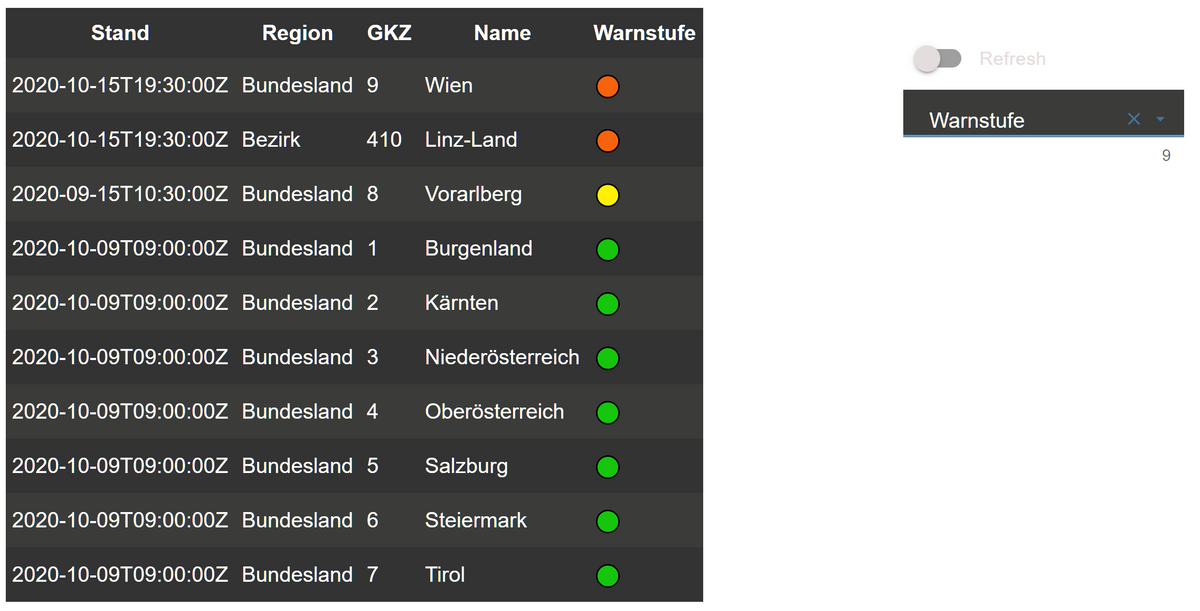
@sigi234 Das liegt daran, dass im neuesten Datensatz(15.10.) nur Wien gelistet ist als Bundesland
@fastfoot sagte in Corona-Ampel Österreich in VIS anzeigen:
nur Wien gelistet ist als Bundesland
Typisch Österreich.

Habe es angepasst:
-
@sigi234 Das liegt daran, dass im neuesten Datensatz(15.10.) nur Wien gelistet ist als Bundesland
danke @fastfoot
kann ich bestätigen - die fehlen darin
-
@fastfoot sagte in Corona-Ampel Österreich in VIS anzeigen:
nur Wien gelistet ist als Bundesland
Typisch Österreich.
Habe es angepasst:
@sigi234 sagte in Corona-Ampel Österreich in VIS anzeigen:
Typisch Österreich.
Habe es angepasst:Ich wollte mal etwas mit jsonata rumspielen, das schien mir sehr geeignet um das Problem mit fehlenden neueren Daten zu lösen. Mit jsonata filtere ich die Regionen und nehme vom Ergebnis den ersten(neuesten) Datensatz. Somit ist jetzt auch Vorarlberg wieder auf der Liste. Der Code ist einfach so reingesaut, war mir zuviel Arbeit das aufzuhübschen, am Gesamtergebnis ändert sich aber nichts außer die json-Tabelle. Wers brauchen kann :-)
-
@liv-in-sky
Die Daten werden nur Freitags aktualisiert, ein Cron mit Freitag 15:00 Uhr wäre ja dann ausreichend?Ev. ein DP um es Manuel aus zu lösen?
-
@G4l4h4d sagte in Corona-Ampel Österreich in VIS anzeigen:
Hallo Leute,
gibt es mittlerweile auch eine Deutschland Ampel?meines Wissens gibt es so etwas nicht, vielleicht interessiert dich aber folgende Lösung
-
@G4l4h4d sagte in Corona-Ampel Österreich in VIS anzeigen:
Hallo Leute,
gibt es mittlerweile auch eine Deutschland Ampel?meines Wissens gibt es so etwas nicht, vielleicht interessiert dich aber folgende Lösung
-
An die Spezialisten.
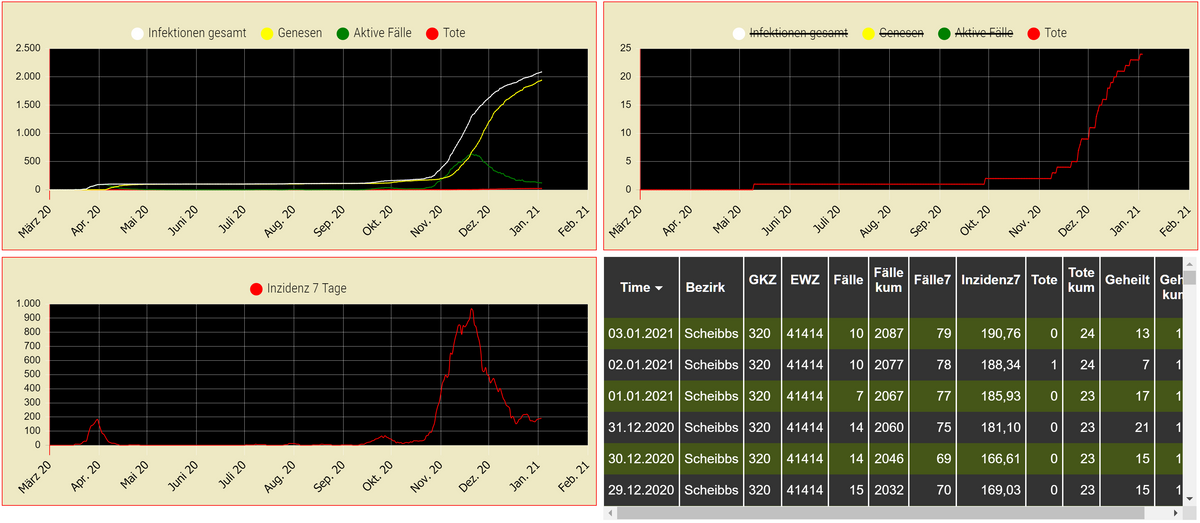
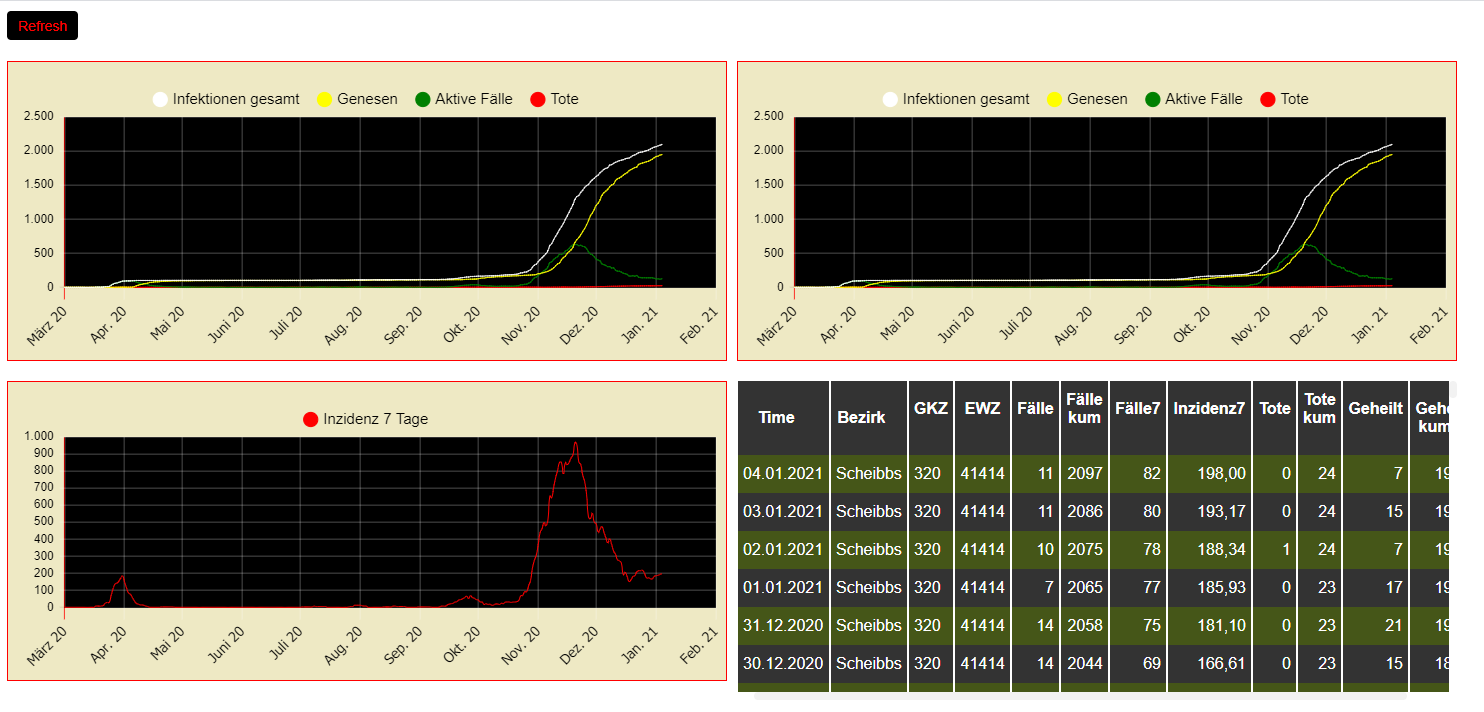
Es gibt eine neue Datei, in der die 7 Tage Inzidenz enthalten ist.
https://covid19-dashboard.ages.at/data/CovidFaelle_Timeline_GKZ.csvDiese wäre bei der Auswertung auch sehr interessant.
-
An die Spezialisten.
Es gibt eine neue Datei, in der die 7 Tage Inzidenz enthalten ist.
https://covid19-dashboard.ages.at/data/CovidFaelle_Timeline_GKZ.csvDiese wäre bei der Auswertung auch sehr interessant.
@bergjet sagte in Corona-Ampel Österreich in VIS anzeigen:
An die Spezialisten.
Es gibt eine neue Datei, in der die 7 Tage Inzidenz enthalten ist.
https://covid19-dashboard.ages.at/data/CovidFaelle_Timeline_GKZ.csvDiese wäre bei der Auswertung auch sehr interessant.
Ich hätte das hier, ist noch nicht ganz fertig und kann auch nur eine GKZ
iobroker läuft unter Docker auf Windows (WSL2)
-
@bergjet sagte in Corona-Ampel Österreich in VIS anzeigen:
An die Spezialisten.
Es gibt eine neue Datei, in der die 7 Tage Inzidenz enthalten ist.
https://covid19-dashboard.ages.at/data/CovidFaelle_Timeline_GKZ.csvDiese wäre bei der Auswertung auch sehr interessant.
Ich hätte das hier, ist noch nicht ganz fertig und kann auch nur eine GKZ
@fastfoot sagte in Corona-Ampel Österreich in VIS anzeigen:
Ich hätte das hier, ist noch nicht ganz fertig und kann auch nur eine GKZ
Na das wäre ja was. Bei dem Script müsste ich ja gar nichts ändern, ist doch meine GKZ schon eingetragen.
Wärst du so nett, mir das zukommen zu lassen und auch noch dazu erklären was zu machen ist, damit das auch bei mir funktioniert? -
@fastfoot sagte in Corona-Ampel Österreich in VIS anzeigen:
Ich hätte das hier, ist noch nicht ganz fertig und kann auch nur eine GKZ
Na das wäre ja was. Bei dem Script müsste ich ja gar nichts ändern, ist doch meine GKZ schon eingetragen.
Wärst du so nett, mir das zukommen zu lassen und auch noch dazu erklären was zu machen ist, damit das auch bei mir funktioniert?@bergjet sagte in Corona-Ampel Österreich in VIS anzeigen:
Na das wäre ja was. Bei dem Script müsste ich ja gar nichts ändern, ist doch meine GKZ schon eingetragen.
Wärst du so nett, mir das zukommen zu lassen und auch noch dazu erklären was zu machen ist, damit das auch bei mir funktioniert?Du musst dazu
- axios in der JS-Instanz eintragen
- csvjson in der JS-Instanz eintragen
- für die JSON Tabelle(unten rechts) musst du den inventwo Widget Adapter installieren
- für die Charts musst du den Material-Design-Widgets Adapter installieren
- die Datenpunkte werden automatisch erstellt, sollte der Ort (variable idBase) geändert werden, muss dies natürlich auch in der View geändert werden
- Im Skript oben unter Persönliche Einstellungen kannst du eine andere GKZ und die tgl. Updatezeit einstellen
bei Fragen, fragen...
iobroker läuft unter Docker auf Windows (WSL2)
-
@bergjet sagte in Corona-Ampel Österreich in VIS anzeigen:
Na das wäre ja was. Bei dem Script müsste ich ja gar nichts ändern, ist doch meine GKZ schon eingetragen.
Wärst du so nett, mir das zukommen zu lassen und auch noch dazu erklären was zu machen ist, damit das auch bei mir funktioniert?Du musst dazu
- axios in der JS-Instanz eintragen
- csvjson in der JS-Instanz eintragen
- für die JSON Tabelle(unten rechts) musst du den inventwo Widget Adapter installieren
- für die Charts musst du den Material-Design-Widgets Adapter installieren
- die Datenpunkte werden automatisch erstellt, sollte der Ort (variable idBase) geändert werden, muss dies natürlich auch in der View geändert werden
- Im Skript oben unter Persönliche Einstellungen kannst du eine andere GKZ und die tgl. Updatezeit einstellen
bei Fragen, fragen...
-
@sigi234 sagte in Corona-Ampel Österreich in VIS anzeigen:
Ist für Windows Systeme anders, bekomme noch Fehler.
Edit:
Wird schon. Danke.Musstest du am Skript etwas abändern, damit es funktioniert hat?
iobroker läuft unter Docker auf Windows (WSL2)


Hey! Du scheinst an dieser Unterhaltung interessiert zu sein, hast aber noch kein Konto.
Hast du es satt, bei jedem Besuch durch die gleichen Beiträge zu scrollen? Wenn du dich für ein Konto anmeldest, kommst du immer genau dorthin zurück, wo du zuvor warst, und kannst dich über neue Antworten benachrichtigen lassen (entweder per E-Mail oder Push-Benachrichtigung). Du kannst auch Lesezeichen speichern und Beiträge positiv bewerten, um anderen Community-Mitgliedern deine Wertschätzung zu zeigen.
Mit deinem Input könnte dieser Beitrag noch besser werden 💗
Registrieren Anmelden358
Online33.0k
Benutzer83.5k
Themen1.3m
Beiträge