

[Fehler] io.controller wird ständig neu gestartet
-
Guten Morgen
habe noch mal versucht der Ursache auf den Grund zu gehen. Leider ohne Erfolg.
:( Das System ist nicht mehr nutzbar :(
history-0	2015-03-20 05:55:35	warn	Reconnection to DB.
admin-0	2015-03-20 05:55:35	warn	Reconnection to DB.
sonos-0	2015-03-20 05:55:35	warn	Reconnection to DB.
history-0	2015-03-20 05:55:35	warn	Reconnection to DB.
ping-0	2015-03-20 05:55:35	warn	Reconnection to DB.
web-0	2015-03-20 05:55:35	warn	Reconnection to DB.
javascript-0	2015-03-20 05:55:35	warn	Reconnection to DB.
sayit-0	2015-03-20 05:55:34	warn	Reconnection to DB.
ping-0	2015-03-20 05:55:34	warn	Reconnection to DB.
sayit-0	2015-03-20 05:55:34	warn	Reconnection to DB.
sonos-0	2015-03-20 05:55:34	warn	Reconnection to DB.
sayit-0	2015-03-20 05:55:34	warn	Reconnection to DB.
ping-0	2015-03-20 05:55:34	warn	Reconnection to DB.
history-0	2015-03-20 05:55:34	warn	Reconnection to DB.
admin-0	2015-03-20 05:55:34	warn	Reconnection to DB.
sonos-0	2015-03-20 05:55:34	warn	Reconnection to DB.
web-0	2015-03-20 05:55:34	warn	Reconnection to DB.
ping-0	2015-03-20 05:55:34	warn	Reconnection to DB.
history-0	2015-03-20 05:55:34	warn	Reconnection to DB.
javascript-0	2015-03-20 05:55:34	warn	Reconnection to DB.
sayit-0	2015-03-20 05:55:34	warn	Reconnection to DB.
ping-0	2015-03-20 05:55:34	warn	Reconnection to DB.
sayit-0	2015-03-20 05:55:34	warn	Reconnection to DB.
sonos-0	2015-03-20 05:55:34	warn	Reconnection to DB.
sayit-0	2015-03-20 05:55:34	warn	Reconnection to DB.
ping-0	2015-03-20 05:55:34	warn	Reconnection to DB.
host-pi2	2015-03-20 05:55:32	info	starting 14 instances
host-pi2	2015-03-20 05:55:32	info	17 instances found
host-pi2	2015-03-20 05:55:32	info	InMemoryDB connected
inMem-objects	2015-03-20 05:55:32	info	listening on port 9001
inMem-states	2015-03-20 05:55:32	info	listening on port 9000
host-pi2	2015-03-20 05:55:31	info	ip addresses: 192.168.28.77
host-pi2	2015-03-20 05:55:31	info	hostname: pi2
host-pi2	2015-03-20 05:55:31	info	Copyright (c) 2014 bluefox, hobbyquaker
host-pi2	2015-03-20 05:55:31	info	ioBroker.js-controller version 0.5.15 js-controller starting
	2015-03-20 05:55:31	info	info
host-pi2	2015-03-20 05:55:27	info	force terminating
host-pi2	2015-03-20 05:55:27	info	received SIGTERM
host-pi2	2015-03-20 05:55:27	info	force terminating
host-pi2	2015-03-20 05:55:27	info	received SIGTERM
host-pi2	2015-03-20 05:55:26	info	force terminated after 10s
host-pi2	2015-03-20 05:55:25	info	received SIGTERM
host-pi2	2015-03-20 05:55:24	info	received SIGTERM
host-pi2	2015-03-20 05:55:23	info	received SIGTERM
host-pi2	2015-03-20 05:55:22	info	received SIGTERM
host-pi2	2015-03-20 05:55:21	info	received SIGTERM
host-pi2	2015-03-20 05:55:21	info	instance system.adapter.yr.0 terminated with code 0 (OK)
host-pi2	2015-03-20 05:55:21	info	instance system.adapter.admin.0 terminated with code 7 (Adapter already running)
admin-0	2015-03-20 05:55:21	error	already running
host-pi2	2015-03-20 05:55:21	info	received SIGTERM
	2015-03-20 05:55:19	info	info
host-pi2	2015-03-20 05:55:19	info	received SIGTERM
host-pi2	2015-03-20 05:55:18	info	received SIGTERM
host-pi2	2015-03-20 05:55:17	info	received SIGTERM
iobroker	2015-03-20 05:55:17	info	exit 0
iobroker	2015-03-20 05:55:17	info	Starting node restart.js
yr-0	2015-03-20 05:55:16	info	got weather data from yr.no
iobroker	2015-03-20 05:55:16	info	_restart
TypeError:	2015-03-20 05:55:16	error	at Timer.listOnTimeout [as ontimeout] (timers.js:112:15)
TypeError:	2015-03-20 05:55:16	error	at timer._onTimeout (timers.js:219:16)
TypeError:	2015-03-20 05:55:16	error	at null. (/mnt/ioBroker/iobroker.Pi2/node_modules/iobroker.js-controller/controller.js:831:17)
TypeError:	2015-03-20 05:55:16	error	at startInstance (/mnt/ioBroker/iobroker.Pi2/node_modules/iobroker.js-controller/controller.js:913:88)
TypeError:	2015-03-20 05:55:16	error	Cannot read property '0' of undefined
uncaught	2015-03-20 05:55:16	error	exception: Cannot read property '0' of undefined
yr-0	2015-03-20 05:55:15	info	starting. Version 0.1.2 in /mnt/ioBroker/iobroker.Pi2/node_modules/iobroker.yr
	2015-03-20 05:55:14	info	info
host-pi2	2015-03-20 05:55:13	info	instance system.adapter.admin.0 started with pid 23540
host-pi2	2015-03-20 05:55:13	info	Restart adapter system.adapter.javascript.0 because enabled
host-pi2	2015-03-20 05:55:13	error	instance system.adapter.javascript.0 terminated with code 7 (Adapter already running)
javascript-0	2015-03-20 05:55:13	error	already running
	2015-03-20 05:55:11	info	info
host-pi2	2015-03-20 05:55:12	info	instance system.adapter.yr.0 started with pid 23538
host-pi2	2015-03-20 05:55:12	info	instance scheduled system.adapter.yr.0 1 * * * *
host-pi2	2015-03-20 05:55:08	info	instance system.adapter.javascript.0 started with pid 23523
host-pi2	2015-03-20 05:55:07	info	Restart adapter system.adapter.sayit.0 because enabled
host-pi2	2015-03-20 05:55:07	error	instance system.adapter.sayit.0 terminated with code 7 (Adapter already running)
sayit-0	2015-03-20 05:55:06	error	already running
	2015-03-20 05:55:05	info	info
host-pi2	2015-03-20 05:55:04	info	Restart adapter system.adapter.sonos.0 because enabled
host-pi2	2015-03-20 05:55:04	error	instance system.adapter.sonos.0 terminated with code 7 (Adapter already running)
sonos-0	2015-03-20 05:55:04	error	already running
	2015-03-20 05:55:01	info	info
[sonos]	2015-03-20 05:55:01	info	info
host-pi2	2015-03-20 05:55:04	info	instance system.adapter.sayit.0 started with pid 23517
host-pi2	2015-03-20 05:55:03	info	instance system.adapter.dwd.0 terminated with code 0 (OK)
host-pi2	2015-03-20 05:55:00	info	instance system.adapter.sonos.0 started with pid 23511
host-pi2	2015-03-20 05:54:59	info	Restart adapter system.adapter.ping.0 because enabled
host-pi2	2015-03-20 05:54:59	error	instance system.adapter.ping.0 terminated with code 7 (Adapter already running)
ping-0	2015-03-20 05:54:58	error	already running
dwd-0	2015-03-20 05:54:58	info	setting states
	2015-03-20 05:54:57	info	info
dwd-0	2015-03-20 05:54:57	info	getFile Z_CAP_C_EDZW_20150319212320_OMEDES_WWEM59_BORX.xml
dwd-0	2015-03-20 05:54:56	info	getFile Z_CAP_C_EDZW_20150318233833_OMEDES_WWEM59_BORX.xml
host-pi2	2015-03-20 05:54:56	info	instance system.adapter.ping.0 started with pid 23496
dwd-0	2015-03-20 05:54:55	info	starting. Version 0.1.7 in /mnt/ioBroker/iobroker.Pi2/node_modules/iobroker.dwd
	2015-03-20 05:54:54	info	info
host-pi2	2015-03-20 05:54:52	info	instance system.adapter.dwd.0 started with pid 23490
host-pi2	2015-03-20 05:54:52	info	instance scheduled system.adapter.dwd.0 0,30 * * * *
host-pi2	2015-03-20 05:54:50	info	Restart adapter system.adapter.history.0 because enabled
host-pi2	2015-03-20 05:54:50	error	instance system.adapter.history.0 terminated with code 7 (Adapter already running)
history-0	2015-03-20 05:54:50	error	already running
	2015-03-20 05:54:49	info	info
host-pi2	2015-03-20 05:54:48	info	instance system.adapter.history.0 started with pid 23484
host-pi2	2015-03-20 05:54:46	info	Restart adapter system.adapter.web.0 because enabled
host-pi2	2015-03-20 05:54:46	error	instance system.adapter.web.0 terminated with code 1 ()
web-0	2015-03-20 05:54:46	error	port 8082 already in use
web-0	2015-03-20 05:54:46	info	socket.io server listening on port 8082
web-0	2015-03-20 05:54:44	info	starting. Version 0.2.6 in /mnt/ioBroker/iobroker.Pi2/node_modules/iobroker.web
host-pi2	2015-03-20 05:54:43	info	Restart adapter system.adapter.admin.0 because enabled
	2015-03-20 05:54:42	info	info
host-pi2	2015-03-20 05:54:43	error	instance system.adapter.admin.0 terminated with code 7 (Adapter already running)
admin-0	2015-03-20 05:54:43	error	already running
	2015-03-20 05:54:42	info	info
host-pi2	2015-03-20 05:54:40	info	instance system.adapter.web.0 started with pid 23460
admin-0	2015-03-20 05:54:38	warn	Reconnection to DB.
history-0	2015-03-20 05:54:38	warn	Reconnection to DB.
javascript-0	2015-03-20 05:54:37	warn	Reconnection to DB.
web-0	2015-03-20 05:54:37	warn	Reconnection to DB.
sayit-0	2015-03-20 05:54:37	warn	Reconnection to DB.
sonos-0	2015-03-20 05:54:37	warn	Reconnection to DB.
ping-0	2015-03-20 05:54:37	warn	Reconnection to DB.
history-0	2015-03-20 05:54:37	warn	Reconnection to DB.
sonos-0	2015-03-20 05:54:37	warn	Reconnection to DB.
sayit-0	2015-03-20 05:54:37	warn	Reconnection to DB.
sayit-0	2015-03-20 05:54:37	warn	Reconnection to DB.
ping-0	2015-03-20 05:54:37	warn	Reconnection to DB.
ping-0	2015-03-20 05:54:37	warn	Reconnection to DB.
admin-0	2015-03-20 05:54:37	warn	Reconnection to DB.
history-0	2015-03-20 05:54:37	warn	Reconnection to DB.
javascript-0	2015-03-20 05:54:37	warn	Reconnection to DB.
web-0	2015-03-20 05:54:37	warn	Reconnection to DB.
sayit-0	2015-03-20 05:54:37	warn	Reconnection to DB.
sonos-0	2015-03-20 05:54:37	warn	Reconnection to DB.
ping-0	2015-03-20 05:54:36	warn	Reconnection to DB.
sonos-0	2015-03-20 05:54:36	warn	Reconnection to DB.
sayit-0	2015-03-20 05:54:36	warn	Reconnection to DB.
sayit-0	2015-03-20 05:54:36	warn	Reconnection to DB.
history-0	2015-03-20 05:54:36	warn	Reconnection to DB.
ping-0	2015-03-20 05:54:36	warn	Reconnection to DB.
ping-0	2015-03-20 05:54:36	warn	Reconnection to DB.
host-pi2	2015-03-20 05:54:36	info	starting 14 instances
host-pi2	2015-03-20 05:54:36	info	17 instances found
host-pi2	2015-03-20 05:54:36	info	InMemoryDB connected
inMem-objects	2015-03-20 05:54:36	info	listening on port 9001
inMem-states	2015-03-20 05:54:35	info	listening on port 9000
host-pi2	2015-03-20 05:54:34	info	ip addresses: 192.168.28.77
host-pi2	2015-03-20 05:54:34	info	hostname: pi2
host-pi2	2015-03-20 05:54:34	info	Copyright (c) 2014 bluefox, hobbyquaker
host-pi2	2015-03-20 05:54:34	info	ioBroker.js-controller version 0.5.15 js-controller starting
	2015-03-20 05:54:34	info	info
Wenn es keinen Lösungsweg gibt, muss ich die geasmte Installation erneuern und alle Daten und Einstellungen von vorne beginnen.
Wo kann ich noch unterstützen die Fehlerursache zu finden?
-
Läuft überhaupt js-contorller?
ps -AGibt es 9000 und 9001 Ports dabei?
netstat -n -a

```` `
root@pi2:/mnt/ioBroker/iobroker.Pi2# ps -A |grep io 10 ? 00:00:00 migration/0 11 ? 00:00:00 migration/1 15 ? 00:00:00 migration/2 19 ? 00:00:00 migration/3 30 ? 00:00:00 bioset 33 ? 00:00:00 rpciod 36 ? 00:00:00 nfsiod 49 ? 00:00:00 DWC Notificatio 2551 ? 00:04:27 io.js-controlle 2573 ? 00:03:05 io.sayit.0 2588 ? 00:03:04 io.ping.0 2626 ? 00:07:56 io.admin.0 2628 ? 00:07:51 io.web.0 2647 ? 00:06:05 io.history.0 2672 ? 00:05:42 io.ping.0 2689 ? 00:03:34 io.sonos.0 2705 ? 00:03:14 io.sayit.0 2711 ? 00:07:41 io.javascript.0 2741 ? 00:00:21 io.hm-rpc.0 2762 ? 00:00:25 io.hm-rega.0 23057 ? 00:02:39 io.history.0 23060 ? 00:00:49 io.ping.0 23063 ? 00:00:36 io.sonos.0 23117 ? 00:00:30 io.sayit.0 root@pi2:/mnt/ioBroker/iobroker.Pi2#root@pi2:/mnt/ioBroker/iobroker.Pi2# netstat -n -a Aktive Internetverbindungen (Server und stehende Verbindungen) Proto Recv-Q Send-Q Local Address Foreign Address State tcp 0 0 0.0.0.0:8888 0.0.0.0:* LISTEN tcp 0 0 0.0.0.0:57983 0.0.0.0:* LISTEN tcp 0 0 0.0.0.0:9000 0.0.0.0:* LISTEN tcp 0 0 0.0.0.0:9001 0.0.0.0:* LISTEN tcp 0 0 0.0.0.0:3500 0.0.0.0:* LISTEN tcp 0 0 0.0.0.0:3501 0.0.0.0:* LISTEN tcp 0 0 0.0.0.0:44686 0.0.0.0:* LISTEN tcp 0 0 0.0.0.0:111 0.0.0.0:* LISTEN tcp 0 0 192.168.28.77:2001 0.0.0.0:* LISTEN tcp 0 0 0.0.0.0:8081 0.0.0.0:* LISTEN tcp 0 0 0.0.0.0:8082 0.0.0.0:* LISTEN tcp 0 0 0.0.0.0:8083 0.0.0.0:* LISTEN tcp 0 0 0.0.0.0:22 0.0.0.0:* LISTEN tcp 0 0 127.0.0.1:9000 127.0.0.1:37340 TIME_WAIT tcp 0 0 127.0.0.1:9001 127.0.0.1:45565 TIME_WAIT tcp 0 0 127.0.0.1:9001 127.0.0.1:42253 VERBUNDEN tcp 0 0 127.0.0.1:42207 127.0.0.1:9001 VERBUNDEN tcp 0 0 127.0.0.1:45601 127.0.0.1:9001 TIME_WAIT tcp 0 0 127.0.0.1:45615 127.0.0.1:9001 TIME_WAIT tcp 0 0 127.0.0.1:9001 127.0.0.1:45600 TIME_WAIT tcp 0 0 127.0.0.1:37288 127.0.0.1:9000 TIME_WAIT tcp 0 0 127.0.0.1:9001 127.0.0.1:42257 VERBUNDEN tcp 0 0 127.0.0.1:9000 127.0.0.1:37275 TIME_WAIT tcp 0 0 127.0.0.1:37323 127.0.0.1:9000 TIME_WAIT tcp 0 0 127.0.0.1:9000 127.0.0.1:37289 TIME_WAIT tcp 0 0 127.0.0.1:42251 127.0.0.1:9001 VERBUNDEN tcp 0 0 127.0.0.1:9001 127.0.0.1:45608 TIME_WAIT tcp 0 0 127.0.0.1:9000 127.0.0.1:37281 TIME_WAIT tcp 0 0 127.0.0.1:9000 127.0.0.1:37302 TIME_WAIT tcp 0 0 127.0.0.1:9000 127.0.0.1:37331 TIME_WAIT tcp 0 0 127.0.0.1:9000 127.0.0.1:37283 TIME_WAIT tcp 0 0 127.0.0.1:9000 127.0.0.1:37336 TIME_WAIT tcp 0 0 127.0.0.1:45566 127.0.0.1:9001 TIME_WAIT tcp 0 0 127.0.0.1:9000 127.0.0.1:37322 TIME_WAIT tcp 0 0 127.0.0.1:9001 127.0.0.1:45592 TIME_WAIT tcp 0 0 192.168.28.77:714 192.168.28.24:2049 VERBUNDEN tcp 0 0 127.0.0.1:42213 127.0.0.1:9001 VERBUNDEN tcp 0 0 127.0.0.1:9000 127.0.0.1:33936 VERBUNDEN tcp 0 0 127.0.0.1:34144 127.0.0.1:9000 VERBUNDEN tcp 0 0 127.0.0.1:9000 127.0.0.1:33954 VERBUNDEN tcp 0 0 127.0.0.1:9000 127.0.0.1:33946 VERBUNDEN tcp 0 0 127.0.0.1:45607 127.0.0.1:9001 TIME_WAIT tcp 0 0 127.0.0.1:42255 127.0.0.1:9001 VERBUNDEN tcp 0 0 127.0.0.1:45579 127.0.0.1:9001 TIME_WAIT tcp 0 0 127.0.0.1:9001 127.0.0.1:45584 TIME_WAIT tcp 0 0 127.0.0.1:42253 127.0.0.1:9001 VERBUNDEN tcp 0 0 127.0.0.1:9001 127.0.0.1:42209 VERBUNDEN tcp 0 0 127.0.0.1:9000 127.0.0.1:33950 VERBUNDEN tcp 0 0 127.0.0.1:9001 127.0.0.1:45553 TIME_WAIT tcp 0 0 127.0.0.1:9000 127.0.0.1:37293 TIME_WAIT tcp 0 0 127.0.0.1:42405 127.0.0.1:9001 VERBUNDEN tcp 0 0 127.0.0.1:45591 127.0.0.1:9001 TIME_WAIT tcp 0 0 127.0.0.1:9000 127.0.0.1:37344 TIME_WAIT tcp 0 0 127.0.0.1:37276 127.0.0.1:9000 TIME_WAIT tcp 0 0 127.0.0.1:33956 127.0.0.1:9000 VERBUNDEN tcp 0 0 127.0.0.1:9000 127.0.0.1:37330 TIME_WAIT tcp 0 0 127.0.0.1:9001 127.0.0.1:42422 VERBUNDEN tcp 0 0 127.0.0.1:9001 127.0.0.1:45622 TIME_WAIT tcp 0 0 127.0.0.1:9001 127.0.0.1:45606 TIME_WAIT tcp 0 0 127.0.0.1:9000 127.0.0.1:37287 TIME_WAIT tcp 0 0 127.0.0.1:37337 127.0.0.1:9000 TIME_WAIT tcp 0 0 127.0.0.1:33938 127.0.0.1:9000 VERBUNDEN tcp 0 0 127.0.0.1:9001 127.0.0.1:45580 TIME_WAIT tcp 0 0 127.0.0.1:42215 127.0.0.1:9001 VERBUNDEN tcp 0 0 127.0.0.1:9001 127.0.0.1:42213 VERBUNDEN tcp 0 0 127.0.0.1:33940 127.0.0.1:9000 VERBUNDEN tcp 0 0 127.0.0.1:45623 127.0.0.1:9001 TIME_WAIT tcp 0 0 127.0.0.1:33958 127.0.0.1:9000 VERBUNDEN tcp 0 0 192.168.28.77:8081 192.168.28.88:49704 VERBUNDEN tcp 0 0 127.0.0.1:9001 127.0.0.1:45575 TIME_WAIT tcp 0 0 127.0.0.1:9001 127.0.0.1:42405 VERBUNDEN tcp 0 0 127.0.0.1:37345 127.0.0.1:9000 TIME_WAIT tcp 0 0 127.0.0.1:42422 127.0.0.1:9001 VERBUNDEN tcp 0 0 127.0.0.1:37307 127.0.0.1:9000 TIME_WAIT tcp 0 0 127.0.0.1:9000 127.0.0.1:34144 VERBUNDEN tcp 0 0 127.0.0.1:42245 127.0.0.1:9001 VERBUNDEN tcp 0 0 127.0.0.1:9001 127.0.0.1:45561 TIME_WAIT tcp 0 0 127.0.0.1:9000 127.0.0.1:33960 VERBUNDEN tcp 0 0 127.0.0.1:9001 127.0.0.1:42245 VERBUNDEN tcp 0 0 127.0.0.1:45585 127.0.0.1:9001 TIME_WAIT tcp 0 0 127.0.0.1:9001 127.0.0.1:45616 TIME_WAIT tcp 0 0 127.0.0.1:9001 127.0.0.1:45567 TIME_WAIT tcp 0 0 127.0.0.1:42257 127.0.0.1:9001 VERBUNDEN tcp 0 0 127.0.0.1:9000 127.0.0.1:37324 TIME_WAIT tcp 0 0 127.0.0.1:9000 127.0.0.1:37339 TIME_WAIT tcp 0 0 127.0.0.1:33936 127.0.0.1:9000 VERBUNDEN tcp 0 0 127.0.0.1:45560 127.0.0.1:9001 TIME_WAIT tcp 0 0 127.0.0.1:9000 127.0.0.1:37316 TIME_WAIT tcp 0 0 127.0.0.1:33946 127.0.0.1:9000 VERBUNDEN tcp 0 0 127.0.0.1:9001 127.0.0.1:45559 TIME_WAIT tcp 0 0 127.0.0.1:9000 127.0.0.1:33952 VERBUNDEN tcp 0 0 127.0.0.1:33954 127.0.0.1:9000 VERBUNDEN tcp 0 0 127.0.0.1:9001 127.0.0.1:45571 TIME_WAIT tcp 0 0 127.0.0.1:9001 127.0.0.1:42207 VERBUNDEN tcp 0 0 127.0.0.1:45554 127.0.0.1:9001 TIME_WAIT tcp 0 0 127.0.0.1:9000 127.0.0.1:37315 TIME_WAIT tcp 0 0 127.0.0.1:33944 127.0.0.1:9000 VERBUNDEN tcp 0 0 127.0.0.1:9001 127.0.0.1:45624 TIME_WAIT tcp 0 0 192.168.28.77:8082 192.168.28.88:49924 VERBUNDEN tcp 0 0 127.0.0.1:9001 127.0.0.1:42247 VERBUNDEN tcp 0 0 127.0.0.1:9000 127.0.0.1:33948 VERBUNDEN tcp 0 0 127.0.0.1:37301 127.0.0.1:9000 TIME_WAIT tcp 0 0 127.0.0.1:37295 127.0.0.1:9000 TIME_WAIT tcp 0 0 127.0.0.1:9000 127.0.0.1:37332 TIME_WAIT tcp 0 0 127.0.0.1:9001 127.0.0.1:45586 TIME_WAIT tcp 0 0 127.0.0.1:33960 127.0.0.1:9000 VERBUNDEN tcp 0 0 127.0.0.1:9000 127.0.0.1:34130 VERBUNDEN tcp 0 0 127.0.0.1:9001 127.0.0.1:42249 VERBUNDEN tcp 0 0 127.0.0.1:9000 127.0.0.1:37300 TIME_WAIT tcp 0 0 127.0.0.1:9001 127.0.0.1:42215 VERBUNDEN tcp 0 0 127.0.0.1:33948 127.0.0.1:9000 VERBUNDEN tcp 0 0 127.0.0.1:9001 127.0.0.1:45602 TIME_WAIT tcp 0 0 127.0.0.1:9000 127.0.0.1:37338 TIME_WAIT tcp 0 0 127.0.0.1:34130 127.0.0.1:9000 VERBUNDEN tcp 0 0 127.0.0.1:45572 127.0.0.1:9001 TIME_WAIT tcp 0 0 127.0.0.1:42249 127.0.0.1:9001 VERBUNDEN tcp 0 4368 192.168.28.77:22 192.168.28.88:49693 VERBUNDEN tcp 0 0 127.0.0.1:33942 127.0.0.1:9000 VERBUNDEN tcp 0 0 127.0.0.1:9000 127.0.0.1:37277 TIME_WAIT tcp 0 0 127.0.0.1:9000 127.0.0.1:37346 TIME_WAIT tcp 0 0 127.0.0.1:9001 127.0.0.1:45578 TIME_WAIT tcp 0 0 127.0.0.1:9001 127.0.0.1:45614 TIME_WAIT tcp 0 0 127.0.0.1:9000 127.0.0.1:37328 TIME_WAIT tcp 0 0 127.0.0.1:42209 127.0.0.1:9001 VERBUNDEN tcp 0 0 127.0.0.1:37282 127.0.0.1:9000 TIME_WAIT tcp 0 0 127.0.0.1:9000 127.0.0.1:33958 VERBUNDEN tcp 0 0 127.0.0.1:42243 127.0.0.1:9001 VERBUNDEN tcp 0 0 127.0.0.1:42247 127.0.0.1:9001 VERBUNDEN tcp 0 0 192.168.28.77:2001 192.168.28.25:47449 VERBUNDEN tcp 0 0 127.0.0.1:9000 127.0.0.1:33944 VERBUNDEN tcp 0 0 127.0.0.1:9001 127.0.0.1:42243 VERBUNDEN tcp 0 0 127.0.0.1:33952 127.0.0.1:9000 VERBUNDEN tcp 0 0 127.0.0.1:37329 127.0.0.1:9000 TIME_WAIT tcp 0 0 127.0.0.1:9001 127.0.0.1:45628 VERBUNDEN tcp 0 0 127.0.0.1:9000 127.0.0.1:37314 TIME_WAIT tcp 0 0 127.0.0.1:9001 127.0.0.1:42211 VERBUNDEN tcp 0 0 127.0.0.1:9000 127.0.0.1:33938 VERBUNDEN tcp 0 0 127.0.0.1:9000 127.0.0.1:37306 TIME_WAIT tcp 0 0 127.0.0.1:9000 127.0.0.1:37312 TIME_WAIT tcp 0 0 127.0.0.1:9001 127.0.0.1:45590 TIME_WAIT tcp 0 0 127.0.0.1:9000 127.0.0.1:33956 VERBUNDEN tcp 0 0 127.0.0.1:9001 127.0.0.1:45573 TIME_WAIT tcp 0 0 127.0.0.1:9000 127.0.0.1:37308 TIME_WAIT tcp 0 0 127.0.0.1:9001 127.0.0.1:42251 VERBUNDEN tcp 0 0 127.0.0.1:9000 127.0.0.1:33942 VERBUNDEN tcp 0 0 127.0.0.1:9001 127.0.0.1:42255 VERBUNDEN tcp 0 0 127.0.0.1:9001 127.0.0.1:45555 TIME_WAIT tcp 0 0 192.168.28.77:8081 192.168.28.184:49599 VERBUNDEN tcp 0 0 127.0.0.1:33950 127.0.0.1:9000 VERBUNDEN tcp 0 0 127.0.0.1:37313 127.0.0.1:9000 TIME_WAIT tcp 0 0 127.0.0.1:9000 127.0.0.1:33940 VERBUNDEN tcp 307 0 127.0.0.1:45628 127.0.0.1:9001 CLOSE_WAIT tcp 0 0 127.0.0.1:42211 127.0.0.1:9001 VERBUNDEN tcp 0 0 127.0.0.1:9000 127.0.0.1:37296 TIME_WAIT udp 0 0 0.0.0.0:68 0.0.0.0:* udp 0 0 0.0.0.0:111 0.0.0.0:* udp 0 0 192.168.28.77:123 0.0.0.0:* udp 0 0 127.0.0.1:123 0.0.0.0:* udp 0 0 0.0.0.0:123 0.0.0.0:* udp 0 0 0.0.0.0:700 0.0.0.0:* udp 0 0 127.0.0.1:742 0.0.0.0:* udp 0 0 0.0.0.0:46353 0.0.0.0:* udp 0 0 0.0.0.0:60330 0.0.0.0:* udp 0 0 0.0.0.0:44459 0.0.0.0:* Aktive Sockets in der UNIX-Domäne (Server und stehende Verbindungen) Proto RefCnt Flags Type State I-Node Pfad unix 3 [ ] DGRAM 9256 /var/run/wpa_supplicant/wlan0 unix 2 [ ] DGRAM 8533 /var/run/thd.socket unix 2 [ ] DGRAM 7525 /tmp/wpa_ctrl_1898-1 unix 2 [ ACC ] STREAM HÖRT 6011 /var/run/rpcbind.sock unix 2 [ ACC ] STREAM HÖRT 8572 /var/run/dbus/system_bus_socket unix 7 [ ] DGRAM 9393 /dev/log unix 2 [ ACC ] SEQPAKET HÖRT 4556 /run/udev/control unix 2 [ ] DGRAM 9412 unix 3 [ ] STREAM VERBUNDEN 9280 unix 3 [ ] DGRAM 5140 unix 3 [ ] STREAM VERBUNDEN 423225 unix 2 [ ] STREAM VERBUNDEN 7630 unix 2 [ ] DGRAM 303550 unix 3 [ ] STREAM VERBUNDEN 424591 unix 2 [ ] DGRAM 303908 unix 3 [ ] STREAM VERBUNDEN 8579 unix 2 [ ] DGRAM 9448 unix 3 [ ] STREAM VERBUNDEN 462460 unix 3 [ ] STREAM VERBUNDEN 9279 unix 3 [ ] DGRAM 5141 unix 2 [ ] DGRAM 245555 unix 3 [ ] STREAM VERBUNDEN 462459 unix 3 [ ] STREAM VERBUNDEN 424590 unix 3 [ ] STREAM VERBUNDEN 8578 unix 3 [ ] STREAM VERBUNDEN 423224 root@pi2:/mnt/ioBroker/iobroker.Pi2# -
da wir hier nicht wirklich weiter kommen, habe ich mich entschieden das iobroker-System neu aufzusetzen. (Schade)
habe das "alte" Verzeichniss gesichert.
Anschließend mit
root@pi2:/mnt/ioBroker/iobroker.Pi2# npm install iobroker
neu installiert.
Den Gedanke die einzelen Adapter nach und nach zurück zu sichern / kopieren habe ich wieder verworfen, da die Konfiguration aller Adapter in einer Datei gespeichert sind. [objects.json] (Oder sehe ich das falsch?) Daher habe ich keine Changse einzelne Adapter mit ihrer Konfiguration zurück zu spielen. (Da sind wir wieder bei dem Thema BACKUP: http://forum.iobroker.org/viewtopic.php … =445#p3164 )
Frage: Habe ich die Möglichkeit einzelne Adapter mit ihrer Konfiguration zurück zu sichern ?
Wenn es nicht Möglich ist muss ich wieder von vorne Anfangen und die Adapter installieren und konfigurieren
EDIT:
Im Bereich von VIS gibt es die Möglichkeit die Konfiguration zurück zu spielen.
Nach installation des Adaptern habe ich folgendes zurück kopiert:
root@pi2:/mnt/ioBroker/iobroker.Pi2# mkdir iobroker-data/files/vis.0
root@pi2:/mnt/ioBroker/iobroker.Pi2# mkdir iobroker-data/files/vis.0/main
root@pi2:/mnt/ioBroker/iobroker.Pi2# cp ../iobroker.Pi2.defekt/iobroker-data/files/vis.0/main/* iobroker-data/files/vis.0/main/

root@pi2:/mnt/ioBroker/iobroker.Pi2# ls -l iobroker-data/files/vis.0/main
insgesamt 28
---------- 1 root root     0 Mär 21 10:17 vis-user.css
---------- 1 root root 25244 Mär 21 10:17 vis-views.json
root@pi2:/mnt/ioBroker/iobroker.Pi2#
Somit habe ich eine Menge Arbeit gespart
-
Man kann alles (jeden einzelnen Adapter) importieren. Nun ist es nicht so bequem.
Alle Daten liegen in objects.json. Wenn du denn aufmachst und formatierst (z.b. mit notepad++) dann kannst du für jeden Adapter system.adapter.XXX.0 finden. Das ist Konfiguration vom Adapter XXX.
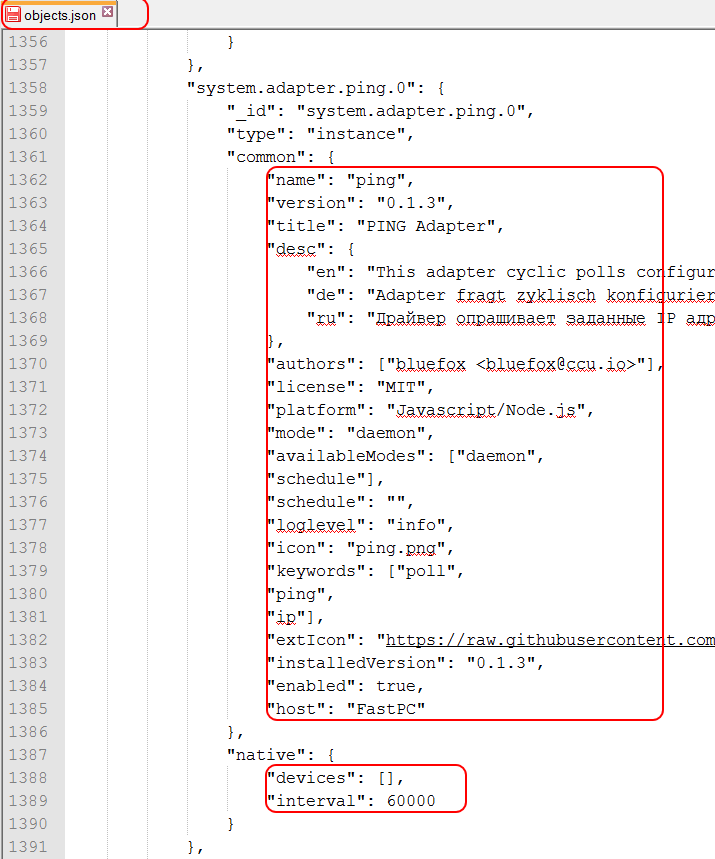
Man kann diese information einfach nehmen (common und native getrennt und in admin reinkopieren)

-
Hallo,
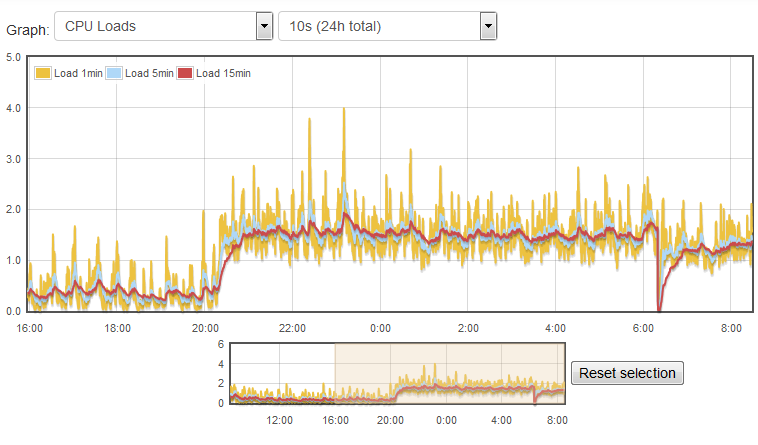
seit gestern Abend habe ich eine erhöte CPU-Last
filename="ioBrokerCPU-Last.PNG" index="0">~~Gruß
derAuge `
Hi derAuge,
womit hast Du denn die Grafik erzeugt?
Sieht sehr brauchbar aus.
Viele Grüße,
Michael `
Schau mal unter : http://rpi-experiences.blogspot.fr/p/rpi-monitor.html
Gruß
derAuge
-
Schau mal unter : http://rpi-experiences.blogspot.fr/p/rpi-monitor.html
Gruß
derAuge `
Super, ich danke Dir!
Das werde ich auf den Raspberrys ausprobieren.
In meiner ioBroker installation hilft es mir leider nicht, da diese auf Debian läuft.
Aber da wird es mit Sicherheit auch was geben ;-)
Danke :)
-
Schau mal unter : http://rpi-experiences.blogspot.fr/p/rpi-monitor.html
Gruß
derAuge `
Super, ich danke Dir!
Das werde ich auf den Raspberrys ausprobieren.
In meiner ioBroker installation hilft es mir leider nicht, da diese auf Debian läuft.
Aber da wird es mit Sicherheit auch was geben ;-)
Danke :) `
Kann jemand das beschreiben, wir nehmen das in Wiki rein. Grafik kann man in vis anbinden. -
Schau mal unter : http://rpi-experiences.blogspot.fr/p/rpi-monitor.html
Gruß
derAuge `
Super, ich danke Dir!
Das werde ich auf den Raspberrys ausprobieren.
In meiner ioBroker installation hilft es mir leider nicht, da diese auf Debian läuft.
Aber da wird es mit Sicherheit auch was geben ;-)
Danke :)
Kann jemand das beschreiben, wir nehmen das in Wiki rein. Grafik kann man in vis anbinden.Ich hatte es nach folgender Anleitung installiert: http://jankarres.de/2013/11/raspberry-p … tallieren/
! Voraussetzung: Raspbian oder vergleichbare Distribution installiert
! Step 1
! Zunächst aktualisieren wir das System, sodass wir sichergehen können, dass alle installierten Pakete aktuell sind.
! ````
sudo apt-get update && sudo apt-get upgradeStep 2 >! Nun installieren wir folgende Pakete, welche von RPI-Monitor benötigt werden. >! ```` sudo apt-get install dpkg-dev librrds-perl libhttp-daemon-perl libjson-perl libipc-sharelite-perl libfile-which-perlStep 3
! Jetzt ist es an der Zeit, RPI-Monitor herunterzuladen. Im Git Repository des Projekts findet man die aktuellen Debian Packages. Zum Zeitpunkt als dieses Tutorial geschrieben wurde, war Version 2.6-1 aktuell.
! ````
wget --no-check-certificate https://github.com/XavierBerger/RPi-Monitor-deb/raw/master/packages/rpimonitor_2.6-1_all.debStep 4 >! Wir installieren RPI-Monitor und löschen anschließend die nicht mehr benötigte deb-Datei. >! ```` sudo dpkg -i rpimonitor_2.6-1_all.deb rm rpimonitor_2.6-1_all.debStep 5
! RPI-Monitor ist nun im Browser unter http://IP:8888/ (IP ersetzt durch IP-Adresse des Raspberry Pis) aufrufbar. Der Service wurde bereits automatisch im Autostart eingetragen, sodass das Webinterface auch nach einem Neustart des Raspberry Pis wieder verfügbar ist.
! Und das wars schon. Nun hat man übersichtlich den Status des Raspberry Pis im Blick und es werden automatisch Langzeitstatistiken erzeugt. -
Ich hatte es nach folgender Anleitung installiert: http://jankarres.de/2013/11/raspberry-p … tallieren/
! Voraussetzung: Raspbian oder vergleichbare Distribution installiert
! Step 1
! Zunächst aktualisieren wir das System, sodass wir sichergehen können, dass alle installierten Pakete aktuell sind.
! ````
sudo apt-get update && sudo apt-get upgradeStep 2 >! Nun installieren wir folgende Pakete, welche von RPI-Monitor benötigt werden. >! ```` sudo apt-get install dpkg-dev librrds-perl libhttp-daemon-perl libjson-perl libipc-sharelite-perl libfile-which-perlStep 3
! Jetzt ist es an der Zeit, RPI-Monitor herunterzuladen. Im Git Repository des Projekts findet man die aktuellen Debian Packages. Zum Zeitpunkt als dieses Tutorial geschrieben wurde, war Version 2.6-1 aktuell.
! ````
wget --no-check-certificate https://github.com/XavierBerger/RPi-Monitor-deb/raw/master/packages/rpimonitor_2.6-1_all.debStep 4 >! Wir installieren RPI-Monitor und löschen anschließend die nicht mehr benötigte deb-Datei. >! ```` sudo dpkg -i rpimonitor_2.6-1_all.deb rm rpimonitor_2.6-1_all.debStep 5
! RPI-Monitor ist nun im Browser unter http://IP:8888/ (IP ersetzt durch IP-Adresse des Raspberry Pis) aufrufbar. Der Service wurde bereits automatisch im Autostart eingetragen, sodass das Webinterface auch nach einem Neustart des Raspberry Pis wieder verfügbar ist.
! Und das wars schon. Nun hat man übersichtlich den Status des Raspberry Pis im Blick und es werden automatisch Langzeitstatistiken erzeugt. `
Habe es übernommen. Ist das OK, dass ich dein Bild nutze? -
Ich hatte es nach folgender Anleitung installiert: http://jankarres.de/2013/11/raspberry-p … tallieren/
! Voraussetzung: Raspbian oder vergleichbare Distribution installiert
! Step 1
! Zunächst aktualisieren wir das System, sodass wir sichergehen können, dass alle installierten Pakete aktuell sind.
! ````
sudo apt-get update && sudo apt-get upgradeStep 2 >! Nun installieren wir folgende Pakete, welche von RPI-Monitor benötigt werden. >! ```` sudo apt-get install dpkg-dev librrds-perl libhttp-daemon-perl libjson-perl libipc-sharelite-perl libfile-which-perlStep 3
! Jetzt ist es an der Zeit, RPI-Monitor herunterzuladen. Im Git Repository des Projekts findet man die aktuellen Debian Packages. Zum Zeitpunkt als dieses Tutorial geschrieben wurde, war Version 2.6-1 aktuell.
! ````
wget --no-check-certificate https://github.com/XavierBerger/RPi-Monitor-deb/raw/master/packages/rpimonitor_2.6-1_all.debStep 4 >! Wir installieren RPI-Monitor und löschen anschließend die nicht mehr benötigte deb-Datei. >! ```` sudo dpkg -i rpimonitor_2.6-1_all.deb rm rpimonitor_2.6-1_all.debStep 5
! RPI-Monitor ist nun im Browser unter http://IP:8888/ (IP ersetzt durch IP-Adresse des Raspberry Pis) aufrufbar. Der Service wurde bereits automatisch im Autostart eingetragen, sodass das Webinterface auch nach einem Neustart des Raspberry Pis wieder verfügbar ist.
! Und das wars schon. Nun hat man übersichtlich den Status des Raspberry Pis im Blick und es werden automatisch Langzeitstatistiken erzeugt. `
Habe es übernommen. Ist das OK, dass ich dein Bild nutze?passt
Hey! Du scheinst an dieser Unterhaltung interessiert zu sein, hast aber noch kein Konto.
Hast du es satt, bei jedem Besuch durch die gleichen Beiträge zu scrollen? Wenn du dich für ein Konto anmeldest, kommst du immer genau dorthin zurück, wo du zuvor warst, und kannst dich über neue Antworten benachrichtigen lassen (entweder per E-Mail oder Push-Benachrichtigung). Du kannst auch Lesezeichen speichern und Beiträge positiv bewerten, um anderen Community-Mitgliedern deine Wertschätzung zu zeigen.
Mit deinem Input könnte dieser Beitrag noch besser werden 💗
Registrieren AnmeldenSupport us
455
Online33.0k
Benutzer83.4k
Themen1.3m
Beiträge