

TibberLink Adapter
-
@Michi_Pi habe ich Dich falsch verstanden oder ist das bei Dir anders? Ich dachte, Du hast Modul 3 und bekommst die für Deine Region "normalen" Netzentgelte im Brutto Preis übermittelt und erst am Monatsende wird das dann über die Abrechnung korrigiert?
-
@Michi_Pi habe ich Dich falsch verstanden oder ist das bei Dir anders? Ich dachte, Du hast Modul 3 und bekommst die für Deine Region "normalen" Netzentgelte im Brutto Preis übermittelt und erst am Monatsende wird das dann über die Abrechnung korrigiert?
@HansJochen sagte in TibberLink Adapter:
@Michi_Pi habe ich Dich falsch verstanden oder ist das bei Dir anders? Ich dachte, Du hast Modul 3 und bekommst die für Deine Region "normalen" Netzentgelte im Brutto Preis übermittelt und erst am Monatsende wird das dann über die Abrechnung korrigiert?
Ja genau, so ist es.
-
Okay, aber Du hast ja Modul 1, nicht Modul 3. Dann sind die Netzentgelte für die Aussteuerung ja auch einigermaßen egal, weil sie zu jeder Zeit gleich sind und Du trotzdem zum günstigsten Zeitfenster gelenkt wirst. Bisschen überraschend, dass Tibber anscheinend bei Modul 3 die echten Brutto Preise übermittelt und bei Modul 1 nicht. Vielleicht ist das aber auch nur für Einzelne und nur für eine Übergangszeit anders, abhängig vom Netzbetreiber o.ä. Falls Tibber das bei Dir mal ändert, schreib es doch gerne hier.
Mit Modul 3 ist hier keiner, oder? Das ist ja noch einigermaßen neu.
-
glaub Tibber bastelt da eh noch ständig rum. Am Anfang des Jahres bin ich noch auf Tibber zugegangen und hab ihnen meine Vergünstigungen mitgeteilt damit ich das überhaupt monatlich abgezogen bekommen hatte. Zudem ist es ja auch nicht ganz einfach, da ja auch jeder Netzbetreiber andere Tarife hat. Dieses Jahr hätte bei mir Modul 3 noch Sinn gemacht, nächstes Jahr nicht mehr. Zu dem Rollout hat mein Netzbetreiben auch nicht wirklich Ambitionen. Mit dem Gateway standen die schon bei mir, aber wegen schlechtem Empfang gingen Sie wieder und seither auch keine Rückmeldung. Auch nicht das mir eine externe Antenne oder dergleichen Angeboten wurde damit das funktionieren würde.
-
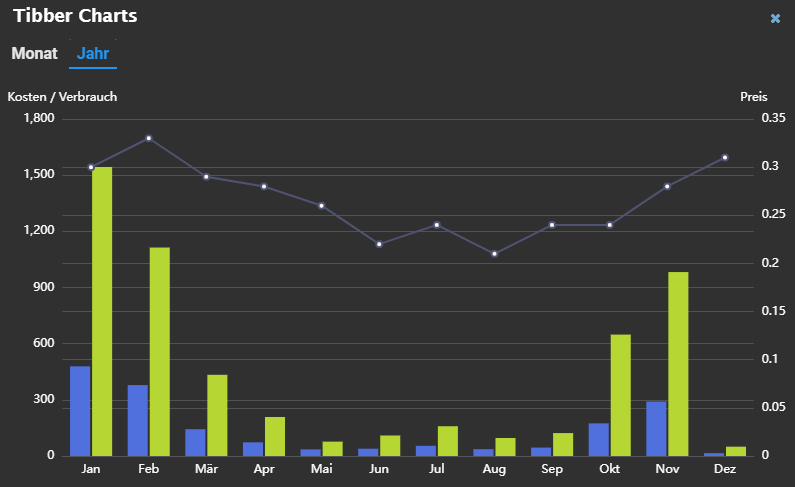
Hi, falls jemand Interesse hat hier mal zwei Diagramme zum Nachbauen für flexcharts
Kosten:
// ============================================================================
// TIBBER – Monats- & Jahresauswertung
// Durchschnittspreis aus unitPrice (verbrauchsgewichtet)
// ============================================================================


// =================== KONFIG ===================

// --- Monat (jsonDaily) ---
const jsonDP_Month      = 'tibberlink.0.Homes.8f8a4278-17b9-48fb-b725-b60bd1485ac6.Consumption.jsonDaily';
const resultCostDP      = '0_userdata.0.Tibber.SumUnitCostThisMonth';
const resultConsDP      = '0_userdata.0.Tibber.SumConsumptionThisMonth';
const resultPriceDP     = '0_userdata.0.Tibber.AvgUnitPriceThisMonth';

// --- Jahr (jsonMonthly + aktueller Monat aus jsonDaily) ---
const jsonDP_Year       = 'tibberlink.0.Homes.8f8a4278-17b9-48fb-b725-b60bd1485ac6.Consumption.jsonMonthly';
const resultCostYearDP  = '0_userdata.0.Tibber.SumUnitCostThisYear';
const resultConsYearDP  = '0_userdata.0.Tibber.SumConsumptionThisYear';
const resultPriceYearDP = '0_userdata.0.Tibber.AvgUnitPriceThisYear';


// =================== FUNKTION (MONAT) ===================

function calcMonthValues() {
    try {
        const raw = getState(jsonDP_Month)?.val;
        if (!raw) return;

        const data = JSON.parse(raw);
        if (!Array.isArray(data)) return;

        let sumCons  = 0;
        let sumCost  = 0;
        let sumPrice = 0; // unitPrice * consumption

        const now = new Date();
        const y = now.getFullYear();
        const m = now.getMonth();

        data.forEach(entry => {
            if (!entry.from) return;

            const d = new Date(entry.from);
            if (d.getFullYear() === y && d.getMonth() === m) {

                const cons  = Number(entry.consumption);
                const cost  = Number(entry.totalCost);
                const price = Number(entry.unitPrice);

                if (!isNaN(cons)) {
                    sumCons += cons;
                    if (!isNaN(price)) sumPrice += cons * price;
                }
                if (!isNaN(cost)) sumCost += cost;
            }
        });

        const avgUnitPrice = sumCons > 0 ? sumPrice / sumCons : 0;

        setState(resultConsDP,  Number(sumCons.toFixed(3)), true);
        setState(resultCostDP,  Number(sumCost.toFixed(4)), true);
        setState(resultPriceDP, Number(avgUnitPrice.toFixed(4)), true);

        log(`📅 Monat: ${sumCons.toFixed(3)} kWh | ${sumCost.toFixed(2)} € | Ø ${avgUnitPrice.toFixed(4)} €/kWh`, 'info');

    } catch (e) {
        log(`❌ Fehler Monatsberechnung: ${e}`, 'error');
    }
}


// =================== FUNKTION (JAHR) ===================

function calcYearValues() {
    try {
        const rawYear  = getState(jsonDP_Year)?.val;
        const rawMonth = getState(jsonDP_Month)?.val;

        if (!rawYear) return;

        const dataYear  = JSON.parse(rawYear);
        const dataMonth = rawMonth ? JSON.parse(rawMonth) : [];

        let sumCons  = 0;
        let sumCost  = 0;
        let sumPrice = 0;

        const now = new Date();
        const y = now.getFullYear();
        const m = now.getMonth();

        // --- Monate aus jsonMonthly (ohne aktuellen Monat) ---
        if (Array.isArray(dataYear)) {
            dataYear.forEach(entry => {
                if (!entry.from) return;

                const d = new Date(entry.from);
                if (d.getFullYear() === y && d.getMonth() !== m) {

                    const cons  = Number(entry.consumption);
                    const cost  = Number(entry.totalCost);
                    const price = Number(entry.unitPrice);

                    if (!isNaN(cons)) {
                        sumCons += cons;
                        if (!isNaN(price)) sumPrice += cons * price;
                    }
                    if (!isNaN(cost)) sumCost += cost;
                }
            });
        }

        // --- Aktueller Monat aus jsonDaily ---
        if (Array.isArray(dataMonth)) {
            dataMonth.forEach(entry => {
                if (!entry.from) return;

                const d = new Date(entry.from);
                if (d.getFullYear() === y && d.getMonth() === m) {

                    const cons  = Number(entry.consumption);
                    const cost  = Number(entry.totalCost);
                    const price = Number(entry.unitPrice);

                    if (!isNaN(cons)) {
                        sumCons += cons;
                        if (!isNaN(price)) sumPrice += cons * price;
                    }
                    if (!isNaN(cost)) sumCost += cost;
                }
            });
        }

        const avgUnitPrice = sumCons > 0 ? sumPrice / sumCons : 0;

        setState(resultConsYearDP,  Number(sumCons.toFixed(3)), true);
        setState(resultCostYearDP,  Number(sumCost.toFixed(4)), true);
        setState(resultPriceYearDP, Number(avgUnitPrice.toFixed(4)), true);

        log(`📆 Jahr ${y}: ${sumCons.toFixed(3)} kWh | ${sumCost.toFixed(2)} € | Ø ${avgUnitPrice.toFixed(4)} €/kWh`, 'info');

    } catch (e) {
        log(`❌ Fehler Jahresberechnung: ${e}`, 'error');
    }
}


// =================== TRIGGER ===================

// beim Start
calcMonthValues();
calcYearValues();

// jsonDaily ändert sich
on({ id: jsonDP_Month, change: 'ne' }, () => {
    calcMonthValues();
    calcYearValues();   // wichtig!
});

// jsonMonthly ändert sich
on({ id: jsonDP_Year, change: 'ne' }, () => {
    calcYearValues();
});
Jahr:
// ============================================================================
// Tibber Jahresübersicht + eCharts VIS-Widget
// ----------------------------------------------------------------------------
// - Erstellt 12 Datenpunkte für Kosten, Verbrauch, Preis
// - Liest tibber Monthly JSON aus
// - Ergänzt/überschreibt aktuellen Monat aus 0_userdata-Datenpunkten
// - Erstellt eCharts-Konfiguration für VIS
// - Tooltip mit 2 Nachkommastellen
// ============================================================================

// =================== KONFIG ===================
const jsonMonthlyDP = 'tibberlink.0.Homes.xxxxxxxxxxxxx.Consumption.jsonMonthly';
const rootDP        = '0_userdata.0.Tibber.Jahreswerte';
const visDP         = `${rootDP}.eCharts_Monatsbalken`;

// Userdata aktuelle Monatswerte
const dpPriceThisMonth = '0_userdata.0.Tibber.AvgUnitPriceThisMonth';
const dpConsThisMonth  = '0_userdata.0.Tibber.SumConsumptionThisMonth';
const dpCostThisMonth  = '0_userdata.0.Tibber.SumUnitCostThisMonth';

// =================== 12 Monats-Datenpunkte erzeugen ===================
function createMonthDPs() {
    for (let m = 1; m <= 12; m++) {
        createState(`${rootDP}.Cost.M${m}`, 0,  { name: `Kosten Monat ${m}`,       type: 'number', unit: '€',     role: 'value' });
        createState(`${rootDP}.Cons.M${m}`, 0,  { name: `Verbrauch Monat ${m}`,    type: 'number', unit: 'kWh',   role: 'value' });
        createState(`${rootDP}.Price.M${m}`,0,  { name: `Durchschnittspreis M${m}`, type: 'number', unit: '€/kWh', role: 'value' });
    }
    createState(visDP, '', { name: 'eCharts Config Monatsbalken', type: 'string', role: 'text' });
}
createMonthDPs();


// =================== Hauptfunktion ===================
function updateYearValues() {
    try {
        const raw = getState(jsonMonthlyDP).val;
        if (!raw) return log("Keine Monatsdaten vorhanden", "warn");

        const data = JSON.parse(raw);
        const currentYear  = new Date().getFullYear();
        const currentMonth = new Date().getMonth() + 1;

        let arrCost  = Array(12).fill(0);
        let arrCons  = Array(12).fill(0);
        let arrPrice = Array(12).fill(0);

        // ========== JSON durchlaufen ==========
        data.forEach(entry => {
            if (!entry.from) return;

            const d = new Date(entry.from);
            const year  = d.getFullYear();
            const month = d.getMonth() + 1;

            if (year !== currentYear) return;

            const cost  = parseFloat(entry.totalCost)   || 0;
            const cons  = parseFloat(entry.consumption) || 0;
            const price = parseFloat(entry.unitPrice)   || 0;

            arrCost[month - 1]  = parseFloat(cost.toFixed(2));
            arrCons[month - 1]  = parseFloat(cons.toFixed(2));
            arrPrice[month - 1] = parseFloat(price.toFixed(2));

            setState(`${rootDP}.Cost.M${month}`,  cost,  true);
            setState(`${rootDP}.Cons.M${month}`,  cons,  true);
            setState(`${rootDP}.Price.M${month}`, price, true);
        });

        // =============================================================
        //  **AKTUELLEN MONAT MIT USERDATA ÜBERSCHREIBEN**
        // =============================================================
        const uPrice = parseFloat(getState(dpPriceThisMonth).val) || 0;
        const uCons  = parseFloat(getState(dpConsThisMonth).val)  || 0;
        const uCost  = parseFloat(getState(dpCostThisMonth).val)  || 0;

        arrCost[currentMonth - 1]  = parseFloat(uCost.toFixed(2));
        arrCons[currentMonth - 1]  = parseFloat(uCons.toFixed(2));
        arrPrice[currentMonth - 1] = parseFloat(uPrice.toFixed(2));

        setState(`${rootDP}.Cost.M${currentMonth}`,  uCost,  true);
        setState(`${rootDP}.Cons.M${currentMonth}`,  uCons,  true);
        setState(`${rootDP}.Price.M${currentMonth}`, uPrice, true);

        // =====================================================================
        // eCharts VIS-Konfiguration
        // =====================================================================
        const option = {
            textStyle: { color: '#FFFFFF' },
            tooltip: {
                trigger: 'axis',
                textStyle: { color: '#525252' },
                formatter: function(params) {
                    return params.map(p => {
                        let unit = '€/kWh';
                        if (p.seriesName.includes('€')) unit = '€';
                        else if (p.seriesName.includes('kWh')) unit = 'kWh';
                        return `${p.seriesName}: ${p.value.toFixed(2)} ${unit}`;
                    }).join('<br/>');
                }
            },
            legend: {
                textStyle: { color: '#FFFFFF' }
            },
            xAxis: {
                type: 'category',
                data: ['Jan', 'Feb', 'Mär', 'Apr', 'Mai', 'Jun', 'Jul', 'Aug', 'Sep', 'Okt', 'Nov', 'Dez'],
                axisLabel: { color: '#FFFFFF' }
            },
            yAxis: [
                {
                    type: 'value',
                    name: 'Kosten / Verbrauch',
                    axisLabel: { color: '#FFFFFF' },
                    nameTextStyle: { color: '#FFFFFF' },
                    splitLine: { show: true, lineStyle: { color: '#525252' } },
                    axisLine: { lineStyle: { color: '#ccc' } }
                },
                {
                    type: 'value',
                    name: 'Preis',
                    position: 'right',
                    axisLabel: { color: '#FFFFFF' },
                    nameTextStyle: { color: '#FFFFFF' },
                    splitLine: { show: true, lineStyle: { color: '#525252' } },
                    axisLine: { lineStyle: { color: '#ccc' } }
                }
            ],
            series: [
                { name: 'Kosten (€)', type: 'bar', data: arrCost },
                { name: 'Verbrauch (kWh)', type: 'bar', data: arrCons },
                { name: 'Preis (€/kWh)', type: 'line', yAxisIndex: 1, data: arrPrice }
            ]
        };

        setState(visDP, JSON.stringify(option), true);
        log("Jahreswerte + aktueller Monat + eCharts VIS aktualisiert", "info");

    } catch (e) {
        log("Fehler JSON: " + e, "error");
    }
}

// =================== TRIGGER ===================
updateYearValues();
on({ id: jsonMonthlyDP, change: 'any' }, () => updateYearValues());
on({ id: [dpPriceThisMonth, dpConsThisMonth, dpCostThisMonth], change: 'ne' }, () => updateYearValues());
Monat:
// ============================================================================
// Tibber Daily Übersicht für VIS eCharts
// ----------------------------------------------------------------------------
// - ALLE Daten aus Tibbers jsonDaily
// - Linke Achse: Kosten (€) + Verbrauch (kWh)
// - Rechte Achse: Preis (€/kWh)
// - Schriftfarbe X/Y weiß, Y-Hilfslinien #525252
// - Rechte Y-Achse Maximalwert auf 3 Nachkommastellen
// - Preislinie nicht geglättet
// ============================================================================

const jsonDailyDP = 'tibberlink.0.Homes.xxxxxxxxxxx.Consumption.jsonDaily';
const dpBase = '0_userdata.0.Tibber.Daily.';
const dpDates     = dpBase + 'Dates';
const dpCost      = dpBase + 'Cost';
const dpUsage     = dpBase + 'Usage';
const dpUnitPrice = dpBase + 'UnitPrice';
const dpEchart    = dpBase + 'EchartConfig';

// =================== Hilfsfunktion ===================
function ensureDP(id) {
    if (!existsState(id)) createState(id, '', { type: 'string', read: true, write: true });
}
[dpDates, dpCost, dpUsage, dpUnitPrice, dpEchart].forEach(ensureDP);

// =================== Datum formatieren TT.MM. ===================
function formatDateTTMM(fromStr) {
    const d = new Date(fromStr);
    if (isNaN(d)) return '';
    const day = ('0' + d.getDate()).slice(-2);
    const month = ('0' + (d.getMonth() + 1)).slice(-2);
    return `${day}.${month}`;
}

// =================== Hauptfunktion ===================
async function buildTibberDailyChart() {
    const raw = await getStateAsync(jsonDailyDP);
    if (!raw || !raw.val) {
        log('⚠ jsonDaily leer oder nicht verfügbar', 'warn');
        return;
    }

    let daily;
    try {
        daily = JSON.parse(raw.val);
        if (!Array.isArray(daily)) {
            log('❌ JSON ist kein Array', 'error');
            return;
        }
    } catch (e) {
        log('❌ Fehler beim Parsen von jsonDaily: ' + e, 'error');
        return;
    }

    const dates = [];
    const cost = [];
    const usage = [];
    const price = [];

    daily.forEach(entry => {
        dates.push(formatDateTTMM(entry.from));
        cost.push(Number(entry.totalCost || 0).toFixed(2));
        usage.push(Number(entry.consumption || 0).toFixed(2));
        price.push(Number(entry.unitPrice || 0).toFixed(3));
    });

    // Datenpunkte aktualisieren
    setState(dpDates, JSON.stringify(dates), true);
    setState(dpCost, JSON.stringify(cost), true);
    setState(dpUsage, JSON.stringify(usage), true);
    setState(dpUnitPrice, JSON.stringify(price), true);

    // Rechte Y-Achse Maximalwert für Preis berechnen (3 Nachkommastellen)
    let maxPrice = Math.max(...price.map(p => Number(p))) * 1.1; // 10% Puffer
    maxPrice = Number(maxPrice.toFixed(3));

    // Linke Achse: Maximalwert für Kosten und Verbrauch
    const maxLeft = Math.max(
        ...cost.map(c => Number(c)),
        ...usage.map(u => Number(u))
    ) * 1.1;

    const echartConfig = {
        textStyle: { color: '#FFFFFF' },
        tooltip: {
            trigger: 'axis',
            textStyle: { color: '#525252' },
            formatter: function(params) {
                const day = params[0].axisValue;
                const kosten = params.find(p => p.seriesName === 'Kosten (€)')?.value || 0;
                const verbrauch = params.find(p => p.seriesName === 'Verbrauch (kWh)')?.value || 0;
                const preis = params.find(p => p.seriesName === 'Preis (€/kWh)')?.value || 0;
                return `${day} → Kosten: ${Number(kosten).toFixed(2)} € | Verbrauch: ${Number(verbrauch).toFixed(2)} kWh | Preis: ${Number(preis).toFixed(3)} €/kWh`;
            }
        },
        legend: { textStyle: { color: '#FFFFFF' }, data: ['Kosten (€)', 'Verbrauch (kWh)', 'Preis (€/kWh)'] },
        xAxis: { type: 'category', data: dates, axisLabel: { color: '#FFFFFF' } },
        yAxis: [
            {
                type: 'value',
                name: 'Kosten / Verbrauch',
                min: 0,
                max: maxLeft,
                axisLabel: { color: '#FFFFFF' },
                nameTextStyle: { color: '#FFFFFF', align: 'center' }, // linksbündig
                splitLine: { show: true, lineStyle: { color: '#525252' } }
            },
            {
                type: 'value',
                name: 'Preis',
                position: 'right',
                min: 0,
                max: maxPrice,
                axisLabel: {
                    color: '#FFFFFF',
                    formatter: function(value) { return Number(value).toFixed(3) + ' €/kWh'; }
                },
                nameTextStyle: { color: '#FFFFFF' },
                splitLine: { show: true, lineStyle: { color: '#525252' } }
            }
        ],
        series: [
            { name: 'Kosten (€)', type: 'bar', data: cost, yAxisIndex: 0 },
            { name: 'Verbrauch (kWh)', type: 'bar', data: usage, yAxisIndex: 0 },
            { name: 'Preis (€/kWh)', type: 'line', data: price, yAxisIndex: 1 } // nicht geglättet
        ]
    };

    setState(dpEchart, JSON.stringify(echartConfig), true);
    log('✔ Tibber Daily für VIS aktualisiert – ' + daily.length + ' Einträge');
}

// =================== Trigger ===================
on({ id: jsonDailyDP, change: 'any' }, () => buildTibberDailyChart());
buildTibberDailyChart();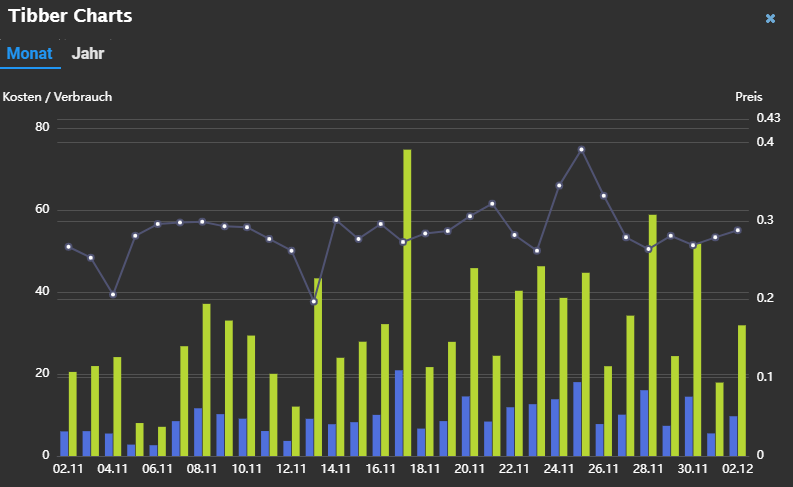
-
Hi, falls jemand Interesse hat hier mal zwei Diagramme zum Nachbauen für flexcharts
Kosten:
// ============================================================================
// TIBBER – Monats- & Jahresauswertung
// Durchschnittspreis aus unitPrice (verbrauchsgewichtet)
// ============================================================================


// =================== KONFIG ===================

// --- Monat (jsonDaily) ---
const jsonDP_Month      = 'tibberlink.0.Homes.8f8a4278-17b9-48fb-b725-b60bd1485ac6.Consumption.jsonDaily';
const resultCostDP      = '0_userdata.0.Tibber.SumUnitCostThisMonth';
const resultConsDP      = '0_userdata.0.Tibber.SumConsumptionThisMonth';
const resultPriceDP     = '0_userdata.0.Tibber.AvgUnitPriceThisMonth';

// --- Jahr (jsonMonthly + aktueller Monat aus jsonDaily) ---
const jsonDP_Year       = 'tibberlink.0.Homes.8f8a4278-17b9-48fb-b725-b60bd1485ac6.Consumption.jsonMonthly';
const resultCostYearDP  = '0_userdata.0.Tibber.SumUnitCostThisYear';
const resultConsYearDP  = '0_userdata.0.Tibber.SumConsumptionThisYear';
const resultPriceYearDP = '0_userdata.0.Tibber.AvgUnitPriceThisYear';


// =================== FUNKTION (MONAT) ===================

function calcMonthValues() {
    try {
        const raw = getState(jsonDP_Month)?.val;
        if (!raw) return;

        const data = JSON.parse(raw);
        if (!Array.isArray(data)) return;

        let sumCons  = 0;
        let sumCost  = 0;
        let sumPrice = 0; // unitPrice * consumption

        const now = new Date();
        const y = now.getFullYear();
        const m = now.getMonth();

        data.forEach(entry => {
            if (!entry.from) return;

            const d = new Date(entry.from);
            if (d.getFullYear() === y && d.getMonth() === m) {

                const cons  = Number(entry.consumption);
                const cost  = Number(entry.totalCost);
                const price = Number(entry.unitPrice);

                if (!isNaN(cons)) {
                    sumCons += cons;
                    if (!isNaN(price)) sumPrice += cons * price;
                }
                if (!isNaN(cost)) sumCost += cost;
            }
        });

        const avgUnitPrice = sumCons > 0 ? sumPrice / sumCons : 0;

        setState(resultConsDP,  Number(sumCons.toFixed(3)), true);
        setState(resultCostDP,  Number(sumCost.toFixed(4)), true);
        setState(resultPriceDP, Number(avgUnitPrice.toFixed(4)), true);

        log(`📅 Monat: ${sumCons.toFixed(3)} kWh | ${sumCost.toFixed(2)} € | Ø ${avgUnitPrice.toFixed(4)} €/kWh`, 'info');

    } catch (e) {
        log(`❌ Fehler Monatsberechnung: ${e}`, 'error');
    }
}


// =================== FUNKTION (JAHR) ===================

function calcYearValues() {
    try {
        const rawYear  = getState(jsonDP_Year)?.val;
        const rawMonth = getState(jsonDP_Month)?.val;

        if (!rawYear) return;

        const dataYear  = JSON.parse(rawYear);
        const dataMonth = rawMonth ? JSON.parse(rawMonth) : [];

        let sumCons  = 0;
        let sumCost  = 0;
        let sumPrice = 0;

        const now = new Date();
        const y = now.getFullYear();
        const m = now.getMonth();

        // --- Monate aus jsonMonthly (ohne aktuellen Monat) ---
        if (Array.isArray(dataYear)) {
            dataYear.forEach(entry => {
                if (!entry.from) return;

                const d = new Date(entry.from);
                if (d.getFullYear() === y && d.getMonth() !== m) {

                    const cons  = Number(entry.consumption);
                    const cost  = Number(entry.totalCost);
                    const price = Number(entry.unitPrice);

                    if (!isNaN(cons)) {
                        sumCons += cons;
                        if (!isNaN(price)) sumPrice += cons * price;
                    }
                    if (!isNaN(cost)) sumCost += cost;
                }
            });
        }

        // --- Aktueller Monat aus jsonDaily ---
        if (Array.isArray(dataMonth)) {
            dataMonth.forEach(entry => {
                if (!entry.from) return;

                const d = new Date(entry.from);
                if (d.getFullYear() === y && d.getMonth() === m) {

                    const cons  = Number(entry.consumption);
                    const cost  = Number(entry.totalCost);
                    const price = Number(entry.unitPrice);

                    if (!isNaN(cons)) {
                        sumCons += cons;
                        if (!isNaN(price)) sumPrice += cons * price;
                    }
                    if (!isNaN(cost)) sumCost += cost;
                }
            });
        }

        const avgUnitPrice = sumCons > 0 ? sumPrice / sumCons : 0;

        setState(resultConsYearDP,  Number(sumCons.toFixed(3)), true);
        setState(resultCostYearDP,  Number(sumCost.toFixed(4)), true);
        setState(resultPriceYearDP, Number(avgUnitPrice.toFixed(4)), true);

        log(`📆 Jahr ${y}: ${sumCons.toFixed(3)} kWh | ${sumCost.toFixed(2)} € | Ø ${avgUnitPrice.toFixed(4)} €/kWh`, 'info');

    } catch (e) {
        log(`❌ Fehler Jahresberechnung: ${e}`, 'error');
    }
}


// =================== TRIGGER ===================

// beim Start
calcMonthValues();
calcYearValues();

// jsonDaily ändert sich
on({ id: jsonDP_Month, change: 'ne' }, () => {
    calcMonthValues();
    calcYearValues();   // wichtig!
});

// jsonMonthly ändert sich
on({ id: jsonDP_Year, change: 'ne' }, () => {
    calcYearValues();
});
Jahr:
// ============================================================================
// Tibber Jahresübersicht + eCharts VIS-Widget
// ----------------------------------------------------------------------------
// - Erstellt 12 Datenpunkte für Kosten, Verbrauch, Preis
// - Liest tibber Monthly JSON aus
// - Ergänzt/überschreibt aktuellen Monat aus 0_userdata-Datenpunkten
// - Erstellt eCharts-Konfiguration für VIS
// - Tooltip mit 2 Nachkommastellen
// ============================================================================

// =================== KONFIG ===================
const jsonMonthlyDP = 'tibberlink.0.Homes.xxxxxxxxxxxxx.Consumption.jsonMonthly';
const rootDP        = '0_userdata.0.Tibber.Jahreswerte';
const visDP         = `${rootDP}.eCharts_Monatsbalken`;

// Userdata aktuelle Monatswerte
const dpPriceThisMonth = '0_userdata.0.Tibber.AvgUnitPriceThisMonth';
const dpConsThisMonth  = '0_userdata.0.Tibber.SumConsumptionThisMonth';
const dpCostThisMonth  = '0_userdata.0.Tibber.SumUnitCostThisMonth';

// =================== 12 Monats-Datenpunkte erzeugen ===================
function createMonthDPs() {
    for (let m = 1; m <= 12; m++) {
        createState(`${rootDP}.Cost.M${m}`, 0,  { name: `Kosten Monat ${m}`,       type: 'number', unit: '€',     role: 'value' });
        createState(`${rootDP}.Cons.M${m}`, 0,  { name: `Verbrauch Monat ${m}`,    type: 'number', unit: 'kWh',   role: 'value' });
        createState(`${rootDP}.Price.M${m}`,0,  { name: `Durchschnittspreis M${m}`, type: 'number', unit: '€/kWh', role: 'value' });
    }
    createState(visDP, '', { name: 'eCharts Config Monatsbalken', type: 'string', role: 'text' });
}
createMonthDPs();


// =================== Hauptfunktion ===================
function updateYearValues() {
    try {
        const raw = getState(jsonMonthlyDP).val;
        if (!raw) return log("Keine Monatsdaten vorhanden", "warn");

        const data = JSON.parse(raw);
        const currentYear  = new Date().getFullYear();
        const currentMonth = new Date().getMonth() + 1;

        let arrCost  = Array(12).fill(0);
        let arrCons  = Array(12).fill(0);
        let arrPrice = Array(12).fill(0);

        // ========== JSON durchlaufen ==========
        data.forEach(entry => {
            if (!entry.from) return;

            const d = new Date(entry.from);
            const year  = d.getFullYear();
            const month = d.getMonth() + 1;

            if (year !== currentYear) return;

            const cost  = parseFloat(entry.totalCost)   || 0;
            const cons  = parseFloat(entry.consumption) || 0;
            const price = parseFloat(entry.unitPrice)   || 0;

            arrCost[month - 1]  = parseFloat(cost.toFixed(2));
            arrCons[month - 1]  = parseFloat(cons.toFixed(2));
            arrPrice[month - 1] = parseFloat(price.toFixed(2));

            setState(`${rootDP}.Cost.M${month}`,  cost,  true);
            setState(`${rootDP}.Cons.M${month}`,  cons,  true);
            setState(`${rootDP}.Price.M${month}`, price, true);
        });

        // =============================================================
        //  **AKTUELLEN MONAT MIT USERDATA ÜBERSCHREIBEN**
        // =============================================================
        const uPrice = parseFloat(getState(dpPriceThisMonth).val) || 0;
        const uCons  = parseFloat(getState(dpConsThisMonth).val)  || 0;
        const uCost  = parseFloat(getState(dpCostThisMonth).val)  || 0;

        arrCost[currentMonth - 1]  = parseFloat(uCost.toFixed(2));
        arrCons[currentMonth - 1]  = parseFloat(uCons.toFixed(2));
        arrPrice[currentMonth - 1] = parseFloat(uPrice.toFixed(2));

        setState(`${rootDP}.Cost.M${currentMonth}`,  uCost,  true);
        setState(`${rootDP}.Cons.M${currentMonth}`,  uCons,  true);
        setState(`${rootDP}.Price.M${currentMonth}`, uPrice, true);

        // =====================================================================
        // eCharts VIS-Konfiguration
        // =====================================================================
        const option = {
            textStyle: { color: '#FFFFFF' },
            tooltip: {
                trigger: 'axis',
                textStyle: { color: '#525252' },
                formatter: function(params) {
                    return params.map(p => {
                        let unit = '€/kWh';
                        if (p.seriesName.includes('€')) unit = '€';
                        else if (p.seriesName.includes('kWh')) unit = 'kWh';
                        return `${p.seriesName}: ${p.value.toFixed(2)} ${unit}`;
                    }).join('<br/>');
                }
            },
            legend: {
                textStyle: { color: '#FFFFFF' }
            },
            xAxis: {
                type: 'category',
                data: ['Jan', 'Feb', 'Mär', 'Apr', 'Mai', 'Jun', 'Jul', 'Aug', 'Sep', 'Okt', 'Nov', 'Dez'],
                axisLabel: { color: '#FFFFFF' }
            },
            yAxis: [
                {
                    type: 'value',
                    name: 'Kosten / Verbrauch',
                    axisLabel: { color: '#FFFFFF' },
                    nameTextStyle: { color: '#FFFFFF' },
                    splitLine: { show: true, lineStyle: { color: '#525252' } },
                    axisLine: { lineStyle: { color: '#ccc' } }
                },
                {
                    type: 'value',
                    name: 'Preis',
                    position: 'right',
                    axisLabel: { color: '#FFFFFF' },
                    nameTextStyle: { color: '#FFFFFF' },
                    splitLine: { show: true, lineStyle: { color: '#525252' } },
                    axisLine: { lineStyle: { color: '#ccc' } }
                }
            ],
            series: [
                { name: 'Kosten (€)', type: 'bar', data: arrCost },
                { name: 'Verbrauch (kWh)', type: 'bar', data: arrCons },
                { name: 'Preis (€/kWh)', type: 'line', yAxisIndex: 1, data: arrPrice }
            ]
        };

        setState(visDP, JSON.stringify(option), true);
        log("Jahreswerte + aktueller Monat + eCharts VIS aktualisiert", "info");

    } catch (e) {
        log("Fehler JSON: " + e, "error");
    }
}

// =================== TRIGGER ===================
updateYearValues();
on({ id: jsonMonthlyDP, change: 'any' }, () => updateYearValues());
on({ id: [dpPriceThisMonth, dpConsThisMonth, dpCostThisMonth], change: 'ne' }, () => updateYearValues());
Monat:
// ============================================================================ // Tibber Daily Übersicht für VIS eCharts // ---------------------------------------------------------------------------- // - ALLE Daten aus Tibbers jsonDaily // - Linke Achse: Kosten (€) + Verbrauch (kWh) // - Rechte Achse: Preis (€/kWh) // - Schriftfarbe X/Y weiß, Y-Hilfslinien #525252 // - Rechte Y-Achse Maximalwert auf 3 Nachkommastellen // - Preislinie nicht geglättet // ============================================================================ const jsonDailyDP = 'tibberlink.0.Homes.xxxxxxxxxxx.Consumption.jsonDaily'; const dpBase = '0_userdata.0.Tibber.Daily.'; const dpDates = dpBase + 'Dates'; const dpCost = dpBase + 'Cost'; const dpUsage = dpBase + 'Usage'; const dpUnitPrice = dpBase + 'UnitPrice'; const dpEchart = dpBase + 'EchartConfig'; // =================== Hilfsfunktion =================== function ensureDP(id) { if (!existsState(id)) createState(id, '', { type: 'string', read: true, write: true }); } [dpDates, dpCost, dpUsage, dpUnitPrice, dpEchart].forEach(ensureDP); // =================== Datum formatieren TT.MM. =================== function formatDateTTMM(fromStr) { const d = new Date(fromStr); if (isNaN(d)) return ''; const day = ('0' + d.getDate()).slice(-2); const month = ('0' + (d.getMonth() + 1)).slice(-2); return `${day}.${month}`; } // =================== Hauptfunktion =================== async function buildTibberDailyChart() { const raw = await getStateAsync(jsonDailyDP); if (!raw || !raw.val) { log('⚠ jsonDaily leer oder nicht verfügbar', 'warn'); return; } let daily; try { daily = JSON.parse(raw.val); if (!Array.isArray(daily)) { log('❌ JSON ist kein Array', 'error'); return; } } catch (e) { log('❌ Fehler beim Parsen von jsonDaily: ' + e, 'error'); return; } const dates = []; const cost = []; const usage = []; const price = []; daily.forEach(entry => { dates.push(formatDateTTMM(entry.from)); cost.push(Number(entry.totalCost || 0).toFixed(2)); usage.push(Number(entry.consumption || 0).toFixed(2)); price.push(Number(entry.unitPrice || 0).toFixed(3)); }); // Datenpunkte aktualisieren setState(dpDates, JSON.stringify(dates), true); setState(dpCost, JSON.stringify(cost), true); setState(dpUsage, JSON.stringify(usage), true); setState(dpUnitPrice, JSON.stringify(price), true); // Rechte Y-Achse Maximalwert für Preis berechnen (3 Nachkommastellen) let maxPrice = Math.max(...price.map(p => Number(p))) * 1.1; // 10% Puffer maxPrice = Number(maxPrice.toFixed(3)); // Linke Achse: Maximalwert für Kosten und Verbrauch const maxLeft = Math.max( ...cost.map(c => Number(c)), ...usage.map(u => Number(u)) ) * 1.1; const echartConfig = { textStyle: { color: '#FFFFFF' }, tooltip: { trigger: 'axis', textStyle: { color: '#525252' }, formatter: function(params) { const day = params[0].axisValue; const kosten = params.find(p => p.seriesName === 'Kosten (€)')?.value || 0; const verbrauch = params.find(p => p.seriesName === 'Verbrauch (kWh)')?.value || 0; const preis = params.find(p => p.seriesName === 'Preis (€/kWh)')?.value || 0; return `${day} → Kosten: ${Number(kosten).toFixed(2)} € | Verbrauch: ${Number(verbrauch).toFixed(2)} kWh | Preis: ${Number(preis).toFixed(3)} €/kWh`; } }, legend: { textStyle: { color: '#FFFFFF' }, data: ['Kosten (€)', 'Verbrauch (kWh)', 'Preis (€/kWh)'] }, xAxis: { type: 'category', data: dates, axisLabel: { color: '#FFFFFF' } }, yAxis: [ { type: 'value', name: 'Kosten / Verbrauch', min: 0, max: maxLeft, axisLabel: { color: '#FFFFFF' }, nameTextStyle: { color: '#FFFFFF', align: 'center' }, // linksbündig splitLine: { show: true, lineStyle: { color: '#525252' } } }, { type: 'value', name: 'Preis', position: 'right', min: 0, max: maxPrice, axisLabel: { color: '#FFFFFF', formatter: function(value) { return Number(value).toFixed(3) + ' €/kWh'; } }, nameTextStyle: { color: '#FFFFFF' }, splitLine: { show: true, lineStyle: { color: '#525252' } } } ], series: [ { name: 'Kosten (€)', type: 'bar', data: cost, yAxisIndex: 0 }, { name: 'Verbrauch (kWh)', type: 'bar', data: usage, yAxisIndex: 0 }, { name: 'Preis (€/kWh)', type: 'line', data: price, yAxisIndex: 1 } // nicht geglättet ] }; setState(dpEchart, JSON.stringify(echartConfig), true); log('✔ Tibber Daily für VIS aktualisiert – ' + daily.length + ' Einträge'); } // =================== Trigger =================== on({ id: jsonDailyDP, change: 'any' }, () => buildTibberDailyChart()); buildTibberDailyChart();@lesiflo sagte in TibberLink Adapter:
Wo kommen denn diese Datenpunkte her bzw. von wo werden sie geschrieben?
// Userdata aktuelle Monatswerte
const dpPriceThisMonth = '0_userdata.0.Tibber.AvgUnitPriceThisMonth';
const dpConsThisMonth  = '0_userdata.0.Tibber.SumConsumptionThisMonth';
const dpCostThisMonth  = '0_userdata.0.Tibber.SumUnitCostThisMonth';
Gruß
Michael
-
@lesiflo sagte in TibberLink Adapter:
Wo kommen denn diese Datenpunkte her bzw. von wo werden sie geschrieben?
// Userdata aktuelle Monatswerte
const dpPriceThisMonth = '0_userdata.0.Tibber.AvgUnitPriceThisMonth';
const dpConsThisMonth  = '0_userdata.0.Tibber.SumConsumptionThisMonth';
const dpCostThisMonth  = '0_userdata.0.Tibber.SumUnitCostThisMonth';
Gruß
Michael
@Modulo-N sagte in TibberLink Adapter:
@lesiflo sagte in TibberLink Adapter:
Wo kommen denn diese Datenpunkte her bzw. von wo werden sie geschrieben?
// Userdata aktuelle Monatswerte
const dpPriceThisMonth = '0_userdata.0.Tibber.AvgUnitPriceThisMonth';
const dpConsThisMonth  = '0_userdata.0.Tibber.SumConsumptionThisMonth';
const dpCostThisMonth  = '0_userdata.0.Tibber.SumUnitCostThisMonth';
Gruß
Michael
Da fehlte noch ein Script (Kosten). Hab's oben eingefügt
-
... Kann gelöscht werden...
-
@reblausgt Mit v0.7.0 ist es in Flexcharts nun möglich, Charts automatisch neu aufzubauen, wenn sich der State des Charts geändert hat. Das Verfahren nennt sich SSE (Server Sent Events). Aktiviert wird es denkbar einfach, indem ein
&ssean den html-Aufruf anhängt. Details sind im Readme beschrieben.Die Version ist in NPM und im Beta-Repo verfügbar. Ab 26. April auch im Stable.
-
@ReblausGT Super! Ich haben eben ein Release 0.7.1 gemacht. SSE funktioniert jetzt "in place", d.h. bei Datenänderungen werden nur die Daten per setOption aktualisiert und nicht mehr das ganze Diagramm neu aufgebaut. Dadurch funktionieren Animationen und Änderungen bleiben erhalten. Z.B. wenn der Anwender eine Datenreihe ausgeblendet hat, bleibt die nach dem Datenupdate ausgeblendet.
-
Hallo,
seit gestern funktioniert mein Tibber Adapter nicht mehr.
Auch eine neue Installation des Adapters mit neuem Token zeigte keine Wirkung.
Fehlermeldungen:
tibberlink.0 2026-05-17 11:10:33.649 error Error (Unknown Status) occurred during: -generate FlexChart JSON - : Cannot read properties of null (reading 'length')
tibberlink.0 2026-05-17 11:10:33.730 error Error (Unknown Status) occurred during: -force pull of prices today- : Got invalid data structure from Tibber [you might not have a valid (or fully confirmed) contract]
Hey! Du scheinst an dieser Unterhaltung interessiert zu sein, hast aber noch kein Konto.
Hast du es satt, bei jedem Besuch durch die gleichen Beiträge zu scrollen? Wenn du dich für ein Konto anmeldest, kommst du immer genau dorthin zurück, wo du zuvor warst, und kannst dich über neue Antworten benachrichtigen lassen (entweder per E-Mail oder Push-Benachrichtigung). Du kannst auch Lesezeichen speichern und Beiträge positiv bewerten, um anderen Community-Mitgliedern deine Wertschätzung zu zeigen.
Mit deinem Input könnte dieser Beitrag noch besser werden 💗
Registrieren Anmelden425
Online33.0k
Benutzer83.4k
Themen1.3m
Beiträge