

HowTo: Zusatz-Programme fuer jarvis v3
-
@mcu said in HowTo: Zusatz-Programme fuer jarvis v3:
Welche Einheit bei der BoostTime?
'min' = Minuten
-
@mcu said in HowTo: Zusatz-Programme fuer jarvis v3:
Bereich ist dann von 3V - 2.4V -> 100% - 0%?
Also so hab ich es aus der Doku rausgelesen, wobei die LowBat Schwelle wie gesagt in der CCU eingestellt werden kann (Standardmäßig ist das aber 2,4V).
Wir sollten es dabei belassen, 3V - 2.4V = 100% - 0%
Sonst ist mir erstmal nix mehr eingefallen.
-
@icebear Bitte durchlesen.
https://mcuiobroker.gitbook.io/jarvis-infos/jarvis-v3/besonderheiten-v3/scripts-3.1.x-pro/sonstige-skripte/kombinationsskripte/thermostat-gauge-mit-historyFehlen Infos?
NUC i7 64GB mit Proxmox ---- Jarvis Infos Aktualisierungen der Doku auf Instagram verfolgen -> mcuiobroker Instagram
Wenn Euch mein Vorschlag geholfen hat, bitte rechts "^" klicken. -
-
@meikie Nimm das Log raus da ist deine Id drin.
Die Fehler sind sehr wahrscheinlich da, weil bestimmte Daten jetzt nicht verfügbar sind und erst ab 14:00 Uhr eingestellt werden.
Melde Dich heute Nachmittag, wie es da aussieht.@mcu Also ich habe jetzt heute mal wieder probiert. In der Konsole sind immer noch folgende Warnungen:
12:58:41.884	warn	javascript.0 (1020035) at getTibberData (script.js.Strom.tibberHTML:231:43)
12:58:41.884	warn	javascript.0 (1020035) at Object.<anonymous> (script.js.Strom.tibberHTML:96:5)
12:58:41.888	warn	javascript.0 (1020035) at getTibberData (script.js.Strom.tibberHTML:233:43)
12:58:41.888	warn	javascript.0 (1020035) at Object.<anonymous> (script.js.Strom.tibberHTML:96:5)
12:58:41.890	warn	javascript.0 (1020035) at getTibberData (script.js.Strom.tibberHTML:234:44)
12:58:41.891	warn	javascript.0 (1020035) at Object.<anonymous> (script.js.Strom.tibberHTML:96:5)
12:58:41.893	warn	javascript.0 (1020035) at getTibberData (script.js.Strom.tibberHTML:235:41)
12:58:41.893	warn	javascript.0 (1020035) at Object.<anonymous> (script.js.Strom.tibberHTML:96:5)
12:58:41.895	warn	javascript.0 (1020035) at getTibberData (script.js.Strom.tibberHTML:243:43)
12:58:41.896	warn	javascript.0 (1020035) at Object.<anonymous> (script.js.Strom.tibberHTML:96:5)
12:58:41.898	warn	javascript.0 (1020035) at getTibberData (script.js.Strom.tibberHTML:245:43)
12:58:41.898	warn	javascript.0 (1020035) at Object.<anonymous> (script.js.Strom.tibberHTML:96:5)
12:58:41.900	warn	javascript.0 (1020035) at getTibberData (script.js.Strom.tibberHTML:246:44)
12:58:41.900	warn	javascript.0 (1020035) at Object.<anonymous> (script.js.Strom.tibberHTML:96:5)
12:58:41.902	warn	javascript.0 (1020035) at getTibberData (script.js.Strom.tibberHTML:247:41)
12:58:41.902	warn	javascript.0 (1020035) at Object.<anonymous> (script.js.Strom.tibberHTML:96:5)
12:58:41.908	warn	javascript.0 (1020035) at setHTML (script.js.Strom.tibberHTML:313:20)
12:58:41.908	warn	javascript.0 (1020035) at getTibberData (script.js.Strom.tibberHTML:266:13)
12:58:41.908	warn	javascript.0 (1020035) at Object.<anonymous> (script.js.Strom.tibberHTML:96:5)
12:58:41.910	warn	javascript.0 (1020035) at setHTML (script.js.Strom.tibberHTML:316:20)
12:58:41.910	warn	javascript.0 (1020035) at getTibberData (script.js.Strom.tibberHTML:266:13)
12:58:41.910	warn	javascript.0 (1020035) at Object.<anonymous> (script.js.Strom.tibberHTML:96:5)
12:58:41.912	warn	javascript.0 (1020035) at setHTML (script.js.Strom.tibberHTML:317:23)
12:58:41.913	warn	javascript.0 (1020035) at getTibberData (script.js.Strom.tibberHTML:266:13)
12:58:41.913	warn	javascript.0 (1020035) at Object.<anonymous> (script.js.Strom.tibberHTML:96:5)
12:58:41.915	warn	javascript.0 (1020035) at setHTML (script.js.Strom.tibberHTML:319:23)
12:58:41.915	warn	javascript.0 (1020035) at getTibberData (script.js.Strom.tibberHTML:266:13)
12:58:41.915	warn	javascript.0 (1020035) at Object.<anonymous> (script.js.Strom.tibberHTML:96:5)
12:58:41.922	warn	javascript.0 (1020035) at getTibberData (script.js.Strom.tibberHTML:231:43)
12:58:41.922	warn	javascript.0 (1020035) at Object.<anonymous> (script.js.Strom.tibberHTML:96:5)
12:58:41.924	warn	javascript.0 (1020035) at getTibberData (script.js.Strom.tibberHTML:233:43)
12:58:41.924	warn	javascript.0 (1020035) at Object.<anonymous> (script.js.Strom.tibberHTML:96:5)
12:58:41.926	warn	javascript.0 (1020035) at getTibberData (script.js.Strom.tibberHTML:234:44)
12:58:41.927	warn	javascript.0 (1020035) at Object.<anonymous> (script.js.Strom.tibberHTML:96:5)
12:58:41.929	warn	javascript.0 (1020035) at getTibberData (script.js.Strom.tibberHTML:235:41)
12:58:41.930	warn	javascript.0 (1020035) at Object.<anonymous> (script.js.Strom.tibberHTML:96:5)
12:58:41.933	warn	javascript.0 (1020035) at getTibberData (script.js.Strom.tibberHTML:243:43)
12:58:41.934	warn	javascript.0 (1020035) at Object.<anonymous> (script.js.Strom.tibberHTML:96:5)
12:58:41.937	warn	javascript.0 (1020035) at getTibberData (script.js.Strom.tibberHTML:245:43)
12:58:41.938	warn	javascript.0 (1020035) at Object.<anonymous> (script.js.Strom.tibberHTML:96:5)
12:58:41.941	warn	javascript.0 (1020035) at getTibberData (script.js.Strom.tibberHTML:246:44)
12:58:41.941	warn	javascript.0 (1020035) at Object.<anonymous> (script.js.Strom.tibberHTML:96:5)
12:58:41.948	warn	javascript.0 (1020035) at getTibberData (script.js.Strom.tibberHTML:247:41)
12:58:41.948	warn	javascript.0 (1020035) at Object.<anonymous> (script.js.Strom.tibberHTML:96:5)
12:58:41.952	warn	javascript.0 (1020035) at setHTML (script.js.Strom.tibberHTML:313:20)
12:58:41.952	warn	javascript.0 (1020035) at getTibberData (script.js.Strom.tibberHTML:266:13)
12:58:41.952	warn	javascript.0 (1020035) at Object.<anonymous> (script.js.Strom.tibberHTML:96:5)
12:58:41.954	warn	javascript.0 (1020035) at setHTML (script.js.Strom.tibberHTML:316:20)
12:58:41.954	warn	javascript.0 (1020035) at getTibberData (script.js.Strom.tibberHTML:266:13)
12:58:41.954	warn	javascript.0 (1020035) at Object.<anonymous> (script.js.Strom.tibberHTML:96:5)
12:58:41.956	warn	javascript.0 (1020035) at setHTML (script.js.Strom.tibberHTML:317:23)
12:58:41.956	warn	javascript.0 (1020035) at getTibberData (script.js.Strom.tibberHTML:266:13)
12:58:41.956	warn	javascript.0 (1020035) at Object.<anonymous> (script.js.Strom.tibberHTML:96:5)
12:58:41.958	warn	javascript.0 (1020035) at setHTML (script.js.Strom.tibberHTML:319:23)
12:58:41.958	warn	javascript.0 (1020035) at getTibberData (script.js.Strom.tibberHTML:266:13)
12:58:41.959	warn	javascript.0 (1020035) at Object.<anonymous> (script.js.Strom.tibberHTML:96:5)
Unter Objekten ist im
0_userdata.0.Strom.tibberHistory.htmlToday etwas drin.<!DOCTYPE html><html lang="en"><head><meta charset="UTF-8"><meta name="viewport" content="width=device-width, initial-scale=1.0"><title>Tibber-Tageswert</title><script src="https://cdn.jsdelivr.net/npm/echarts@5.4.3/dist/echarts.min.js"></script><script src="https://cdnjs.cloudflare.com/ajax/libs/moment.js/2.29.1/moment.min.js"></script></head><body><div id="chart-container" style="width: 100%; height:400px;"></div><script> var data = [{"time":1704668400000,"value":0.2954,"tax":0.2084,"energy":0.087,"level":"NORMAL"},{"time":1704672000000,"value":0.2922,"tax":0.2079,"energy":0.0843,"level":"NORMAL"},{"time":1704675600000,"value":0.2892,"tax":0.2074,"energy":0.0818,"level":"NORMAL"},{"time":1704679200000,"value":0.286,"tax":0.2069,"energy":0.0791,"level":"NORMAL"},{"time":1704682800000,"value":0.2852,"tax":0.2067,"energy":0.0785,"level":"NORMAL"},{"time":1704686400000,"value":0.2895,"tax":0.2074,"energy":0.0821,"level":"NORMAL"},{"time":1704690000000,"value":0.3041,"tax":0.2098,"energy":0.0943,"level":"NORMAL"},{"time":1704693600000,"value":0.324,"tax":0.2129,"energy":0.1111,"level":"NORMAL"},{"time":1704697200000,"value":0.336,"tax":0.2149,"energy":0.1211,"level":"NORMAL"},{"time":1704700800000,"value":0.3321,"tax":0.2143,"energy":0.1178,"level":"NORMAL"},{"time":1704704400000,"value":0.3235,"tax":0.2129,"energy":0.1106,"level":"NORMAL"},{"time":1704708000000,"value":0.3144,"tax":0.2114,"energy":0.103,"level":"NORMAL"},{"time":1704711600000,"value":0.3055,"tax":0.21,"energy":0.0955,"level":"NORMAL"},{"time":1704715200000,"value":0.302,"tax":0.2094,"energy":0.0926,"level":"NORMAL"},{"time":1704718800000,"value":0.3108,"tax":0.2108,"energy":0.1,"level":"NORMAL"},{"time":1704722400000,"value":0.3203,"tax":0.2123,"energy":0.108,"level":"NORMAL"},{"time":1704726000000,"value":0.3309,"tax":0.214,"energy":0.1169,"level":"NORMAL"},{"time":1704729600000,"value":0.3455,"tax":0.2164,"energy":0.1291,"level":"NORMAL"},{"time":1704733200000,"value":0.3466,"tax":0.2166,"energy":0.13,"level":"EXPENSIVE"},{"time":1704736800000,"value":0.3372,"tax":0.2151,"energy":0.1221,"level":"NORMAL"},{"time":1704740400000,"value":0.3277,"tax":0.2135,"energy":0.1142,"level":"NORMAL"},{"time":1704744000000,"value":0.3142,"tax":0.2114,"energy":0.1028,"level":"NORMAL"},{"time":1704747600000,"value":0.3108,"tax":0.2108,"energy":0.1,"level":"NORMAL"},{"time":1704751200000,"value":0.3007,"tax":0.2092,"energy":0.0915,"level":"NORMAL"}]; var chartContainer = document.getElementById("chart-container"); var myChart = echarts.init(chartContainer); function formatTime(time) { return moment(time).format("HH"); } function calculateArrowPosition(hour){ return (hour / 24) * 100 +1 + "%"; } function updateChart() { var minValue = Math.min.apply(null, data.map(function (item) { return item.value; })); var yAxisMin = -0.02; var maxValue = null; let avgValue = 0.313; var visualMapPieces =[{"gt":0,"lte":0.15,"color":"lightgreen"},{"gt":0.15,"lte":0.22,"color":"green"},{"gt":0.22,"lte":0.29,"color":"yellow"},{"gt":0.29,"lte":0.35,"color":"orange"},{"gt":0.35,"color":"red"}]; var values = data.map(item => (item.value-minValue).toFixed(2)); var maxLineValue = Math.max.apply(null, values); var maxLineIndex = values.indexOf(maxLineValue); var maxLineData = {time:0,value:null}; var currentHour = new Date().getHours() ; var colorStops = []; visualMapPieces.map(piece => { if(piece["lte"] >=yAxisMin && piece["gt"]<=maxValue){ if(piece["gt"]>=yAxisMin){ colorStops.push({ offset: ((piece["gt"]-yAxisMin)/(maxValue-yAxisMin)), color: piece.color }); } if(piece["lte"]<=maxValue){ colorStops.push({ offset: ((piece["lte"]-yAxisMin)/(maxValue-yAxisMin)), color: piece.color }); } if(piece["lte"]>maxValue ){ colorStops.push({ offset: 1, color: piece.color }); }; }else{ if(piece["lte"]>=maxValue && piece["gt"]<=maxValue ){ colorStops.push({ offset: ((piece["lte"]-yAxisMin)/(maxValue-yAxisMin)), color: piece.color }); }else if(piece["lte"]>=maxValue && piece["gt"] <= maxValue){ colorStops.push({ offset: ((piece["lte"]-yAxisMin)/(maxValue-yAxisMin)), color: piece.color }); } }; }); colorStops.push({ offset: 1, color: colorStops[colorStops.length-1].color }); colorStops.splice(0, 0, {offset: 0,color:colorStops[0].color}); myChart.setOption({ title: { text: "Today-Tageswerte", show: false }, visualMap: { type: "piecewise", pieces: visualMapPieces, dimension: 1, showLabel: true, precision: 2, itemWidth: 6, orient: "horizontal", left: "center", calculable: true,selectedMode: "multiple", bottom: 10, text: ["High", "Low"], textStyle: { color: "black" }, }, grid: { right: 10, left: 10, containLabel: true }, areaStyle: { color: colorStops }, toolbox: { feature: { saveAsImage: { backgroundColor: "rgba(38, 37, 37, 1)", title: "Speichern", name: "TibberHTML Today 08.01.2024" }, magicType: { type: ["line", "bar"], title:{ line: "Line-Chart", bar: "Bar-Chart", } }, dataView: { title: "Daten aus der Serie", lang: ["Daten der Kurve", "Schließen", "Aktualisieren"], optionToContent: function (opt) { var table = '<table style="width:100%;"><tbody><tr style="text-align: left;"><th>Stunde</th><th>Wert</th><th>Energie</th><th>Steuer</th><th>Level</th></tr>'; for (var i = 0; i< opt.series[0].data.length;i++) { table += "<tr>"; for(let x =0; x < opt.series[0].data[i].value.length; x++){ if(x==0){ table += "<td>" + ("0"+new Date(opt.series[0].data[i].value[x]).getHours()).slice(-2) + "</td>"; }else{ table += "<td>" + opt.series[0].data[i].value[x] + "</td>"; } } table += "</tr>"; } table += "</tbody></table>"; return table; }, readOnly: true }, } }, xAxis: { type: "time", axisLabel: { show: true, formatter: function (value) { return formatTime(value); } }, splitNumber: 10, }, yAxis: { type: "value", axisLabel: { formatter: function (value) { return value.toFixed(3) + " €"; } }, min: -0.02, max: 0.01, }, series: [{ data: data.map(function (item) { var hour = new Date(item.time).getHours(); return { value: [item.time, item.value, item.energy, item.tax, item.level], symbol: "circle", emphasis: { itemStyle: { color: "white" }, label: { show: true, formatter: function (params) { return params.data.value[1].toFixed(3) + " €"; }, color: "black", fontWeight: "bold", backgroundColor: "white" } } } }), type: "bar", markLine: { symbol: "none", lineStyle: { color: "red", type: "dashed" }, data: [ {yAxis: minValue ,name: "MIN", lineStyle: { color: "lime" },label: { show: false, position: "end", formatter: "Min\n\n"+ minValue.toFixed(3)+" €",textStyle: { fontSize: 12,fontWeight: "bold", color:"white" } } }, {yAxis: maxValue,name: "MAX", lineStyle: { color: "red" },label: { show: false, position: "end", formatter: "Max\n\n"+ maxValue.toFixed(3)+" €",textStyle: { fontSize: 12,fontWeight: "bold", color:"white" } } }, {yAxis: avgValue ,name: "AVG", lineStyle: { color: "blue" },label: { show: false, position: "end", formatter: "Avg\n\n"+ avgValue.toFixed(3)+" €",textStyle: { fontSize: 12,fontWeight: "bold", color:"white" } } } ], } }], tooltip: { trigger: "axis", axisPointer: { type: "shadow" }, textStyle: { fontFamily: "Courier", fontWeight: "bold" }, formatter: function (params) { let time = "Start ab: "+ moment(params[0].axisValue).format("HH:mm")+ " Uhr"; let value = "Preis:    "+params[0].value[1].toFixed(4) + " €"; let energy = "Energie:  "+params[0].value[2].toFixed(4) + " €"; let tax = "Steuer:   "+params[0].value[3].toFixed(4) + " €"; let lev = "Level:    "+ params[0].value[4]; return `${time}<br/>${value}<br/>${energy}<br/>${tax}<br/>${lev}` ; } }, }) } updateChart(); var updateInterval = setInterval(updateChart, 3600000);</script></body></html>Leider wird in Jarvis nichts angezeigt. Woran könnte das liegen?
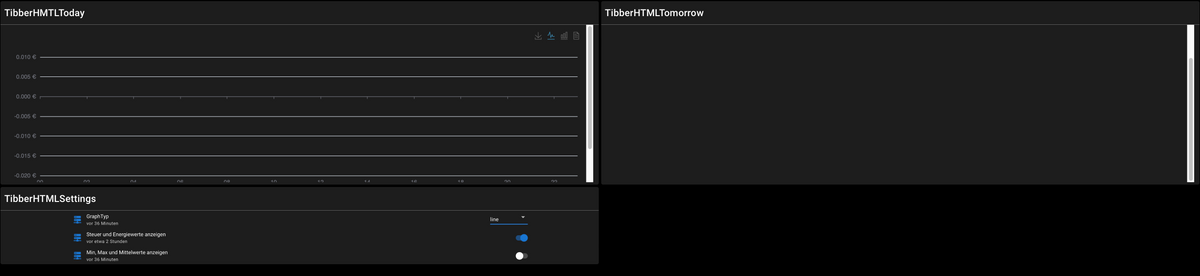
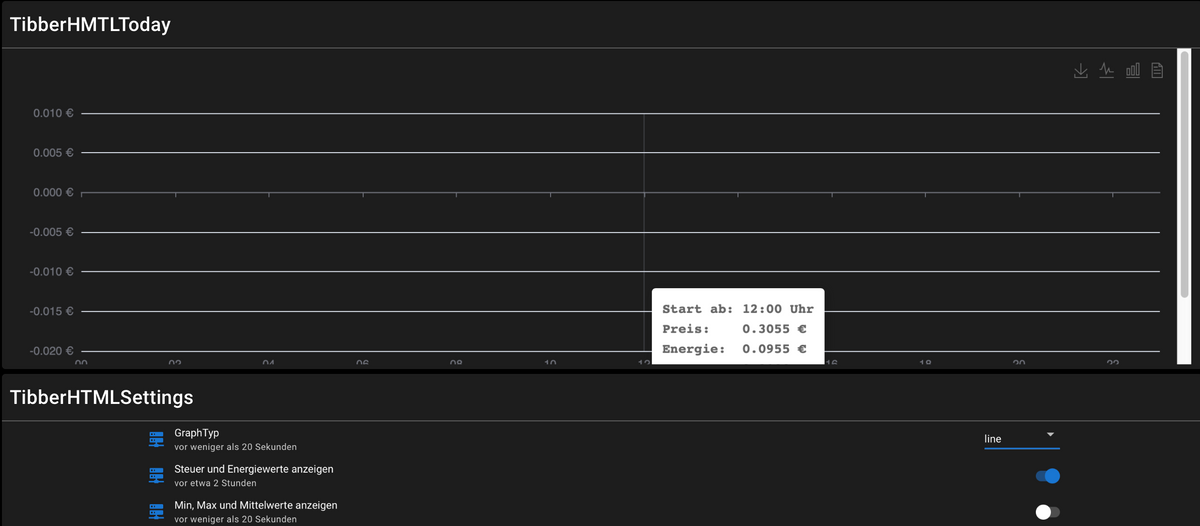
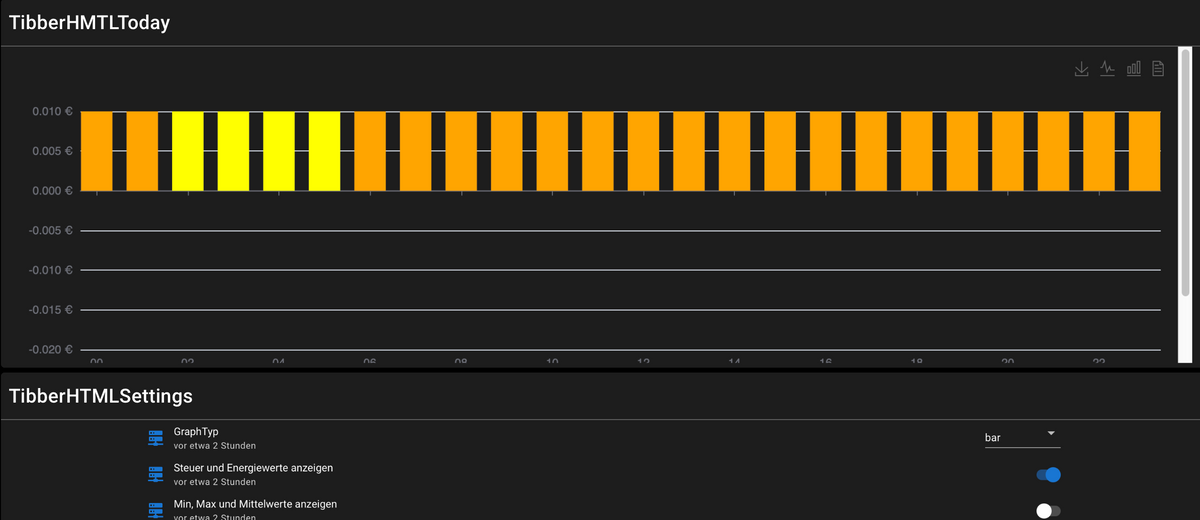
Irgend eine Idee? Vielen Dank.
-
@mcu Also ich habe jetzt heute mal wieder probiert. In der Konsole sind immer noch folgende Warnungen:
12:58:41.884	warn	javascript.0 (1020035) at getTibberData (script.js.Strom.tibberHTML:231:43)
12:58:41.884	warn	javascript.0 (1020035) at Object.<anonymous> (script.js.Strom.tibberHTML:96:5)
12:58:41.888	warn	javascript.0 (1020035) at getTibberData (script.js.Strom.tibberHTML:233:43)
12:58:41.888	warn	javascript.0 (1020035) at Object.<anonymous> (script.js.Strom.tibberHTML:96:5)
12:58:41.890	warn	javascript.0 (1020035) at getTibberData (script.js.Strom.tibberHTML:234:44)
12:58:41.891	warn	javascript.0 (1020035) at Object.<anonymous> (script.js.Strom.tibberHTML:96:5)
12:58:41.893	warn	javascript.0 (1020035) at getTibberData (script.js.Strom.tibberHTML:235:41)
12:58:41.893	warn	javascript.0 (1020035) at Object.<anonymous> (script.js.Strom.tibberHTML:96:5)
12:58:41.895	warn	javascript.0 (1020035) at getTibberData (script.js.Strom.tibberHTML:243:43)
12:58:41.896	warn	javascript.0 (1020035) at Object.<anonymous> (script.js.Strom.tibberHTML:96:5)
12:58:41.898	warn	javascript.0 (1020035) at getTibberData (script.js.Strom.tibberHTML:245:43)
12:58:41.898	warn	javascript.0 (1020035) at Object.<anonymous> (script.js.Strom.tibberHTML:96:5)
12:58:41.900	warn	javascript.0 (1020035) at getTibberData (script.js.Strom.tibberHTML:246:44)
12:58:41.900	warn	javascript.0 (1020035) at Object.<anonymous> (script.js.Strom.tibberHTML:96:5)
12:58:41.902	warn	javascript.0 (1020035) at getTibberData (script.js.Strom.tibberHTML:247:41)
12:58:41.902	warn	javascript.0 (1020035) at Object.<anonymous> (script.js.Strom.tibberHTML:96:5)
12:58:41.908	warn	javascript.0 (1020035) at setHTML (script.js.Strom.tibberHTML:313:20)
12:58:41.908	warn	javascript.0 (1020035) at getTibberData (script.js.Strom.tibberHTML:266:13)
12:58:41.908	warn	javascript.0 (1020035) at Object.<anonymous> (script.js.Strom.tibberHTML:96:5)
12:58:41.910	warn	javascript.0 (1020035) at setHTML (script.js.Strom.tibberHTML:316:20)
12:58:41.910	warn	javascript.0 (1020035) at getTibberData (script.js.Strom.tibberHTML:266:13)
12:58:41.910	warn	javascript.0 (1020035) at Object.<anonymous> (script.js.Strom.tibberHTML:96:5)
12:58:41.912	warn	javascript.0 (1020035) at setHTML (script.js.Strom.tibberHTML:317:23)
12:58:41.913	warn	javascript.0 (1020035) at getTibberData (script.js.Strom.tibberHTML:266:13)
12:58:41.913	warn	javascript.0 (1020035) at Object.<anonymous> (script.js.Strom.tibberHTML:96:5)
12:58:41.915	warn	javascript.0 (1020035) at setHTML (script.js.Strom.tibberHTML:319:23)
12:58:41.915	warn	javascript.0 (1020035) at getTibberData (script.js.Strom.tibberHTML:266:13)
12:58:41.915	warn	javascript.0 (1020035) at Object.<anonymous> (script.js.Strom.tibberHTML:96:5)
12:58:41.922	warn	javascript.0 (1020035) at getTibberData (script.js.Strom.tibberHTML:231:43)
12:58:41.922	warn	javascript.0 (1020035) at Object.<anonymous> (script.js.Strom.tibberHTML:96:5)
12:58:41.924	warn	javascript.0 (1020035) at getTibberData (script.js.Strom.tibberHTML:233:43)
12:58:41.924	warn	javascript.0 (1020035) at Object.<anonymous> (script.js.Strom.tibberHTML:96:5)
12:58:41.926	warn	javascript.0 (1020035) at getTibberData (script.js.Strom.tibberHTML:234:44)
12:58:41.927	warn	javascript.0 (1020035) at Object.<anonymous> (script.js.Strom.tibberHTML:96:5)
12:58:41.929	warn	javascript.0 (1020035) at getTibberData (script.js.Strom.tibberHTML:235:41)
12:58:41.930	warn	javascript.0 (1020035) at Object.<anonymous> (script.js.Strom.tibberHTML:96:5)
12:58:41.933	warn	javascript.0 (1020035) at getTibberData (script.js.Strom.tibberHTML:243:43)
12:58:41.934	warn	javascript.0 (1020035) at Object.<anonymous> (script.js.Strom.tibberHTML:96:5)
12:58:41.937	warn	javascript.0 (1020035) at getTibberData (script.js.Strom.tibberHTML:245:43)
12:58:41.938	warn	javascript.0 (1020035) at Object.<anonymous> (script.js.Strom.tibberHTML:96:5)
12:58:41.941	warn	javascript.0 (1020035) at getTibberData (script.js.Strom.tibberHTML:246:44)
12:58:41.941	warn	javascript.0 (1020035) at Object.<anonymous> (script.js.Strom.tibberHTML:96:5)
12:58:41.948	warn	javascript.0 (1020035) at getTibberData (script.js.Strom.tibberHTML:247:41)
12:58:41.948	warn	javascript.0 (1020035) at Object.<anonymous> (script.js.Strom.tibberHTML:96:5)
12:58:41.952	warn	javascript.0 (1020035) at setHTML (script.js.Strom.tibberHTML:313:20)
12:58:41.952	warn	javascript.0 (1020035) at getTibberData (script.js.Strom.tibberHTML:266:13)
12:58:41.952	warn	javascript.0 (1020035) at Object.<anonymous> (script.js.Strom.tibberHTML:96:5)
12:58:41.954	warn	javascript.0 (1020035) at setHTML (script.js.Strom.tibberHTML:316:20)
12:58:41.954	warn	javascript.0 (1020035) at getTibberData (script.js.Strom.tibberHTML:266:13)
12:58:41.954	warn	javascript.0 (1020035) at Object.<anonymous> (script.js.Strom.tibberHTML:96:5)
12:58:41.956	warn	javascript.0 (1020035) at setHTML (script.js.Strom.tibberHTML:317:23)
12:58:41.956	warn	javascript.0 (1020035) at getTibberData (script.js.Strom.tibberHTML:266:13)
12:58:41.956	warn	javascript.0 (1020035) at Object.<anonymous> (script.js.Strom.tibberHTML:96:5)
12:58:41.958	warn	javascript.0 (1020035) at setHTML (script.js.Strom.tibberHTML:319:23)
12:58:41.958	warn	javascript.0 (1020035) at getTibberData (script.js.Strom.tibberHTML:266:13)
12:58:41.959	warn	javascript.0 (1020035) at Object.<anonymous> (script.js.Strom.tibberHTML:96:5)
Unter Objekten ist im
0_userdata.0.Strom.tibberHistory.htmlToday etwas drin.<!DOCTYPE html><html lang="en"><head><meta charset="UTF-8"><meta name="viewport" content="width=device-width, initial-scale=1.0"><title>Tibber-Tageswert</title><script src="https://cdn.jsdelivr.net/npm/echarts@5.4.3/dist/echarts.min.js"></script><script src="https://cdnjs.cloudflare.com/ajax/libs/moment.js/2.29.1/moment.min.js"></script></head><body><div id="chart-container" style="width: 100%; height:400px;"></div><script> var data = [{"time":1704668400000,"value":0.2954,"tax":0.2084,"energy":0.087,"level":"NORMAL"},{"time":1704672000000,"value":0.2922,"tax":0.2079,"energy":0.0843,"level":"NORMAL"},{"time":1704675600000,"value":0.2892,"tax":0.2074,"energy":0.0818,"level":"NORMAL"},{"time":1704679200000,"value":0.286,"tax":0.2069,"energy":0.0791,"level":"NORMAL"},{"time":1704682800000,"value":0.2852,"tax":0.2067,"energy":0.0785,"level":"NORMAL"},{"time":1704686400000,"value":0.2895,"tax":0.2074,"energy":0.0821,"level":"NORMAL"},{"time":1704690000000,"value":0.3041,"tax":0.2098,"energy":0.0943,"level":"NORMAL"},{"time":1704693600000,"value":0.324,"tax":0.2129,"energy":0.1111,"level":"NORMAL"},{"time":1704697200000,"value":0.336,"tax":0.2149,"energy":0.1211,"level":"NORMAL"},{"time":1704700800000,"value":0.3321,"tax":0.2143,"energy":0.1178,"level":"NORMAL"},{"time":1704704400000,"value":0.3235,"tax":0.2129,"energy":0.1106,"level":"NORMAL"},{"time":1704708000000,"value":0.3144,"tax":0.2114,"energy":0.103,"level":"NORMAL"},{"time":1704711600000,"value":0.3055,"tax":0.21,"energy":0.0955,"level":"NORMAL"},{"time":1704715200000,"value":0.302,"tax":0.2094,"energy":0.0926,"level":"NORMAL"},{"time":1704718800000,"value":0.3108,"tax":0.2108,"energy":0.1,"level":"NORMAL"},{"time":1704722400000,"value":0.3203,"tax":0.2123,"energy":0.108,"level":"NORMAL"},{"time":1704726000000,"value":0.3309,"tax":0.214,"energy":0.1169,"level":"NORMAL"},{"time":1704729600000,"value":0.3455,"tax":0.2164,"energy":0.1291,"level":"NORMAL"},{"time":1704733200000,"value":0.3466,"tax":0.2166,"energy":0.13,"level":"EXPENSIVE"},{"time":1704736800000,"value":0.3372,"tax":0.2151,"energy":0.1221,"level":"NORMAL"},{"time":1704740400000,"value":0.3277,"tax":0.2135,"energy":0.1142,"level":"NORMAL"},{"time":1704744000000,"value":0.3142,"tax":0.2114,"energy":0.1028,"level":"NORMAL"},{"time":1704747600000,"value":0.3108,"tax":0.2108,"energy":0.1,"level":"NORMAL"},{"time":1704751200000,"value":0.3007,"tax":0.2092,"energy":0.0915,"level":"NORMAL"}]; var chartContainer = document.getElementById("chart-container"); var myChart = echarts.init(chartContainer); function formatTime(time) { return moment(time).format("HH"); } function calculateArrowPosition(hour){ return (hour / 24) * 100 +1 + "%"; } function updateChart() { var minValue = Math.min.apply(null, data.map(function (item) { return item.value; })); var yAxisMin = -0.02; var maxValue = null; let avgValue = 0.313; var visualMapPieces =[{"gt":0,"lte":0.15,"color":"lightgreen"},{"gt":0.15,"lte":0.22,"color":"green"},{"gt":0.22,"lte":0.29,"color":"yellow"},{"gt":0.29,"lte":0.35,"color":"orange"},{"gt":0.35,"color":"red"}]; var values = data.map(item => (item.value-minValue).toFixed(2)); var maxLineValue = Math.max.apply(null, values); var maxLineIndex = values.indexOf(maxLineValue); var maxLineData = {time:0,value:null}; var currentHour = new Date().getHours() ; var colorStops = []; visualMapPieces.map(piece => { if(piece["lte"] >=yAxisMin && piece["gt"]<=maxValue){ if(piece["gt"]>=yAxisMin){ colorStops.push({ offset: ((piece["gt"]-yAxisMin)/(maxValue-yAxisMin)), color: piece.color }); } if(piece["lte"]<=maxValue){ colorStops.push({ offset: ((piece["lte"]-yAxisMin)/(maxValue-yAxisMin)), color: piece.color }); } if(piece["lte"]>maxValue ){ colorStops.push({ offset: 1, color: piece.color }); }; }else{ if(piece["lte"]>=maxValue && piece["gt"]<=maxValue ){ colorStops.push({ offset: ((piece["lte"]-yAxisMin)/(maxValue-yAxisMin)), color: piece.color }); }else if(piece["lte"]>=maxValue && piece["gt"] <= maxValue){ colorStops.push({ offset: ((piece["lte"]-yAxisMin)/(maxValue-yAxisMin)), color: piece.color }); } }; }); colorStops.push({ offset: 1, color: colorStops[colorStops.length-1].color }); colorStops.splice(0, 0, {offset: 0,color:colorStops[0].color}); myChart.setOption({ title: { text: "Today-Tageswerte", show: false }, visualMap: { type: "piecewise", pieces: visualMapPieces, dimension: 1, showLabel: true, precision: 2, itemWidth: 6, orient: "horizontal", left: "center", calculable: true,selectedMode: "multiple", bottom: 10, text: ["High", "Low"], textStyle: { color: "black" }, }, grid: { right: 10, left: 10, containLabel: true }, areaStyle: { color: colorStops }, toolbox: { feature: { saveAsImage: { backgroundColor: "rgba(38, 37, 37, 1)", title: "Speichern", name: "TibberHTML Today 08.01.2024" }, magicType: { type: ["line", "bar"], title:{ line: "Line-Chart", bar: "Bar-Chart", } }, dataView: { title: "Daten aus der Serie", lang: ["Daten der Kurve", "Schließen", "Aktualisieren"], optionToContent: function (opt) { var table = '<table style="width:100%;"><tbody><tr style="text-align: left;"><th>Stunde</th><th>Wert</th><th>Energie</th><th>Steuer</th><th>Level</th></tr>'; for (var i = 0; i< opt.series[0].data.length;i++) { table += "<tr>"; for(let x =0; x < opt.series[0].data[i].value.length; x++){ if(x==0){ table += "<td>" + ("0"+new Date(opt.series[0].data[i].value[x]).getHours()).slice(-2) + "</td>"; }else{ table += "<td>" + opt.series[0].data[i].value[x] + "</td>"; } } table += "</tr>"; } table += "</tbody></table>"; return table; }, readOnly: true }, } }, xAxis: { type: "time", axisLabel: { show: true, formatter: function (value) { return formatTime(value); } }, splitNumber: 10, }, yAxis: { type: "value", axisLabel: { formatter: function (value) { return value.toFixed(3) + " €"; } }, min: -0.02, max: 0.01, }, series: [{ data: data.map(function (item) { var hour = new Date(item.time).getHours(); return { value: [item.time, item.value, item.energy, item.tax, item.level], symbol: "circle", emphasis: { itemStyle: { color: "white" }, label: { show: true, formatter: function (params) { return params.data.value[1].toFixed(3) + " €"; }, color: "black", fontWeight: "bold", backgroundColor: "white" } } } }), type: "bar", markLine: { symbol: "none", lineStyle: { color: "red", type: "dashed" }, data: [ {yAxis: minValue ,name: "MIN", lineStyle: { color: "lime" },label: { show: false, position: "end", formatter: "Min\n\n"+ minValue.toFixed(3)+" €",textStyle: { fontSize: 12,fontWeight: "bold", color:"white" } } }, {yAxis: maxValue,name: "MAX", lineStyle: { color: "red" },label: { show: false, position: "end", formatter: "Max\n\n"+ maxValue.toFixed(3)+" €",textStyle: { fontSize: 12,fontWeight: "bold", color:"white" } } }, {yAxis: avgValue ,name: "AVG", lineStyle: { color: "blue" },label: { show: false, position: "end", formatter: "Avg\n\n"+ avgValue.toFixed(3)+" €",textStyle: { fontSize: 12,fontWeight: "bold", color:"white" } } } ], } }], tooltip: { trigger: "axis", axisPointer: { type: "shadow" }, textStyle: { fontFamily: "Courier", fontWeight: "bold" }, formatter: function (params) { let time = "Start ab: "+ moment(params[0].axisValue).format("HH:mm")+ " Uhr"; let value = "Preis:    "+params[0].value[1].toFixed(4) + " €"; let energy = "Energie:  "+params[0].value[2].toFixed(4) + " €"; let tax = "Steuer:   "+params[0].value[3].toFixed(4) + " €"; let lev = "Level:    "+ params[0].value[4]; return `${time}<br/>${value}<br/>${energy}<br/>${tax}<br/>${lev}` ; } }, }) } updateChart(); var updateInterval = setInterval(updateChart, 3600000);</script></body></html>Leider wird in Jarvis nichts angezeigt. Woran könnte das liegen?
Irgend eine Idee? Vielen Dank.
@meikie said in HowTo: Zusatz-Programme fuer jarvis v3:
Irgend eine Idee?
Also ich will mich ja nich einmischen, aber soweit wie ich es verstanden hab hast du das Script ein bischen angepasst?
Also an deiner Stelle würde ich alles nochmal löschen, dann von vorne, gemäß der Anleitung alles neu erstellen, und vor allen Dingen das Script so belassen wie es ist.
Das Problem ist, wenn du etwas an dem Script veränderst oder anpasst, wie soll der Ersteller dann wirklich nachvollziehen wo der Fehler genau ist.
-
@meikie said in HowTo: Zusatz-Programme fuer jarvis v3:
Irgend eine Idee?
Also ich will mich ja nich einmischen, aber soweit wie ich es verstanden hab hast du das Script ein bischen angepasst?
Also an deiner Stelle würde ich alles nochmal löschen, dann von vorne, gemäß der Anleitung alles neu erstellen, und vor allen Dingen das Script so belassen wie es ist.
Das Problem ist, wenn du etwas an dem Script veränderst oder anpasst, wie soll der Ersteller dann wirklich nachvollziehen wo der Fehler genau ist.
@icebear ja, das habe ich mir auch schon überlegt. Allerdings habe ich nicht viel angepasst im Script. Nur den Pfad, damit ich mehr Ordnung bei mir im System habe.Ich habe quasi noch ein Unterordner eingebaut. Und es werden ja Daten in die Objekte geschrieben.
Werde es aber mal ohne meine Änderungen probieren und schauen ob es geht.
LG -
@mcu said in HowTo: Zusatz-Programme fuer jarvis v3:
Fehlen Infos?
Klingt für mich erstmal schlüssig. Ich habs mal soweit wie es ging, versucht zu erstellen und ich denke ich bin erstmal soweit klargekommen.
@icebear Habe die scripts-Datei eingefügt. Probier mal.
NUC i7 64GB mit Proxmox ---- Jarvis Infos Aktualisierungen der Doku auf Instagram verfolgen -> mcuiobroker Instagram
Wenn Euch mein Vorschlag geholfen hat, bitte rechts "^" klicken. -
@mcu Also ich habe jetzt heute mal wieder probiert. In der Konsole sind immer noch folgende Warnungen:
12:58:41.884	warn	javascript.0 (1020035) at getTibberData (script.js.Strom.tibberHTML:231:43)
12:58:41.884	warn	javascript.0 (1020035) at Object.<anonymous> (script.js.Strom.tibberHTML:96:5)
12:58:41.888	warn	javascript.0 (1020035) at getTibberData (script.js.Strom.tibberHTML:233:43)
12:58:41.888	warn	javascript.0 (1020035) at Object.<anonymous> (script.js.Strom.tibberHTML:96:5)
12:58:41.890	warn	javascript.0 (1020035) at getTibberData (script.js.Strom.tibberHTML:234:44)
12:58:41.891	warn	javascript.0 (1020035) at Object.<anonymous> (script.js.Strom.tibberHTML:96:5)
12:58:41.893	warn	javascript.0 (1020035) at getTibberData (script.js.Strom.tibberHTML:235:41)
12:58:41.893	warn	javascript.0 (1020035) at Object.<anonymous> (script.js.Strom.tibberHTML:96:5)
12:58:41.895	warn	javascript.0 (1020035) at getTibberData (script.js.Strom.tibberHTML:243:43)
12:58:41.896	warn	javascript.0 (1020035) at Object.<anonymous> (script.js.Strom.tibberHTML:96:5)
12:58:41.898	warn	javascript.0 (1020035) at getTibberData (script.js.Strom.tibberHTML:245:43)
12:58:41.898	warn	javascript.0 (1020035) at Object.<anonymous> (script.js.Strom.tibberHTML:96:5)
12:58:41.900	warn	javascript.0 (1020035) at getTibberData (script.js.Strom.tibberHTML:246:44)
12:58:41.900	warn	javascript.0 (1020035) at Object.<anonymous> (script.js.Strom.tibberHTML:96:5)
12:58:41.902	warn	javascript.0 (1020035) at getTibberData (script.js.Strom.tibberHTML:247:41)
12:58:41.902	warn	javascript.0 (1020035) at Object.<anonymous> (script.js.Strom.tibberHTML:96:5)
12:58:41.908	warn	javascript.0 (1020035) at setHTML (script.js.Strom.tibberHTML:313:20)
12:58:41.908	warn	javascript.0 (1020035) at getTibberData (script.js.Strom.tibberHTML:266:13)
12:58:41.908	warn	javascript.0 (1020035) at Object.<anonymous> (script.js.Strom.tibberHTML:96:5)
12:58:41.910	warn	javascript.0 (1020035) at setHTML (script.js.Strom.tibberHTML:316:20)
12:58:41.910	warn	javascript.0 (1020035) at getTibberData (script.js.Strom.tibberHTML:266:13)
12:58:41.910	warn	javascript.0 (1020035) at Object.<anonymous> (script.js.Strom.tibberHTML:96:5)
12:58:41.912	warn	javascript.0 (1020035) at setHTML (script.js.Strom.tibberHTML:317:23)
12:58:41.913	warn	javascript.0 (1020035) at getTibberData (script.js.Strom.tibberHTML:266:13)
12:58:41.913	warn	javascript.0 (1020035) at Object.<anonymous> (script.js.Strom.tibberHTML:96:5)
12:58:41.915	warn	javascript.0 (1020035) at setHTML (script.js.Strom.tibberHTML:319:23)
12:58:41.915	warn	javascript.0 (1020035) at getTibberData (script.js.Strom.tibberHTML:266:13)
12:58:41.915	warn	javascript.0 (1020035) at Object.<anonymous> (script.js.Strom.tibberHTML:96:5)
12:58:41.922	warn	javascript.0 (1020035) at getTibberData (script.js.Strom.tibberHTML:231:43)
12:58:41.922	warn	javascript.0 (1020035) at Object.<anonymous> (script.js.Strom.tibberHTML:96:5)
12:58:41.924	warn	javascript.0 (1020035) at getTibberData (script.js.Strom.tibberHTML:233:43)
12:58:41.924	warn	javascript.0 (1020035) at Object.<anonymous> (script.js.Strom.tibberHTML:96:5)
12:58:41.926	warn	javascript.0 (1020035) at getTibberData (script.js.Strom.tibberHTML:234:44)
12:58:41.927	warn	javascript.0 (1020035) at Object.<anonymous> (script.js.Strom.tibberHTML:96:5)
12:58:41.929	warn	javascript.0 (1020035) at getTibberData (script.js.Strom.tibberHTML:235:41)
12:58:41.930	warn	javascript.0 (1020035) at Object.<anonymous> (script.js.Strom.tibberHTML:96:5)
12:58:41.933	warn	javascript.0 (1020035) at getTibberData (script.js.Strom.tibberHTML:243:43)
12:58:41.934	warn	javascript.0 (1020035) at Object.<anonymous> (script.js.Strom.tibberHTML:96:5)
12:58:41.937	warn	javascript.0 (1020035) at getTibberData (script.js.Strom.tibberHTML:245:43)
12:58:41.938	warn	javascript.0 (1020035) at Object.<anonymous> (script.js.Strom.tibberHTML:96:5)
12:58:41.941	warn	javascript.0 (1020035) at getTibberData (script.js.Strom.tibberHTML:246:44)
12:58:41.941	warn	javascript.0 (1020035) at Object.<anonymous> (script.js.Strom.tibberHTML:96:5)
12:58:41.948	warn	javascript.0 (1020035) at getTibberData (script.js.Strom.tibberHTML:247:41)
12:58:41.948	warn	javascript.0 (1020035) at Object.<anonymous> (script.js.Strom.tibberHTML:96:5)
12:58:41.952	warn	javascript.0 (1020035) at setHTML (script.js.Strom.tibberHTML:313:20)
12:58:41.952	warn	javascript.0 (1020035) at getTibberData (script.js.Strom.tibberHTML:266:13)
12:58:41.952	warn	javascript.0 (1020035) at Object.<anonymous> (script.js.Strom.tibberHTML:96:5)
12:58:41.954	warn	javascript.0 (1020035) at setHTML (script.js.Strom.tibberHTML:316:20)
12:58:41.954	warn	javascript.0 (1020035) at getTibberData (script.js.Strom.tibberHTML:266:13)
12:58:41.954	warn	javascript.0 (1020035) at Object.<anonymous> (script.js.Strom.tibberHTML:96:5)
12:58:41.956	warn	javascript.0 (1020035) at setHTML (script.js.Strom.tibberHTML:317:23)
12:58:41.956	warn	javascript.0 (1020035) at getTibberData (script.js.Strom.tibberHTML:266:13)
12:58:41.956	warn	javascript.0 (1020035) at Object.<anonymous> (script.js.Strom.tibberHTML:96:5)
12:58:41.958	warn	javascript.0 (1020035) at setHTML (script.js.Strom.tibberHTML:319:23)
12:58:41.958	warn	javascript.0 (1020035) at getTibberData (script.js.Strom.tibberHTML:266:13)
12:58:41.959	warn	javascript.0 (1020035) at Object.<anonymous> (script.js.Strom.tibberHTML:96:5)
Unter Objekten ist im
0_userdata.0.Strom.tibberHistory.htmlToday etwas drin.<!DOCTYPE html><html lang="en"><head><meta charset="UTF-8"><meta name="viewport" content="width=device-width, initial-scale=1.0"><title>Tibber-Tageswert</title><script src="https://cdn.jsdelivr.net/npm/echarts@5.4.3/dist/echarts.min.js"></script><script src="https://cdnjs.cloudflare.com/ajax/libs/moment.js/2.29.1/moment.min.js"></script></head><body><div id="chart-container" style="width: 100%; height:400px;"></div><script> var data = [{"time":1704668400000,"value":0.2954,"tax":0.2084,"energy":0.087,"level":"NORMAL"},{"time":1704672000000,"value":0.2922,"tax":0.2079,"energy":0.0843,"level":"NORMAL"},{"time":1704675600000,"value":0.2892,"tax":0.2074,"energy":0.0818,"level":"NORMAL"},{"time":1704679200000,"value":0.286,"tax":0.2069,"energy":0.0791,"level":"NORMAL"},{"time":1704682800000,"value":0.2852,"tax":0.2067,"energy":0.0785,"level":"NORMAL"},{"time":1704686400000,"value":0.2895,"tax":0.2074,"energy":0.0821,"level":"NORMAL"},{"time":1704690000000,"value":0.3041,"tax":0.2098,"energy":0.0943,"level":"NORMAL"},{"time":1704693600000,"value":0.324,"tax":0.2129,"energy":0.1111,"level":"NORMAL"},{"time":1704697200000,"value":0.336,"tax":0.2149,"energy":0.1211,"level":"NORMAL"},{"time":1704700800000,"value":0.3321,"tax":0.2143,"energy":0.1178,"level":"NORMAL"},{"time":1704704400000,"value":0.3235,"tax":0.2129,"energy":0.1106,"level":"NORMAL"},{"time":1704708000000,"value":0.3144,"tax":0.2114,"energy":0.103,"level":"NORMAL"},{"time":1704711600000,"value":0.3055,"tax":0.21,"energy":0.0955,"level":"NORMAL"},{"time":1704715200000,"value":0.302,"tax":0.2094,"energy":0.0926,"level":"NORMAL"},{"time":1704718800000,"value":0.3108,"tax":0.2108,"energy":0.1,"level":"NORMAL"},{"time":1704722400000,"value":0.3203,"tax":0.2123,"energy":0.108,"level":"NORMAL"},{"time":1704726000000,"value":0.3309,"tax":0.214,"energy":0.1169,"level":"NORMAL"},{"time":1704729600000,"value":0.3455,"tax":0.2164,"energy":0.1291,"level":"NORMAL"},{"time":1704733200000,"value":0.3466,"tax":0.2166,"energy":0.13,"level":"EXPENSIVE"},{"time":1704736800000,"value":0.3372,"tax":0.2151,"energy":0.1221,"level":"NORMAL"},{"time":1704740400000,"value":0.3277,"tax":0.2135,"energy":0.1142,"level":"NORMAL"},{"time":1704744000000,"value":0.3142,"tax":0.2114,"energy":0.1028,"level":"NORMAL"},{"time":1704747600000,"value":0.3108,"tax":0.2108,"energy":0.1,"level":"NORMAL"},{"time":1704751200000,"value":0.3007,"tax":0.2092,"energy":0.0915,"level":"NORMAL"}]; var chartContainer = document.getElementById("chart-container"); var myChart = echarts.init(chartContainer); function formatTime(time) { return moment(time).format("HH"); } function calculateArrowPosition(hour){ return (hour / 24) * 100 +1 + "%"; } function updateChart() { var minValue = Math.min.apply(null, data.map(function (item) { return item.value; })); var yAxisMin = -0.02; var maxValue = null; let avgValue = 0.313; var visualMapPieces =[{"gt":0,"lte":0.15,"color":"lightgreen"},{"gt":0.15,"lte":0.22,"color":"green"},{"gt":0.22,"lte":0.29,"color":"yellow"},{"gt":0.29,"lte":0.35,"color":"orange"},{"gt":0.35,"color":"red"}]; var values = data.map(item => (item.value-minValue).toFixed(2)); var maxLineValue = Math.max.apply(null, values); var maxLineIndex = values.indexOf(maxLineValue); var maxLineData = {time:0,value:null}; var currentHour = new Date().getHours() ; var colorStops = []; visualMapPieces.map(piece => { if(piece["lte"] >=yAxisMin && piece["gt"]<=maxValue){ if(piece["gt"]>=yAxisMin){ colorStops.push({ offset: ((piece["gt"]-yAxisMin)/(maxValue-yAxisMin)), color: piece.color }); } if(piece["lte"]<=maxValue){ colorStops.push({ offset: ((piece["lte"]-yAxisMin)/(maxValue-yAxisMin)), color: piece.color }); } if(piece["lte"]>maxValue ){ colorStops.push({ offset: 1, color: piece.color }); }; }else{ if(piece["lte"]>=maxValue && piece["gt"]<=maxValue ){ colorStops.push({ offset: ((piece["lte"]-yAxisMin)/(maxValue-yAxisMin)), color: piece.color }); }else if(piece["lte"]>=maxValue && piece["gt"] <= maxValue){ colorStops.push({ offset: ((piece["lte"]-yAxisMin)/(maxValue-yAxisMin)), color: piece.color }); } }; }); colorStops.push({ offset: 1, color: colorStops[colorStops.length-1].color }); colorStops.splice(0, 0, {offset: 0,color:colorStops[0].color}); myChart.setOption({ title: { text: "Today-Tageswerte", show: false }, visualMap: { type: "piecewise", pieces: visualMapPieces, dimension: 1, showLabel: true, precision: 2, itemWidth: 6, orient: "horizontal", left: "center", calculable: true,selectedMode: "multiple", bottom: 10, text: ["High", "Low"], textStyle: { color: "black" }, }, grid: { right: 10, left: 10, containLabel: true }, areaStyle: { color: colorStops }, toolbox: { feature: { saveAsImage: { backgroundColor: "rgba(38, 37, 37, 1)", title: "Speichern", name: "TibberHTML Today 08.01.2024" }, magicType: { type: ["line", "bar"], title:{ line: "Line-Chart", bar: "Bar-Chart", } }, dataView: { title: "Daten aus der Serie", lang: ["Daten der Kurve", "Schließen", "Aktualisieren"], optionToContent: function (opt) { var table = '<table style="width:100%;"><tbody><tr style="text-align: left;"><th>Stunde</th><th>Wert</th><th>Energie</th><th>Steuer</th><th>Level</th></tr>'; for (var i = 0; i< opt.series[0].data.length;i++) { table += "<tr>"; for(let x =0; x < opt.series[0].data[i].value.length; x++){ if(x==0){ table += "<td>" + ("0"+new Date(opt.series[0].data[i].value[x]).getHours()).slice(-2) + "</td>"; }else{ table += "<td>" + opt.series[0].data[i].value[x] + "</td>"; } } table += "</tr>"; } table += "</tbody></table>"; return table; }, readOnly: true }, } }, xAxis: { type: "time", axisLabel: { show: true, formatter: function (value) { return formatTime(value); } }, splitNumber: 10, }, yAxis: { type: "value", axisLabel: { formatter: function (value) { return value.toFixed(3) + " €"; } }, min: -0.02, max: 0.01, }, series: [{ data: data.map(function (item) { var hour = new Date(item.time).getHours(); return { value: [item.time, item.value, item.energy, item.tax, item.level], symbol: "circle", emphasis: { itemStyle: { color: "white" }, label: { show: true, formatter: function (params) { return params.data.value[1].toFixed(3) + " €"; }, color: "black", fontWeight: "bold", backgroundColor: "white" } } } }), type: "bar", markLine: { symbol: "none", lineStyle: { color: "red", type: "dashed" }, data: [ {yAxis: minValue ,name: "MIN", lineStyle: { color: "lime" },label: { show: false, position: "end", formatter: "Min\n\n"+ minValue.toFixed(3)+" €",textStyle: { fontSize: 12,fontWeight: "bold", color:"white" } } }, {yAxis: maxValue,name: "MAX", lineStyle: { color: "red" },label: { show: false, position: "end", formatter: "Max\n\n"+ maxValue.toFixed(3)+" €",textStyle: { fontSize: 12,fontWeight: "bold", color:"white" } } }, {yAxis: avgValue ,name: "AVG", lineStyle: { color: "blue" },label: { show: false, position: "end", formatter: "Avg\n\n"+ avgValue.toFixed(3)+" €",textStyle: { fontSize: 12,fontWeight: "bold", color:"white" } } } ], } }], tooltip: { trigger: "axis", axisPointer: { type: "shadow" }, textStyle: { fontFamily: "Courier", fontWeight: "bold" }, formatter: function (params) { let time = "Start ab: "+ moment(params[0].axisValue).format("HH:mm")+ " Uhr"; let value = "Preis:    "+params[0].value[1].toFixed(4) + " €"; let energy = "Energie:  "+params[0].value[2].toFixed(4) + " €"; let tax = "Steuer:   "+params[0].value[3].toFixed(4) + " €"; let lev = "Level:    "+ params[0].value[4]; return `${time}<br/>${value}<br/>${energy}<br/>${tax}<br/>${lev}` ; } }, }) } updateChart(); var updateInterval = setInterval(updateChart, 3600000);</script></body></html>Leider wird in Jarvis nichts angezeigt. Woran könnte das liegen?
Irgend eine Idee? Vielen Dank.
-
@meikie
Wo hast denn negative Werte eingestellt?
Habe kein tibber, kann man in dem Adapter tibberlink besondere Mittelwert, min, max auswählen?
Die scheinen bei Dir zu fehlen. -
@mcu said in HowTo: Zusatz-Programme fuer jarvis v3:
Habe die scripts-Datei eingefügt. Probier mal.
Ich bekomm nur das:
File type not supported. To protect you against potential viruses and harmful software, GitBook doesn't allow you to attach certain types of files.
-
@mcu said in HowTo: Zusatz-Programme fuer jarvis v3:
Habe die scripts-Datei eingefügt. Probier mal.
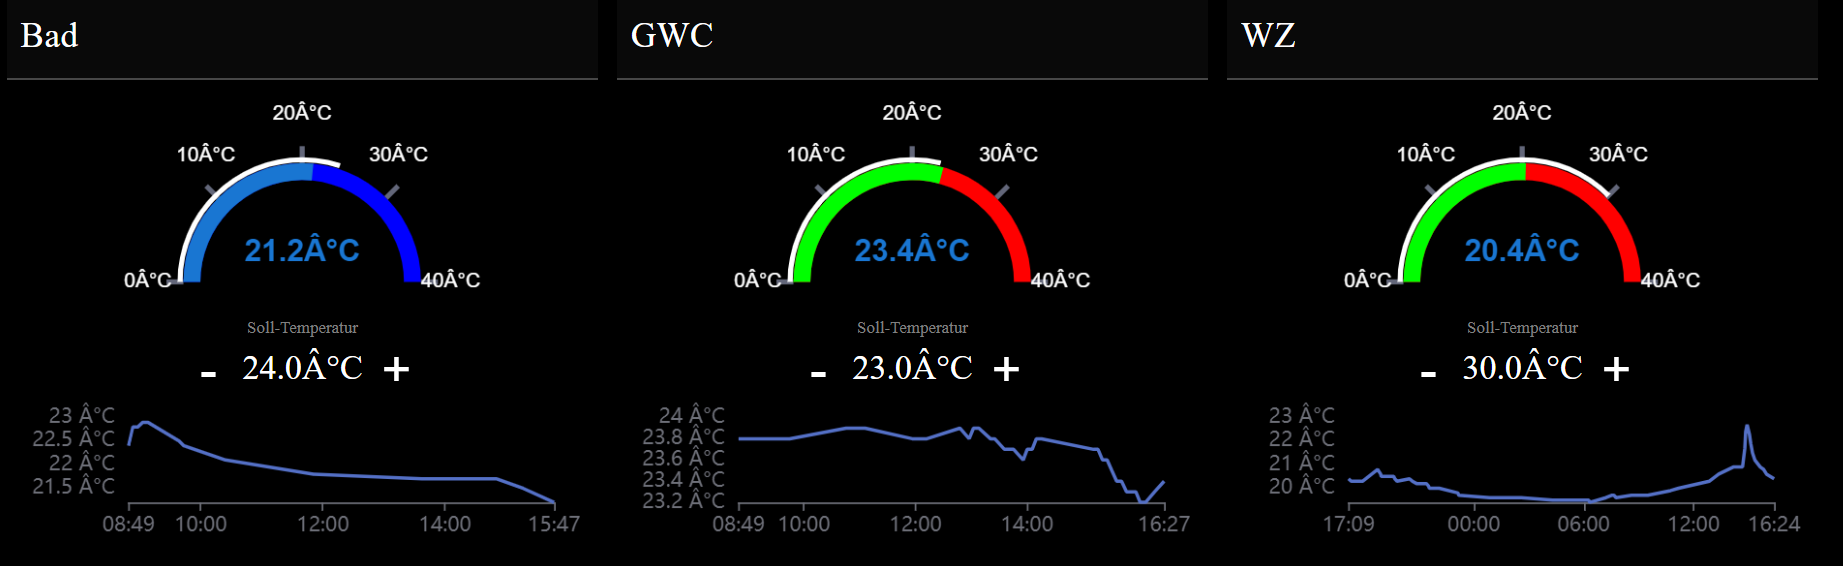
So hier der erste Test, sieht schonmal super aus.
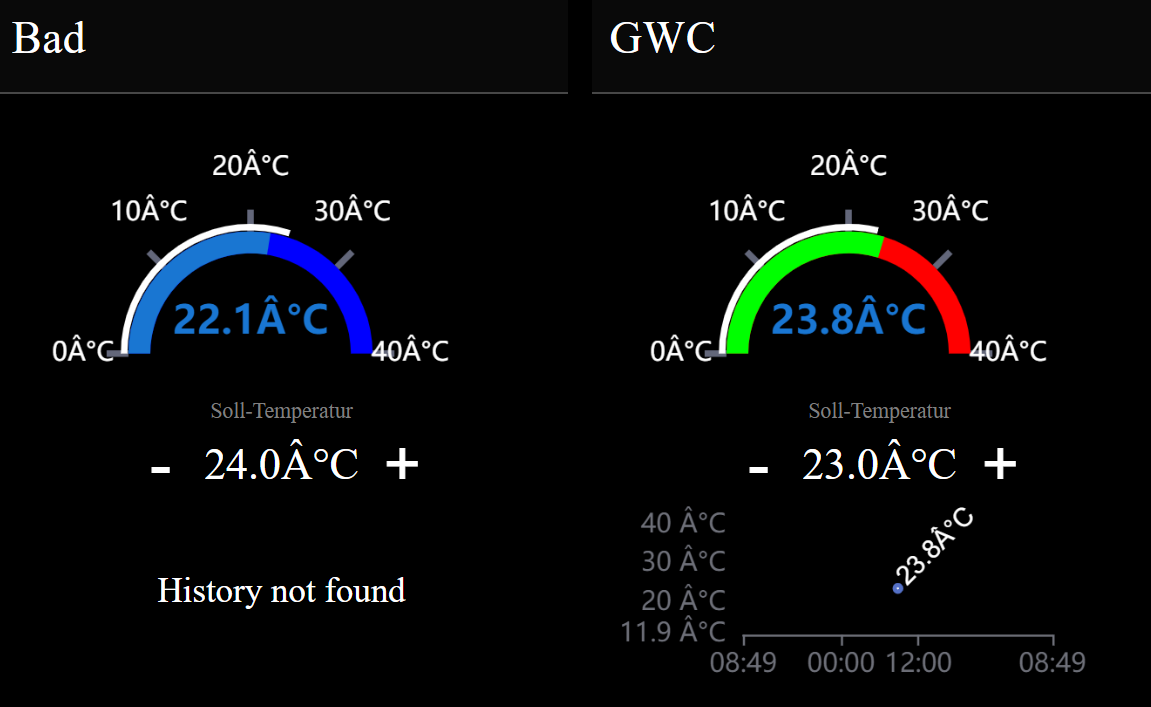
Das bei Bad 'History not found' steht soll dich erstmal nicht stören.
(Edit: In den DP unter '0_userdata.0.historyGetData' bei 'dataresult' und 'queryJSON' steht nur eins von den beide Thermostaten drin. Muß da in dem Script auch noch was definiert werden?)Bei GWC ist der Graph da aber ich seh noch keine Linie. Ich schau grad mal woran das liegt.
(Edit: Habs, musste im 'eChartsThermostat' Script auch das 'let thermoLogging = true;' setzten)Dann hat sich da irgendwie das  überall reingeschummelt.
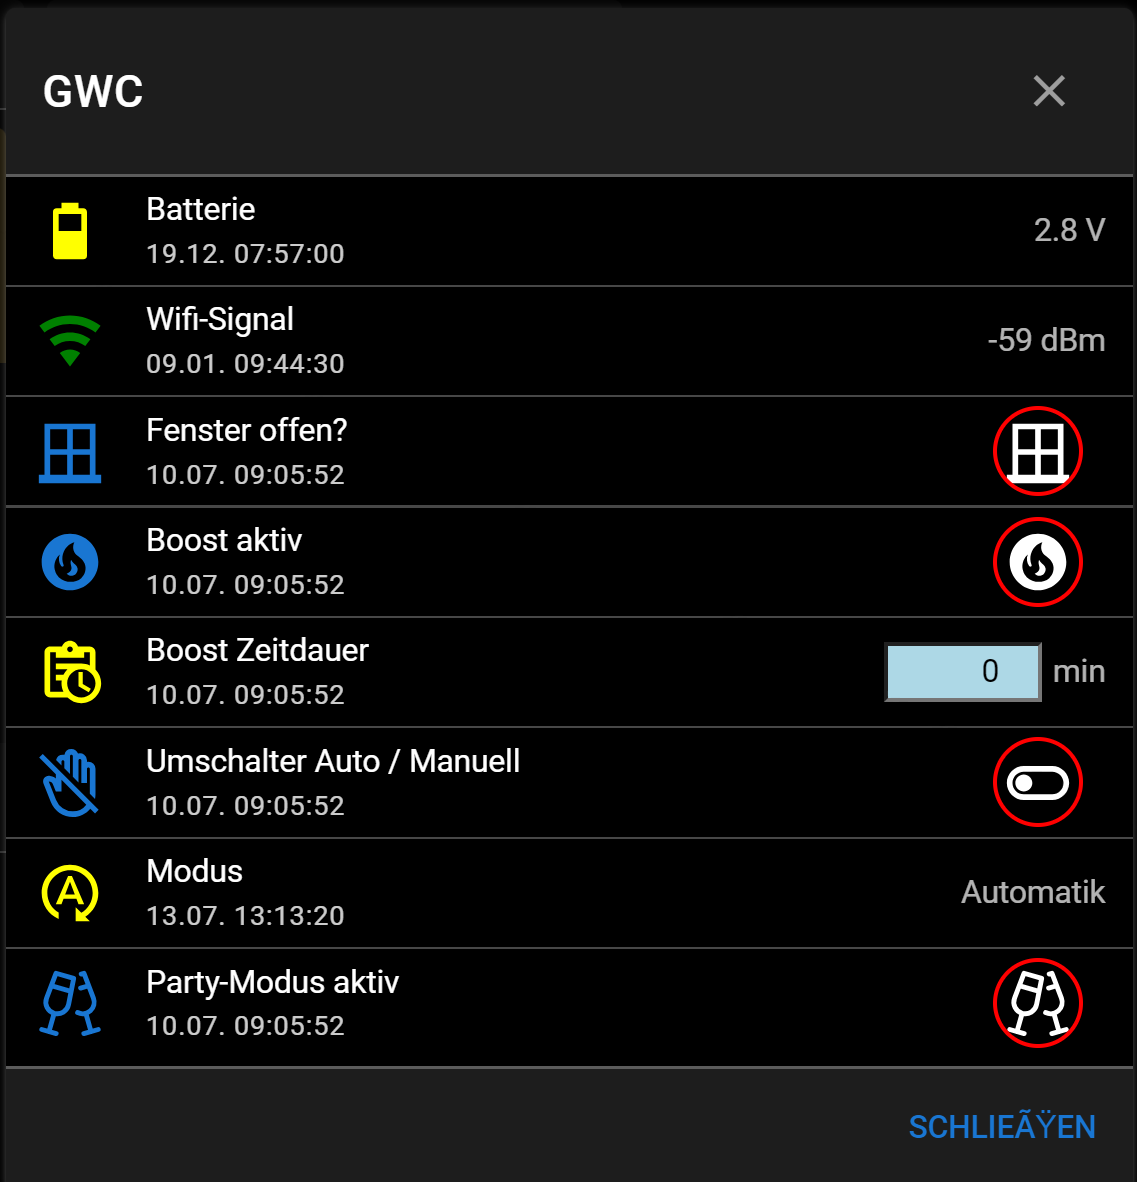
Das PopUp Fenster sieht auch erstmal gut aus.
Edit:
Das PopUp Fenster kommt auch nur bei einem Widget (GWC) bei Bad kommt keins.
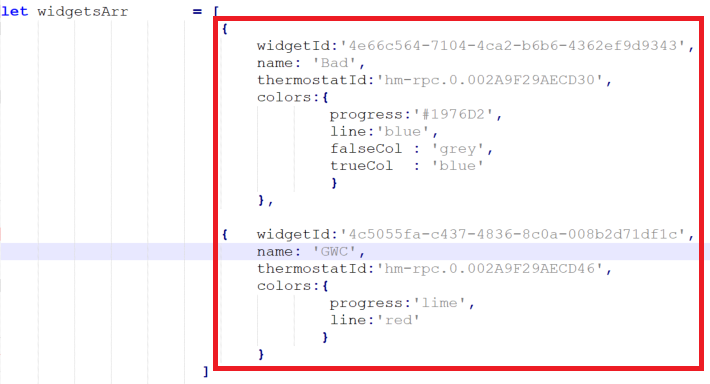
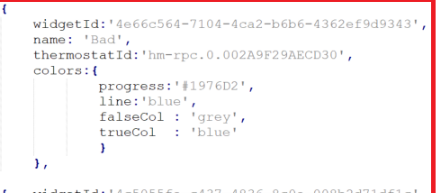
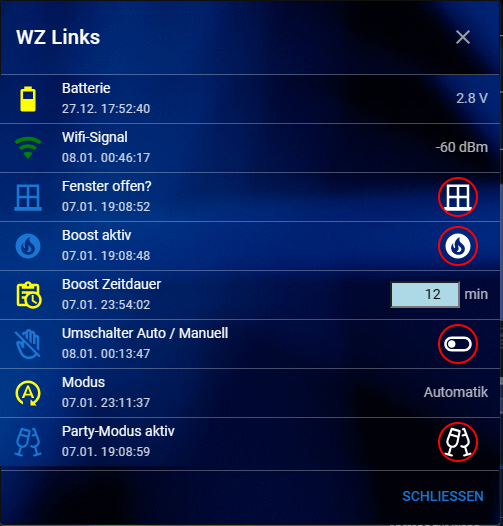
Oder ist das mit dem WidgetArray so zu verstehen , das wie im ScreenShot umrandet, das ein Thermostat darstellt?
-
@mcu said in HowTo: Zusatz-Programme fuer jarvis v3:
Habe die scripts-Datei eingefügt. Probier mal.
So hier der erste Test, sieht schonmal super aus.
Das bei Bad 'History not found' steht soll dich erstmal nicht stören.
(Edit: In den DP unter '0_userdata.0.historyGetData' bei 'dataresult' und 'queryJSON' steht nur eins von den beide Thermostaten drin. Muß da in dem Script auch noch was definiert werden?)Bei GWC ist der Graph da aber ich seh noch keine Linie. Ich schau grad mal woran das liegt.
(Edit: Habs, musste im 'eChartsThermostat' Script auch das 'let thermoLogging = true;' setzten)Dann hat sich da irgendwie das  überall reingeschummelt.
Das PopUp Fenster sieht auch erstmal gut aus.
Edit:
Das PopUp Fenster kommt auch nur bei einem Widget (GWC) bei Bad kommt keins.
Oder ist das mit dem WidgetArray so zu verstehen , das wie im ScreenShot umrandet, das ein Thermostat darstellt?
Das ist ein Thermostat-Widget ->
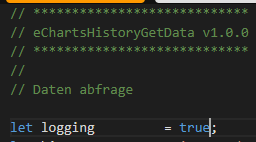
(Edit: Habs, musste im 'eChartsThermostat' Script auch das 'let thermoLogging = true;' setzten)
Um den Graph / Line zu bekommen?
Edit: In den DP unter '0_userdata.0.historyGetData' bei 'dataresult' und 'queryJSON' steht nur eins von den beide Thermostaten drin. Muß da in dem Script auch noch was definiert werden?
Holt er sich automatisch.
Haben denn beide eine History?Setz mal bitte im javascript logging: true
bei Bad kommt kein Popup
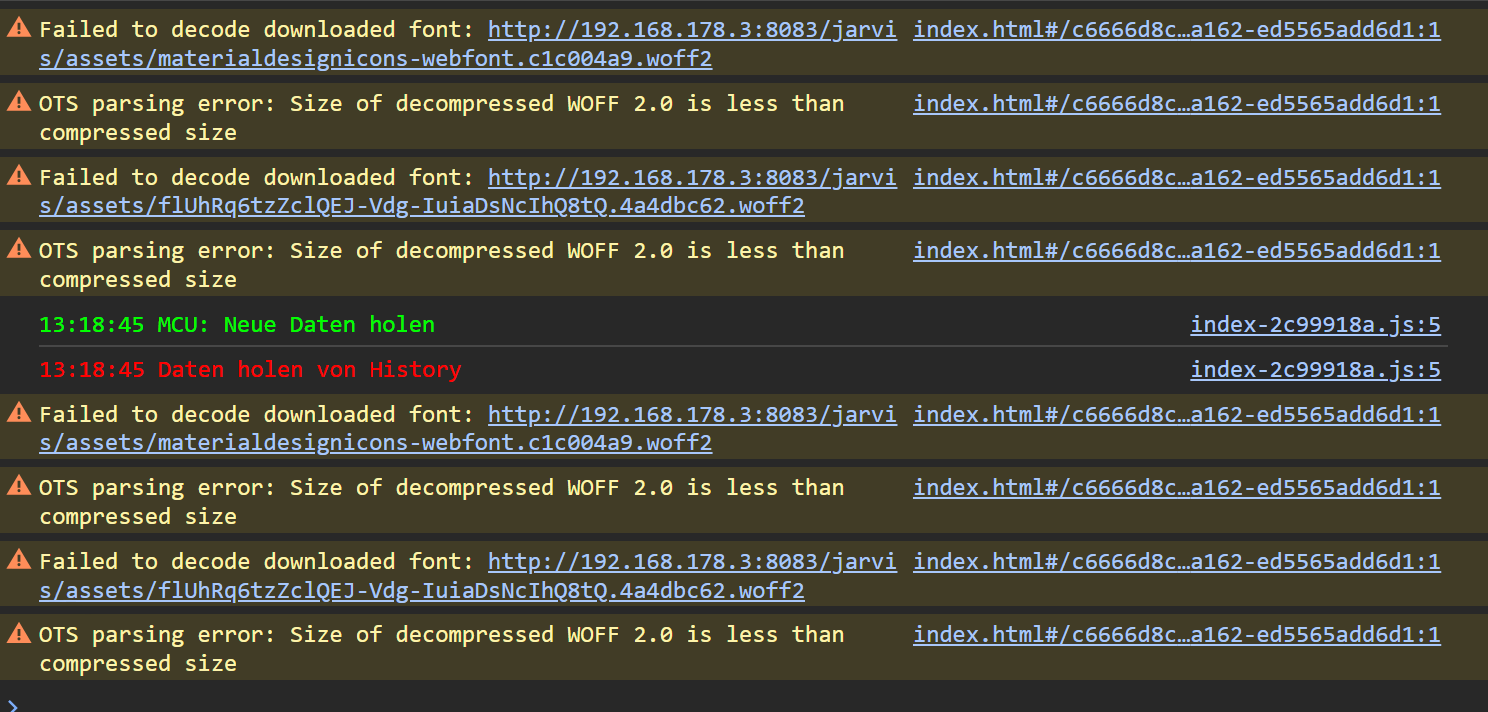
'let thermoLogging = true;' -> F12 -> Log löschen ->

-> Klick auf Bad-Graph -> Fehlermeldungen im LOG? (Gelb oder rot)
NUC i7 64GB mit Proxmox ---- Jarvis Infos Aktualisierungen der Doku auf Instagram verfolgen -> mcuiobroker Instagram
Wenn Euch mein Vorschlag geholfen hat, bitte rechts "^" klicken. -
Das ist ein Thermostat-Widget ->
(Edit: Habs, musste im 'eChartsThermostat' Script auch das 'let thermoLogging = true;' setzten)
Um den Graph / Line zu bekommen?
Edit: In den DP unter '0_userdata.0.historyGetData' bei 'dataresult' und 'queryJSON' steht nur eins von den beide Thermostaten drin. Muß da in dem Script auch noch was definiert werden?
Holt er sich automatisch.
Haben denn beide eine History?Setz mal bitte im javascript logging: true
bei Bad kommt kein Popup
'let thermoLogging = true;' -> F12 -> Log löschen ->
-> Klick auf Bad-Graph -> Fehlermeldungen im LOG? (Gelb oder rot)
@mcu said in HowTo: Zusatz-Programme fuer jarvis v3:
Setz mal bitte im javascript logging: true
Das hatte ich vorher schon auf 'true' gestellt.
Hier der Inhalt von DP 'dataresult' und 'queryJSON'
{"dp":"hm-rpc.0.002A9F29AECD46.1.ACTUAL_TEMPERATURE","cnt":null,"start":null,"end":null,"type":null,"adapt":null,"widgetId":"4c5055fa-c437-4836-8c0a-008b2d71df1c"}{"dp":"hm-rpc.0.002A9F29AECD46.1.ACTUAL_TEMPERATURE","arr":[["2024-01-09T07:49:37.035Z",23.8],["2024-01-09T08:44:30.871Z",23.8],["2024-01-09T09:45:20.185Z",23.9],["2024-01-09T10:05:46.439Z",23.9],["2024-01-09T10:56:29.291Z",23.8],["2024-01-09T11:12:14.735Z",23.8],["2024-01-09T11:47:42.985Z",23.9],["2024-01-09T11:57:43.767Z",23.8],["2024-01-09T12:02:21.924Z",23.9]]}iobroker Protokoll:
javascript.0
2024-01-09 13:07:02.340	info	script.js.Jarvis.eChartgetHistory: Historydaten für DP: hm-rpc.0.002A9F29AECD46.1.ACTUAL_TEMPERATURE WidgetId: 4c5055fa-c437-4836-8c0a-008b2d71df1c

javascript.0
2024-01-09 13:07:02.331	info	script.js.Jarvis.eChartgetHistory: Historydaten für DP: hm-rpc.0.002A9F29AECD30.1.ACTUAL_TEMPERATURE WidgetId: 4e66c564-7104-4ca2-b6b6-4362ef9d9343
und F12
Edit:
Ich hab jetzt nochmal ein drittes erstellt und da ist das gleiche wie oben bei 'Bad'
Er zeigt also nur bei einem von drei Widgets den Graph und das PopUp Fenster -
@mcu said in HowTo: Zusatz-Programme fuer jarvis v3:
Setz mal bitte im javascript logging: true
Das hatte ich vorher schon auf 'true' gestellt.
Hier der Inhalt von DP 'dataresult' und 'queryJSON'
{"dp":"hm-rpc.0.002A9F29AECD46.1.ACTUAL_TEMPERATURE","cnt":null,"start":null,"end":null,"type":null,"adapt":null,"widgetId":"4c5055fa-c437-4836-8c0a-008b2d71df1c"}{"dp":"hm-rpc.0.002A9F29AECD46.1.ACTUAL_TEMPERATURE","arr":[["2024-01-09T07:49:37.035Z",23.8],["2024-01-09T08:44:30.871Z",23.8],["2024-01-09T09:45:20.185Z",23.9],["2024-01-09T10:05:46.439Z",23.9],["2024-01-09T10:56:29.291Z",23.8],["2024-01-09T11:12:14.735Z",23.8],["2024-01-09T11:47:42.985Z",23.9],["2024-01-09T11:57:43.767Z",23.8],["2024-01-09T12:02:21.924Z",23.9]]}iobroker Protokoll:
javascript.0
2024-01-09 13:07:02.340	info	script.js.Jarvis.eChartgetHistory: Historydaten für DP: hm-rpc.0.002A9F29AECD46.1.ACTUAL_TEMPERATURE WidgetId: 4c5055fa-c437-4836-8c0a-008b2d71df1c

javascript.0
2024-01-09 13:07:02.331	info	script.js.Jarvis.eChartgetHistory: Historydaten für DP: hm-rpc.0.002A9F29AECD30.1.ACTUAL_TEMPERATURE WidgetId: 4e66c564-7104-4ca2-b6b6-4362ef9d9343
und F12
Edit:
Ich hab jetzt nochmal ein drittes erstellt und da ist das gleiche wie oben bei 'Bad'
Er zeigt also nur bei einem von drei Widgets den Graph und das PopUp Fenster@icebear Ich setze mal ein anderes Logging, um dem auf die Spur zu kommen.
NUC i7 64GB mit Proxmox ---- Jarvis Infos Aktualisierungen der Doku auf Instagram verfolgen -> mcuiobroker Instagram
Wenn Euch mein Vorschlag geholfen hat, bitte rechts "^" klicken. -
@mcu said in HowTo: Zusatz-Programme fuer jarvis v3:
Setz mal bitte im javascript logging: true
Das hatte ich vorher schon auf 'true' gestellt.
Hier der Inhalt von DP 'dataresult' und 'queryJSON'
{"dp":"hm-rpc.0.002A9F29AECD46.1.ACTUAL_TEMPERATURE","cnt":null,"start":null,"end":null,"type":null,"adapt":null,"widgetId":"4c5055fa-c437-4836-8c0a-008b2d71df1c"}{"dp":"hm-rpc.0.002A9F29AECD46.1.ACTUAL_TEMPERATURE","arr":[["2024-01-09T07:49:37.035Z",23.8],["2024-01-09T08:44:30.871Z",23.8],["2024-01-09T09:45:20.185Z",23.9],["2024-01-09T10:05:46.439Z",23.9],["2024-01-09T10:56:29.291Z",23.8],["2024-01-09T11:12:14.735Z",23.8],["2024-01-09T11:47:42.985Z",23.9],["2024-01-09T11:57:43.767Z",23.8],["2024-01-09T12:02:21.924Z",23.9]]}iobroker Protokoll:
javascript.0
2024-01-09 13:07:02.340	info	script.js.Jarvis.eChartgetHistory: Historydaten für DP: hm-rpc.0.002A9F29AECD46.1.ACTUAL_TEMPERATURE WidgetId: 4c5055fa-c437-4836-8c0a-008b2d71df1c

javascript.0
2024-01-09 13:07:02.331	info	script.js.Jarvis.eChartgetHistory: Historydaten für DP: hm-rpc.0.002A9F29AECD30.1.ACTUAL_TEMPERATURE WidgetId: 4e66c564-7104-4ca2-b6b6-4362ef9d9343
und F12
Edit:
Ich hab jetzt nochmal ein drittes erstellt und da ist das gleiche wie oben bei 'Bad'
Er zeigt also nur bei einem von drei Widgets den Graph und das PopUp Fenster -
@mcu said in HowTo: Zusatz-Programme fuer jarvis v3:
Ich setze mal ein anderes Logging, um dem auf die Spur zu kommen.
Oki, dr Graph ist jetzt bei allen drei Widget's da, lediglich das PopUp kommt nur bei einem.
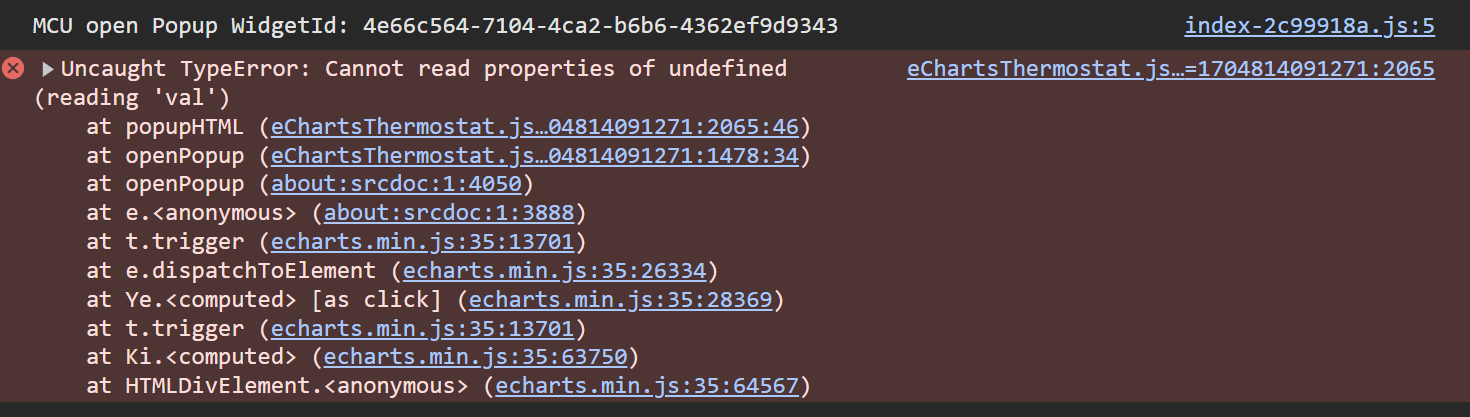
@icebear Was steht bei dir in der Zeile 2065
Bei mir steht dort
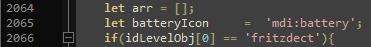
Setzt du mit CSS die fontFamily?
NUC i7 64GB mit Proxmox ---- Jarvis Infos Aktualisierungen der Doku auf Instagram verfolgen -> mcuiobroker Instagram
Wenn Euch mein Vorschlag geholfen hat, bitte rechts "^" klicken.
Hey! Du scheinst an dieser Unterhaltung interessiert zu sein, hast aber noch kein Konto.
Hast du es satt, bei jedem Besuch durch die gleichen Beiträge zu scrollen? Wenn du dich für ein Konto anmeldest, kommst du immer genau dorthin zurück, wo du zuvor warst, und kannst dich über neue Antworten benachrichtigen lassen (entweder per E-Mail oder Push-Benachrichtigung). Du kannst auch Lesezeichen speichern und Beiträge positiv bewerten, um anderen Community-Mitgliedern deine Wertschätzung zu zeigen.
Mit deinem Input könnte dieser Beitrag noch besser werden 💗
Registrieren AnmeldenSupport us
458
Online33.0k
Benutzer83.4k
Themen1.3m
Beiträge