

Performance Probleme durch Shelly Adapter?
-
@66er Danke, was würde ich ohne Euch machen. ;-)
-
@schtallone sagte in Performance Probleme durch Shelly Adapter?:
Einen freundlichen unterton...
Sind mir hier schon seit Langem zu viele wiederholte Satzzeichen "..." Viel Glück bei der Lösung Deines Problems "..."
@djmarc75 said in Performance Probleme durch Shelly Adapter?:
@schtallone sagte in Performance Probleme durch Shelly Adapter?:
Einen freundlichen unterton...
Sind mir hier schon seit Langem zu viele wiederholte Satzzeichen "..." Viel Glück bei der Lösung Deines Problems "..."
Tja, schade aber so wirklich hiflreich warst Du, ohne Dir zu nahe treten zu wollen, mit Deinen 2-3 Post nicht. Da war mehr Salz als Hilfe. Sorry das zu sagen
-
@homoran ja im iob habe ich dies auch gemacht und in ca. 30 Min takt Adpater hinzugefügt. Bisher keine Auffälligkeiten bis auf, dass ich nie die average load Zahl von unter 1 erreicht habe, auch nicht als alle Adapter aus waren.
Ich mache aber jetzt nochmals alles auf dem NAS aus und poste dann aus SSH die load average. MAl sehen
@schtallone sagte in Performance Probleme durch Shelly Adapter?:
Ich mache aber jetzt nochmals alles auf dem NAS aus und poste dann aus SSH die load average
wo ist das denn von damals?
-
@schtallone sagte in Performance Probleme durch Shelly Adapter?:
Ich mache aber jetzt nochmals alles auf dem NAS aus und poste dann aus SSH die load average
wo ist das denn von damals?
-
@schtallone in beiden Links sehe ich nichts, das erkennen lässt, dass alles auf dem NAS deaktiviert ist.
im Gegenteil:
im ersten Link scheinen sogar noch alle Container zu laufen, der zweite scheint sich nur auf ioB zu beziehen -
@schtallone in beiden Links sehe ich nichts, das erkennen lässt, dass alles auf dem NAS deaktiviert ist.
im Gegenteil:
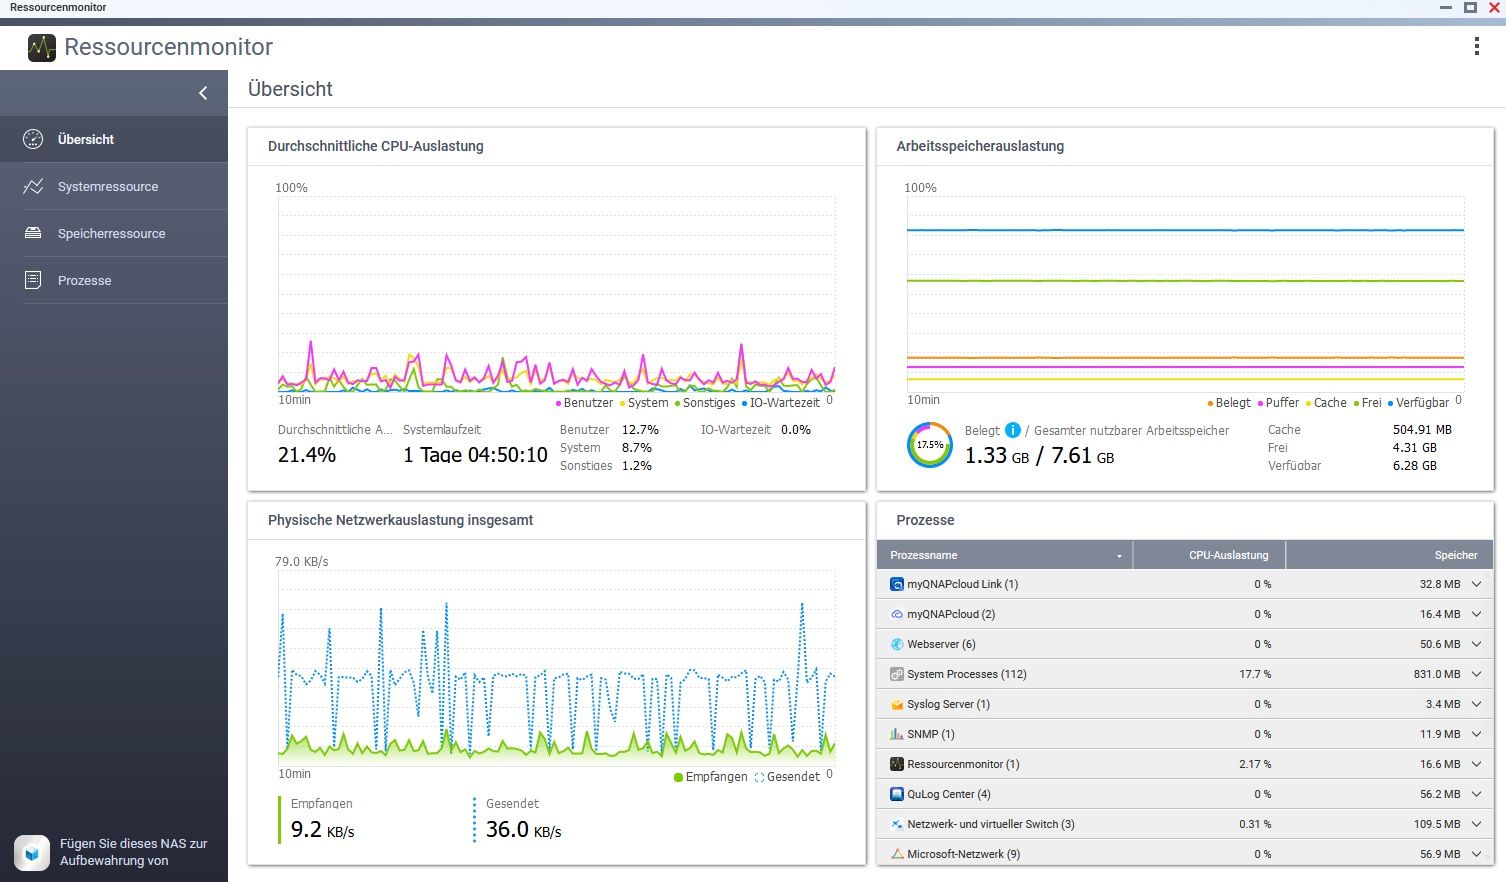
im ersten Link scheinen sogar noch alle Container zu laufen, der zweite scheint sich nur auf ioB zu beziehenso, ich habe alles auf dem NAS beendet (die APPS), die ich so ohne weiteres beenden konnte. Dies ist so 10 min her:
Mem: 3453636K used, 4525596K free, 396772K shrd, 1023860K buff, 516908K cached
CPU: 16.4% usr 13.9% sys  2.3% nic 66.8% idle  0.4% io  0.0% irq  0.0% sirq
Load average: 2.02 2.23 3.09 2/890 32404
  PID  PPID USER     STAT   VSZ %VSZ CPU %CPU COMMAND
 3441     1 admin    S    1326m 16.9   1  7.0 /sbin/hal_daemon -f
15096 14697 admin    S     1844  0.0   0  3.0 iotop
13927     2 admin    DW       0  0.0   0  0.5 [kworker/0:8+pm]
 9810 18618 admin    S <  2190m 28.0   0  0.2 /usr/local/apache/bin/apache_proxy -k start -f /etc/apache
 5479     2 admin    SW       0  0.0   0  0.2 [notify thread]
13926     2 admin    IW       0  0.0   0  0.2 [kworker/0:7-kac]
26094 25688 admin    S     857m 10.9   0  0.1 /usr/local/mariadb/bin/mysqld --defaults-file=/etc/qcoolie
 9830     1 admin    S     441m  5.6   1  0.1 /mnt/ext/opt/Python/bin/python /mnt/ext/opt/netmgr/api ser
10394     1 admin    S     222m  2.8   1  0.1 /mnt/ext/opt/Python/bin/python2 /sbin/wsd.py
 8551  8463 admin    S     148m  1.9   0  0.1 {acdd} python /usr/local/network/nmd/nmd.pyc
 8463     1 admin    S     147m  1.8   1  0.1 {nmd} python /usr/local/network/nmd/nmd.pyc
22075     1 admin    S     104m  1.3   1  0.1 /usr/local/bin/snmpd -c /etc/config/snmpd.conf -p 161
22664     1 admin    S    84952  1.0   0  0.1 /sbin/rfsd -i -f /etc/rfsd.conf
26469     1 admin    S    76980  0.9   0  0.1 /sbin/daemon_mgr
11884  9577 admin    R    16180  0.2   1  0.1 top
   10     2 admin    IW       0  0.0   0  0.1 [rcu_sched]
   16     2 admin    SW       0  0.0   1  0.1 [ksoftirqd/1]
 2831     2 admin    IW<      0  0.0   1  0.1 [kworker/1:2H-kb]
17255 16150 httpdusr S    2180m 27.8   1  0.0 /usr/local/apache/bin/apache -k start -c PidFile /var/lock
10741 20178 admin    S    1360m 17.4   0  0.0 /usr/local/apache/bin/apache_proxys -k start -f /etc/apach
14539 14537 admin    S    1212m 15.5   1  0.0 /usr/local/sbin/ncd
13710     1 admin    S    1196m 15.3   0  0.0 /usr/local/sbin/qulogdb --defaults-file=/mnt/ext/opt/QuLog
12222 11744 admin    S     882m 11.2   1  0.0 /usr/local/mariadb/bin/mysqld --defaults-file=/usr/local/m
 7559     1 admin    S     560m  7.1   0  0.0 /mnt/ext/opt/Python/bin/python ./manage.pyc runfcgi method
22489     1 admin    S     549m  7.0   1  0.0 /sbin/upnpd br0 br0
14499     1 admin    S     507m  6.5   0  0.0 /usr/local/sbin/ncdb --defaults-file=/mnt/ext/opt/Notifica
 1562     1 admin    S     409m  5.2   0  0.0 tunnelagent
 1368 17710 Peter Pa S     374m  4.7   1  0.0 /usr/local/samba/sbin/smbd -l /var/log -D -s /etc/config/s
 3293     1 admin    S     360m  4.6   1  0.0 {php-fpm-proxy} php-fpm: master process (/etc/php-fpm-sys-
 3298  3293 admin    S     360m  4.6   0  0.0 {php-fpm-proxy} php-fpm: pool www
 3299  3293 admin    S     360m  4.6   1  0.0 {php-fpm-proxy} php-fpm: pool www
16091     1 admin    S     360m  4.6   1  0.0 {php-fpm-qweb} php-fpm: master process (/etc/config/apache
16092 16091 httpdusr S     360m  4.6   1  0.0 {php-fpm-qweb} php-fpm: pool www
[~] # iotop Total DISK READ: 0.00 B/s | Total DISK WRITE: 4096.00 B/s TID PRIO USER DISK READ DISK WRITE SWAPIN IO> COMMAND 2494 -/0 UNKNOWN 0.00 B/s 4096.00 B/s 0.00 % 6.19 % /usr/sbin/rsyslogd -f /etc/rsyslog_on 3228 be/3 UNKNOWN 0.00 B/s 0.00 B/s 0.00 % 0.01 % [jbd2/md9-] 3 -/4 UNKNOWN 0.00 B/s 0.00 B/s 0.00 % 0.00 % [rcu_g] 4 -/4 UNKNOWN 0.00 B/s 0.00 B/s 0.00 % 0.00 % [rcu_par_g] 8 -/4 UNKNOWN 0.00 B/s 0.00 B/s 0.00 % 0.00 % [mm_percpu_w] 9 -/4 UNKNOWN 0.00 B/s 0.00 B/s 0.00 % 0.00 % [ksoftirqd/] 10 -/4 UNKNOWN 0.00 B/s 0.00 B/s 0.00 % 0.00 % [rcu_sche] 11 -/4 UNKNOWN 0.00 B/s 0.00 B/s 0.00 % 0.00 % [migration/] 13 -/4 UNKNOWN 0.00 B/s 0.00 B/s 0.00 % 0.00 % [cpuhp/] 14 -/4 UNKNOWN 0.00 B/s 0.00 B/s 0.00 % 0.00 % [cpuhp/] 15 -/4 UNKNOWN 0.00 B/s 0.00 B/s 0.00 % 0.00 % [migration/] 16 -/4 UNKNOWN 0.00 B/s 0.00 B/s 0.00 % 0.00 % [ksoftirqd/] 19 -/4 UNKNOWN 0.00 B/s 0.00 B/s 0.00 % 0.00 % [kdevtmpf] 20 -/4 UNKNOWN 0.00 B/s 0.00 B/s 0.00 % 0.00 % [netn] 25 -/4 UNKNOWN 0.00 B/s 0.00 B/s 0.00 % 0.00 % [kaudit] 586 -/4 UNKNOWN 0.00 B/s 0.00 B/s 0.00 % 0.00 % [khungtask] 587 -/4 UNKNOWN 0.00 B/s 0.00 B/s 0.00 % 0.00 % [oom_reape] 588 -/4 UNKNOWN 0.00 B/s 0.00 B/s 0.00 % 0.00 % [writebac] 590 -/4 UNKNOWN 0.00 B/s 0.00 B/s 0.00 % 0.00 % [kcompactd] 591 -/4 UNKNOWN 0.00 B/s 0.00 B/s 0.00 % 0.00 % [ksm] 605 -/4 UNKNOWN 0.00 B/s 0.00 B/s 0.00 % 0.00 % [crypt] 632 -/4 UNKNOWN 0.00 B/s 0.00 B/s 0.00 % 0.00 % [kintegrity] 633 -/4 UNKNOWN 0.00 B/s 0.00 B/s 0.00 % 0.00 % [kblock] 634 -/4 UNKNOWN 0.00 B/s 0.00 B/s 0.00 % 0.00 % [blkcg_punt_bi] 853 -/4 UNKNOWN 0.00 B/s 0.00 B/s 0.00 % 0.00 % [tif] 860 -/4 UNKNOWN 0.00 B/s 0.00 B/s 0.00 % 0.00 % [ata_sf] 880 -/0 UNKNOWN 0.00 B/s 0.00 B/s 0.00 % 0.00 % [m] 899 -/4 UNKNOWN 0.00 B/s 0.00 B/s 0.00 % 0.00 % [watchdog] 916 -/4 UNKNOWN 0.00 B/s 0.00 B/s 0.00 % 0.00 % [kworker/0:1H-kblock] 998 -/4 UNKNOWN 0.00 B/s 0.00 B/s 0.00 % 0.00 % [rpcio] 1000 -/4 UNKNOWN 0.00 B/s 0.00 B/s 0.00 % 0.00 % [xprtio] 1037 -/0 UNKNOWN 0.00 B/s 0.00 B/s 0.00 % 0.00 % [kswapd] 1038 -/4 UNKNOWN 0.00 B/s 0.00 B/s 0.00 % 0.00 % [ecryptfs-kthre] 1041 -/4 UNKNOWN 0.00 B/s 0.00 B/s 0.00 % 0.00 % [nfsio] 1042 -/4 UNKNOWN 0.00 B/s 0.00 B/s 0.00 % 0.00 % [cifsio]
-
so, ich habe alles auf dem NAS beendet (die APPS), die ich so ohne weiteres beenden konnte. Dies ist so 10 min her:
Mem: 3453636K used, 4525596K free, 396772K shrd, 1023860K buff, 516908K cached
CPU: 16.4% usr 13.9% sys  2.3% nic 66.8% idle  0.4% io  0.0% irq  0.0% sirq
Load average: 2.02 2.23 3.09 2/890 32404
  PID  PPID USER     STAT   VSZ %VSZ CPU %CPU COMMAND
 3441     1 admin    S    1326m 16.9   1  7.0 /sbin/hal_daemon -f
15096 14697 admin    S     1844  0.0   0  3.0 iotop
13927     2 admin    DW       0  0.0   0  0.5 [kworker/0:8+pm]
 9810 18618 admin    S <  2190m 28.0   0  0.2 /usr/local/apache/bin/apache_proxy -k start -f /etc/apache
 5479     2 admin    SW       0  0.0   0  0.2 [notify thread]
13926     2 admin    IW       0  0.0   0  0.2 [kworker/0:7-kac]
26094 25688 admin    S     857m 10.9   0  0.1 /usr/local/mariadb/bin/mysqld --defaults-file=/etc/qcoolie
 9830     1 admin    S     441m  5.6   1  0.1 /mnt/ext/opt/Python/bin/python /mnt/ext/opt/netmgr/api ser
10394     1 admin    S     222m  2.8   1  0.1 /mnt/ext/opt/Python/bin/python2 /sbin/wsd.py
 8551  8463 admin    S     148m  1.9   0  0.1 {acdd} python /usr/local/network/nmd/nmd.pyc
 8463     1 admin    S     147m  1.8   1  0.1 {nmd} python /usr/local/network/nmd/nmd.pyc
22075     1 admin    S     104m  1.3   1  0.1 /usr/local/bin/snmpd -c /etc/config/snmpd.conf -p 161
22664     1 admin    S    84952  1.0   0  0.1 /sbin/rfsd -i -f /etc/rfsd.conf
26469     1 admin    S    76980  0.9   0  0.1 /sbin/daemon_mgr
11884  9577 admin    R    16180  0.2   1  0.1 top
   10     2 admin    IW       0  0.0   0  0.1 [rcu_sched]
   16     2 admin    SW       0  0.0   1  0.1 [ksoftirqd/1]
 2831     2 admin    IW<      0  0.0   1  0.1 [kworker/1:2H-kb]
17255 16150 httpdusr S    2180m 27.8   1  0.0 /usr/local/apache/bin/apache -k start -c PidFile /var/lock
10741 20178 admin    S    1360m 17.4   0  0.0 /usr/local/apache/bin/apache_proxys -k start -f /etc/apach
14539 14537 admin    S    1212m 15.5   1  0.0 /usr/local/sbin/ncd
13710     1 admin    S    1196m 15.3   0  0.0 /usr/local/sbin/qulogdb --defaults-file=/mnt/ext/opt/QuLog
12222 11744 admin    S     882m 11.2   1  0.0 /usr/local/mariadb/bin/mysqld --defaults-file=/usr/local/m
 7559     1 admin    S     560m  7.1   0  0.0 /mnt/ext/opt/Python/bin/python ./manage.pyc runfcgi method
22489     1 admin    S     549m  7.0   1  0.0 /sbin/upnpd br0 br0
14499     1 admin    S     507m  6.5   0  0.0 /usr/local/sbin/ncdb --defaults-file=/mnt/ext/opt/Notifica
 1562     1 admin    S     409m  5.2   0  0.0 tunnelagent
 1368 17710 Peter Pa S     374m  4.7   1  0.0 /usr/local/samba/sbin/smbd -l /var/log -D -s /etc/config/s
 3293     1 admin    S     360m  4.6   1  0.0 {php-fpm-proxy} php-fpm: master process (/etc/php-fpm-sys-
 3298  3293 admin    S     360m  4.6   0  0.0 {php-fpm-proxy} php-fpm: pool www
 3299  3293 admin    S     360m  4.6   1  0.0 {php-fpm-proxy} php-fpm: pool www
16091     1 admin    S     360m  4.6   1  0.0 {php-fpm-qweb} php-fpm: master process (/etc/config/apache
16092 16091 httpdusr S     360m  4.6   1  0.0 {php-fpm-qweb} php-fpm: pool www
[~] # iotop Total DISK READ: 0.00 B/s | Total DISK WRITE: 4096.00 B/s TID PRIO USER DISK READ DISK WRITE SWAPIN IO> COMMAND 2494 -/0 UNKNOWN 0.00 B/s 4096.00 B/s 0.00 % 6.19 % /usr/sbin/rsyslogd -f /etc/rsyslog_on 3228 be/3 UNKNOWN 0.00 B/s 0.00 B/s 0.00 % 0.01 % [jbd2/md9-] 3 -/4 UNKNOWN 0.00 B/s 0.00 B/s 0.00 % 0.00 % [rcu_g] 4 -/4 UNKNOWN 0.00 B/s 0.00 B/s 0.00 % 0.00 % [rcu_par_g] 8 -/4 UNKNOWN 0.00 B/s 0.00 B/s 0.00 % 0.00 % [mm_percpu_w] 9 -/4 UNKNOWN 0.00 B/s 0.00 B/s 0.00 % 0.00 % [ksoftirqd/] 10 -/4 UNKNOWN 0.00 B/s 0.00 B/s 0.00 % 0.00 % [rcu_sche] 11 -/4 UNKNOWN 0.00 B/s 0.00 B/s 0.00 % 0.00 % [migration/] 13 -/4 UNKNOWN 0.00 B/s 0.00 B/s 0.00 % 0.00 % [cpuhp/] 14 -/4 UNKNOWN 0.00 B/s 0.00 B/s 0.00 % 0.00 % [cpuhp/] 15 -/4 UNKNOWN 0.00 B/s 0.00 B/s 0.00 % 0.00 % [migration/] 16 -/4 UNKNOWN 0.00 B/s 0.00 B/s 0.00 % 0.00 % [ksoftirqd/] 19 -/4 UNKNOWN 0.00 B/s 0.00 B/s 0.00 % 0.00 % [kdevtmpf] 20 -/4 UNKNOWN 0.00 B/s 0.00 B/s 0.00 % 0.00 % [netn] 25 -/4 UNKNOWN 0.00 B/s 0.00 B/s 0.00 % 0.00 % [kaudit] 586 -/4 UNKNOWN 0.00 B/s 0.00 B/s 0.00 % 0.00 % [khungtask] 587 -/4 UNKNOWN 0.00 B/s 0.00 B/s 0.00 % 0.00 % [oom_reape] 588 -/4 UNKNOWN 0.00 B/s 0.00 B/s 0.00 % 0.00 % [writebac] 590 -/4 UNKNOWN 0.00 B/s 0.00 B/s 0.00 % 0.00 % [kcompactd] 591 -/4 UNKNOWN 0.00 B/s 0.00 B/s 0.00 % 0.00 % [ksm] 605 -/4 UNKNOWN 0.00 B/s 0.00 B/s 0.00 % 0.00 % [crypt] 632 -/4 UNKNOWN 0.00 B/s 0.00 B/s 0.00 % 0.00 % [kintegrity] 633 -/4 UNKNOWN 0.00 B/s 0.00 B/s 0.00 % 0.00 % [kblock] 634 -/4 UNKNOWN 0.00 B/s 0.00 B/s 0.00 % 0.00 % [blkcg_punt_bi] 853 -/4 UNKNOWN 0.00 B/s 0.00 B/s 0.00 % 0.00 % [tif] 860 -/4 UNKNOWN 0.00 B/s 0.00 B/s 0.00 % 0.00 % [ata_sf] 880 -/0 UNKNOWN 0.00 B/s 0.00 B/s 0.00 % 0.00 % [m] 899 -/4 UNKNOWN 0.00 B/s 0.00 B/s 0.00 % 0.00 % [watchdog] 916 -/4 UNKNOWN 0.00 B/s 0.00 B/s 0.00 % 0.00 % [kworker/0:1H-kblock] 998 -/4 UNKNOWN 0.00 B/s 0.00 B/s 0.00 % 0.00 % [rpcio] 1000 -/4 UNKNOWN 0.00 B/s 0.00 B/s 0.00 % 0.00 % [xprtio] 1037 -/0 UNKNOWN 0.00 B/s 0.00 B/s 0.00 % 0.00 % [kswapd] 1038 -/4 UNKNOWN 0.00 B/s 0.00 B/s 0.00 % 0.00 % [ecryptfs-kthre] 1041 -/4 UNKNOWN 0.00 B/s 0.00 B/s 0.00 % 0.00 % [nfsio] 1042 -/4 UNKNOWN 0.00 B/s 0.00 B/s 0.00 % 0.00 % [cifsio]@schtallone sagte in Performance Probleme durch Shelly Adapter?:
Dies ist so 10 min her:
eher weniger
@schtallone sagte in Performance Probleme durch Shelly Adapter?:
Load average: 2.02 2.23 3.09
der Load average 10min ist noch deutlich höher, der load average 5 Minuten noch leicht höher als der der ketzten Minute.
Wenn jetzt wirklich alles aus ist hast du ein echtes Problem.
Dein load average ist ohne Arbeit bereits "auf Kante". über 2 darf er nicht sein.
der swap ist hier leider nicht zu sehen.
-
@schtallone sagte in Performance Probleme durch Shelly Adapter?:
Dies ist so 10 min her:
eher weniger
@schtallone sagte in Performance Probleme durch Shelly Adapter?:
Load average: 2.02 2.23 3.09
der Load average 10min ist noch deutlich höher, der load average 5 Minuten noch leicht höher als der der ketzten Minute.
Wenn jetzt wirklich alles aus ist hast du ein echtes Problem.
Dein load average ist ohne Arbeit bereits "auf Kante". über 2 darf er nicht sein.
der swap ist hier leider nicht zu sehen.
CPU: 25.8% usr 14.8% sys  0.1% nic 58.9% idle  0.1% io  0.0% irq  0.1% sirq
Load average: 1.79 1.93 2.09 4/893 16071
  PID  PPID USER     STAT   VSZ %VSZ CPU %CPU COMMAND
 3441     1 admin    S    1326m 16.9   1  6.8 /sbin/hal_daemon -f
15096 14697 admin    S     1844  0.0   0  2.9 iotop
13927     2 admin    DW       0  0.0   0  0.5 [kworker/0:8+pm]
 9810 18618 admin    S <  2190m 28.0   0  0.3 /usr/local/apache/bin/apache_proxy -k start -f /etc/apache
10394     1 admin    S     222m  2.8   0  0.2 /mnt/ext/opt/Python/bin/python2 /sbin/wsd.py
 8493  8463 admin    S     219m  2.8   0  0.2 {ncaas} python /usr/local/network/nmd/nmd.pyc
 5479     2 admin    SW       0  0.0   1  0.2 [notify thread]
 3966     2 admin    IW       0  0.0   0  0.2 [kworker/0:1-kac]
12222 11744 admin    S     882m 11.2   1  0.1 /usr/local/mariadb/bin/mysqld --defaults-file=/usr/local/m
17751     1 admin    S     252m  3.2   0  0.1 /usr/local/samba/sbin/nmbd -l /var/log -D -s /etc/config/s
 8545  8463 admin    S     222m  2.8   0  0.1 {gwd} python /usr/local/network/nmd/nmd.pyc
20813     1 admin    S     162m  2.0   0  0.1 /usr/local/bin/hda_qmonitor -pid:24141 -reg:/mnt/HDA_ROOT
12510     1 admin    S     109m  1.4   0  0.1 /sbin/qpkgd -d0
18490     1 admin    S    90188  1.1   0  0.1 /usr/local/sbin/_thttpd_ -p 58080 -nor -nos -u admin -d /h
19118     1 httpdusr S    74864  0.9   0  0.1 /sbin/lpb_scheduler -d
11426     1 admin    S    74752  0.9   1  0.1 /sbin/vdd_control -d
   10     2 admin    IW       0  0.0   1  0.1 [rcu_sched]
    9     2 admin    SW       0  0.0   0  0.1 [ksoftirqd/0]
 1559     2 admin    IW       0  0.0   1  0.1 [kworker/1:5-eve]
17255 16150 httpdusr S    2180m 27.8   1  0.0 /usr/local/apache/bin/apache -k start -c PidFile /var/lock
10741 20178 admin    S    1360m 17.4   0  0.0 /usr/local/apache/bin/apache_proxys -k start -f /etc/apach
14539 14537 admin    S    1212m 15.5   1  0.0 /usr/local/sbin/ncd
13710     1 admin    S    1196m 15.3   0  0.0 /usr/local/sbin/qulogdb --defaults-file=/mnt/ext/opt/QuLog
26094 25688 admin    S     857m 10.9   0  0.0 /usr/local/mariadb/bin/mysqld --defaults-file=/etc/qcoolie
 7559     1 admin    S     560m  7.1   0  0.0 /mnt/ext/opt/Python/bin/python ./manage.pyc runfcgi method
22489     1 admin    S     549m  7.0   1  0.0 /sbin/upnpd br0 br0
14499     1 admin    S     507m  6.5   1  0.0 /usr/local/sbin/ncdb --defaults-file=/mnt/ext/opt/Notifica
 9830     1 admin    S     441m  5.6   0  0.0 /mnt/ext/opt/Python/bin/python /mnt/ext/opt/netmgr/api ser
 1562     1 admin    S     409m  5.2   0  0.0 tunnelagent
 1368 17710 Peter Pa S     374m  4.7   1  0.0 /usr/local/samba/sbin/smbd -l /var/log -D -s /etc/config/s
 3293     1 admin    S     360m  4.6   0  0.0 {php-fpm-proxy} php-fpm: master process (/etc/php-fpm-sys-
 3298  3293 admin    S     360m  4.6   0  0.0 {php-fpm-proxy} php-fpm: pool www
 3299  3293 admin    S     360m  4.6   1  0.0 {php-fpm-proxy} php-fpm: pool www
SwapIn über 0%, hatte vorher auch die Speicherbreinigung laufen gelassen.
[~] # iotop Total DISK READ: 0.00 B/s | Total DISK WRITE: 4096.00 B/s TID PRIO USER DISK READ DISK WRITE SWAPIN IO> COMMAND 2494 -/0 UNKNOWN 0.00 B/s 4096.00 B/s 0.00 % 6.19 % /usr/sbin/rsyslogd -f /etc/rsyslog_on 3228 be/3 UNKNOWN 0.00 B/s 0.00 B/s 0.00 % 0.01 % [jbd2/md9-] 3 -/4 UNKNOWN 0.00 B/s 0.00 B/s 0.00 % 0.00 % [rcu_g] 4 -/4 UNKNOWN 0.00 B/s 0.00 B/s 0.00 % 0.00 % [rcu_par_g] 8 -/4 UNKNOWN 0.00 B/s 0.00 B/s 0.00 % 0.00 % [mm_percpu_w] 9 -/4 UNKNOWN 0.00 B/s 0.00 B/s 0.00 % 0.00 % [ksoftirqd/] 10 -/4 UNKNOWN 0.00 B/s 0.00 B/s 0.00 % 0.00 % [rcu_sche] -
CPU: 25.8% usr 14.8% sys  0.1% nic 58.9% idle  0.1% io  0.0% irq  0.1% sirq
Load average: 1.79 1.93 2.09 4/893 16071
  PID  PPID USER     STAT   VSZ %VSZ CPU %CPU COMMAND
 3441     1 admin    S    1326m 16.9   1  6.8 /sbin/hal_daemon -f
15096 14697 admin    S     1844  0.0   0  2.9 iotop
13927     2 admin    DW       0  0.0   0  0.5 [kworker/0:8+pm]
 9810 18618 admin    S <  2190m 28.0   0  0.3 /usr/local/apache/bin/apache_proxy -k start -f /etc/apache
10394     1 admin    S     222m  2.8   0  0.2 /mnt/ext/opt/Python/bin/python2 /sbin/wsd.py
 8493  8463 admin    S     219m  2.8   0  0.2 {ncaas} python /usr/local/network/nmd/nmd.pyc
 5479     2 admin    SW       0  0.0   1  0.2 [notify thread]
 3966     2 admin    IW       0  0.0   0  0.2 [kworker/0:1-kac]
12222 11744 admin    S     882m 11.2   1  0.1 /usr/local/mariadb/bin/mysqld --defaults-file=/usr/local/m
17751     1 admin    S     252m  3.2   0  0.1 /usr/local/samba/sbin/nmbd -l /var/log -D -s /etc/config/s
 8545  8463 admin    S     222m  2.8   0  0.1 {gwd} python /usr/local/network/nmd/nmd.pyc
20813     1 admin    S     162m  2.0   0  0.1 /usr/local/bin/hda_qmonitor -pid:24141 -reg:/mnt/HDA_ROOT
12510     1 admin    S     109m  1.4   0  0.1 /sbin/qpkgd -d0
18490     1 admin    S    90188  1.1   0  0.1 /usr/local/sbin/_thttpd_ -p 58080 -nor -nos -u admin -d /h
19118     1 httpdusr S    74864  0.9   0  0.1 /sbin/lpb_scheduler -d
11426     1 admin    S    74752  0.9   1  0.1 /sbin/vdd_control -d
   10     2 admin    IW       0  0.0   1  0.1 [rcu_sched]
    9     2 admin    SW       0  0.0   0  0.1 [ksoftirqd/0]
 1559     2 admin    IW       0  0.0   1  0.1 [kworker/1:5-eve]
17255 16150 httpdusr S    2180m 27.8   1  0.0 /usr/local/apache/bin/apache -k start -c PidFile /var/lock
10741 20178 admin    S    1360m 17.4   0  0.0 /usr/local/apache/bin/apache_proxys -k start -f /etc/apach
14539 14537 admin    S    1212m 15.5   1  0.0 /usr/local/sbin/ncd
13710     1 admin    S    1196m 15.3   0  0.0 /usr/local/sbin/qulogdb --defaults-file=/mnt/ext/opt/QuLog
26094 25688 admin    S     857m 10.9   0  0.0 /usr/local/mariadb/bin/mysqld --defaults-file=/etc/qcoolie
 7559     1 admin    S     560m  7.1   0  0.0 /mnt/ext/opt/Python/bin/python ./manage.pyc runfcgi method
22489     1 admin    S     549m  7.0   1  0.0 /sbin/upnpd br0 br0
14499     1 admin    S     507m  6.5   1  0.0 /usr/local/sbin/ncdb --defaults-file=/mnt/ext/opt/Notifica
 9830     1 admin    S     441m  5.6   0  0.0 /mnt/ext/opt/Python/bin/python /mnt/ext/opt/netmgr/api ser
 1562     1 admin    S     409m  5.2   0  0.0 tunnelagent
 1368 17710 Peter Pa S     374m  4.7   1  0.0 /usr/local/samba/sbin/smbd -l /var/log -D -s /etc/config/s
 3293     1 admin    S     360m  4.6   0  0.0 {php-fpm-proxy} php-fpm: master process (/etc/php-fpm-sys-
 3298  3293 admin    S     360m  4.6   0  0.0 {php-fpm-proxy} php-fpm: pool www
 3299  3293 admin    S     360m  4.6   1  0.0 {php-fpm-proxy} php-fpm: pool www
SwapIn über 0%, hatte vorher auch die Speicherbreinigung laufen gelassen.
[~] # iotop Total DISK READ: 0.00 B/s | Total DISK WRITE: 4096.00 B/s TID PRIO USER DISK READ DISK WRITE SWAPIN IO> COMMAND 2494 -/0 UNKNOWN 0.00 B/s 4096.00 B/s 0.00 % 6.19 % /usr/sbin/rsyslogd -f /etc/rsyslog_on 3228 be/3 UNKNOWN 0.00 B/s 0.00 B/s 0.00 % 0.01 % [jbd2/md9-] 3 -/4 UNKNOWN 0.00 B/s 0.00 B/s 0.00 % 0.00 % [rcu_g] 4 -/4 UNKNOWN 0.00 B/s 0.00 B/s 0.00 % 0.00 % [rcu_par_g] 8 -/4 UNKNOWN 0.00 B/s 0.00 B/s 0.00 % 0.00 % [mm_percpu_w] 9 -/4 UNKNOWN 0.00 B/s 0.00 B/s 0.00 % 0.00 % [ksoftirqd/] 10 -/4 UNKNOWN 0.00 B/s 0.00 B/s 0.00 % 0.00 % [rcu_sche]@schtallone sagte in Performance Probleme durch Shelly Adapter?:
SwapIn über 0%,
???
@schtallone sagte in Performance Probleme durch Shelly Adapter?:
hatte vorher auch die Speicherbreinigung laufen gelassen.
das ist dann kontraproduktiv
vor dem Nachsehen, oder vor dem Abschalten?@schtallone sagte in Performance Probleme durch Shelly Adapter?:
Load average: 1.79 1.93 2.09 4/893 16071
da kommen wir kangsam aus dem roten Beteich!
Aber normal ist das nicht!hast du Meldungen im S.M.A.R.T?
-
@dp20eic
ja es greifen auch unter anderem ein PC, vor dem ich sitze auf das NAS zu. Ich glaube das ist auch der SInn der Sache.Aber was ist denn jetzt nun mit der einen Aussage, dass diue load Average nicht nur auf den iob, sondern auf das gesamte NAS bezogen ist?
Gruß
@schtallone sagte in Performance Probleme durch Shelly Adapter?:
ja es greifen auch unter anderem ein PC, vor dem ich sitze auf das NAS zu. Ich glaube das ist auch der SInn der Sache.
Moin,
ja, das wollte ich nicht in Abrede stellen, nur wenn dann mal die SMB Verbindung aus welchen Gründen auch immer abkackt, kommt es auf dem Host zu einer höheren Last, weil der SMB Server versucht die Verbindung aufrecht zu halten, ganz am Anfang waren da mal Zombie Prozesse, die sind dann aber nach dem Reboot natürlich weggeräumt.
@schtallone sagte in Performance Probleme durch Shelly Adapter?:
Aber was ist denn jetzt nun mit der einen Aussage, dass diue load Average nicht nur auf den iob, sondern auf das gesamte NAS bezogen ist?
Da hab ich weiter oben auch gesehen, dass da ein
rsyslogläuft, was steht denn im SYSLOG der QNAP?

VG
BerndEdit
ich würde mal alle SMB Verbindungen trennen und schauen, ob der Load weiter herunterkommt. -
@schtallone sagte in Performance Probleme durch Shelly Adapter?:
SwapIn über 0%,
???
@schtallone sagte in Performance Probleme durch Shelly Adapter?:
hatte vorher auch die Speicherbreinigung laufen gelassen.
das ist dann kontraproduktiv
vor dem Nachsehen, oder vor dem Abschalten?@schtallone sagte in Performance Probleme durch Shelly Adapter?:
Load average: 1.79 1.93 2.09 4/893 16071
da kommen wir kangsam aus dem roten Beteich!
Aber normal ist das nicht!hast du Meldungen im S.M.A.R.T?
@homoran said in Performance Probleme durch Shelly Adapter?:
@schtallone sagte in Performance Probleme durch Shelly Adapter?:
SwapIn über 0%,
???
@schtallone sagte in Performance Probleme durch Shelly Adapter?:
hatte vorher auch die Speicherbreinigung laufen gelassen.
das ist dann kontraproduktiv
vor dem Nachsehen, oder vor dem Abschalten?nach dem Abschalter aller APPS und vor dem Auslesen der Daten
@schtallone sagte in Performance Probleme durch Shelly Adapter?:
Load average: 1.79 1.93 2.09 4/893 16071
da kommen wir kangsam aus dem roten Beteich!
Aber normal ist das nicht!hast du Meldungen im S.M.A.R.T?
ja, ID197 und 198 seit ca. 20 Wochen. Habe Suche nach defekten Blöcken ohne Ergbnis mehrfach gemacht. Habe aber jetzt noch keine neue Festplatte besorgt. Jetzt werde ich wohl gesteinigt.....
-
@homoran said in Performance Probleme durch Shelly Adapter?:
@schtallone sagte in Performance Probleme durch Shelly Adapter?:
SwapIn über 0%,
???
@schtallone sagte in Performance Probleme durch Shelly Adapter?:
hatte vorher auch die Speicherbreinigung laufen gelassen.
das ist dann kontraproduktiv
vor dem Nachsehen, oder vor dem Abschalten?nach dem Abschalter aller APPS und vor dem Auslesen der Daten
@schtallone sagte in Performance Probleme durch Shelly Adapter?:
Load average: 1.79 1.93 2.09 4/893 16071
da kommen wir kangsam aus dem roten Beteich!
Aber normal ist das nicht!hast du Meldungen im S.M.A.R.T?
ja, ID197 und 198 seit ca. 20 Wochen. Habe Suche nach defekten Blöcken ohne Ergbnis mehrfach gemacht. Habe aber jetzt noch keine neue Festplatte besorgt. Jetzt werde ich wohl gesteinigt.....
@schtallone sagte in Performance Probleme durch Shelly Adapter?:
Jetzt werde ich wohl gesteinigt.....
da verkauft doch jemand Steine!
...und Bärteund ja!
wir fragen danach schon ewig!kein Support per PN! - Fragen im Forum stellen -
Benutzt das Voting rechts unten im Beitrag wenn er euch geholfen hat.
Das Forum freut sich über eine Spende. Benutzt dazu den Spendenbutton oben rechts. Danke!
der Installationsfixer: curl -fsL https://iobroker.net/fix.sh | bash - -
@schtallone sagte in Performance Probleme durch Shelly Adapter?:
Jetzt werde ich wohl gesteinigt.....
da verkauft doch jemand Steine!
...und Bärteund ja!
wir fragen danach schon ewig!@homoran sagte in Performance Probleme durch Shelly Adapter?:
da verkauft doch jemand Steine!
...und BärteOT:
 Das kennt auch nicht mehr jede Altersklasse
-
@schtallone sagte in Performance Probleme durch Shelly Adapter?:
Jetzt werde ich wohl gesteinigt.....
da verkauft doch jemand Steine!
...und Bärteund ja!
wir fragen danach schon ewig!@homoran
korrektur:; nicht 20 Wochen, 2 Wochen.Also nach SMART gefragt worden zu sein, habe ich wohl übersehen... Oder es wurde nicht so klar gefragt, wie eben gerade.
-
@homoran sagte in Performance Probleme durch Shelly Adapter?:
da verkauft doch jemand Steine!
...und BärteOT:
Das kennt auch nicht mehr jede Altersklasse @fredf Sie wars Sie wars, ähhm Er war Er wars.....
-
@schtallone sagte in Performance Probleme durch Shelly Adapter?:
Jetzt werde ich wohl gesteinigt.....
da verkauft doch jemand Steine!
...und Bärteund ja!
wir fragen danach schon ewig!@homoran
Ich werde mir eine neue Festplatte besorgen. Ist nen RAID 0 Verbund. Ich tausche 1 Platte aus -
@homoran
korrektur:; nicht 20 Wochen, 2 Wochen.Also nach SMART gefragt worden zu sein, habe ich wohl übersehen... Oder es wurde nicht so klar gefragt, wie eben gerade.
@schtallone sagte in Performance Probleme durch Shelly Adapter?:
Oder es wurde nicht so klar gefragt, wie eben gerade.
nö, erst allgemein nach I/O, dann nach Festplatten.
kein Support per PN! - Fragen im Forum stellen -
Benutzt das Voting rechts unten im Beitrag wenn er euch geholfen hat.
Das Forum freut sich über eine Spende. Benutzt dazu den Spendenbutton oben rechts. Danke!
der Installationsfixer: curl -fsL https://iobroker.net/fix.sh | bash - -
@schtallone sagte in Performance Probleme durch Shelly Adapter?:
Oder es wurde nicht so klar gefragt, wie eben gerade.
nö, erst allgemein nach I/O, dann nach Festplatten.
Also wissen, dass man seit 2 Wochen eine defekte Platte hat und dann hier die User beschäftigen ...
--> ohne Worte
-
CPU: 25.8% usr 14.8% sys  0.1% nic 58.9% idle  0.1% io  0.0% irq  0.1% sirq
Load average: 1.79 1.93 2.09 4/893 16071
  PID  PPID USER     STAT   VSZ %VSZ CPU %CPU COMMAND
 3441     1 admin    S    1326m 16.9   1  6.8 /sbin/hal_daemon -f
15096 14697 admin    S     1844  0.0   0  2.9 iotop
13927     2 admin    DW       0  0.0   0  0.5 [kworker/0:8+pm]
 9810 18618 admin    S <  2190m 28.0   0  0.3 /usr/local/apache/bin/apache_proxy -k start -f /etc/apache
10394     1 admin    S     222m  2.8   0  0.2 /mnt/ext/opt/Python/bin/python2 /sbin/wsd.py
 8493  8463 admin    S     219m  2.8   0  0.2 {ncaas} python /usr/local/network/nmd/nmd.pyc
 5479     2 admin    SW       0  0.0   1  0.2 [notify thread]
 3966     2 admin    IW       0  0.0   0  0.2 [kworker/0:1-kac]
12222 11744 admin    S     882m 11.2   1  0.1 /usr/local/mariadb/bin/mysqld --defaults-file=/usr/local/m
17751     1 admin    S     252m  3.2   0  0.1 /usr/local/samba/sbin/nmbd -l /var/log -D -s /etc/config/s
 8545  8463 admin    S     222m  2.8   0  0.1 {gwd} python /usr/local/network/nmd/nmd.pyc
20813     1 admin    S     162m  2.0   0  0.1 /usr/local/bin/hda_qmonitor -pid:24141 -reg:/mnt/HDA_ROOT
12510     1 admin    S     109m  1.4   0  0.1 /sbin/qpkgd -d0
18490     1 admin    S    90188  1.1   0  0.1 /usr/local/sbin/_thttpd_ -p 58080 -nor -nos -u admin -d /h
19118     1 httpdusr S    74864  0.9   0  0.1 /sbin/lpb_scheduler -d
11426     1 admin    S    74752  0.9   1  0.1 /sbin/vdd_control -d
   10     2 admin    IW       0  0.0   1  0.1 [rcu_sched]
    9     2 admin    SW       0  0.0   0  0.1 [ksoftirqd/0]
 1559     2 admin    IW       0  0.0   1  0.1 [kworker/1:5-eve]
17255 16150 httpdusr S    2180m 27.8   1  0.0 /usr/local/apache/bin/apache -k start -c PidFile /var/lock
10741 20178 admin    S    1360m 17.4   0  0.0 /usr/local/apache/bin/apache_proxys -k start -f /etc/apach
14539 14537 admin    S    1212m 15.5   1  0.0 /usr/local/sbin/ncd
13710     1 admin    S    1196m 15.3   0  0.0 /usr/local/sbin/qulogdb --defaults-file=/mnt/ext/opt/QuLog
26094 25688 admin    S     857m 10.9   0  0.0 /usr/local/mariadb/bin/mysqld --defaults-file=/etc/qcoolie
 7559     1 admin    S     560m  7.1   0  0.0 /mnt/ext/opt/Python/bin/python ./manage.pyc runfcgi method
22489     1 admin    S     549m  7.0   1  0.0 /sbin/upnpd br0 br0
14499     1 admin    S     507m  6.5   1  0.0 /usr/local/sbin/ncdb --defaults-file=/mnt/ext/opt/Notifica
 9830     1 admin    S     441m  5.6   0  0.0 /mnt/ext/opt/Python/bin/python /mnt/ext/opt/netmgr/api ser
 1562     1 admin    S     409m  5.2   0  0.0 tunnelagent
 1368 17710 Peter Pa S     374m  4.7   1  0.0 /usr/local/samba/sbin/smbd -l /var/log -D -s /etc/config/s
 3293     1 admin    S     360m  4.6   0  0.0 {php-fpm-proxy} php-fpm: master process (/etc/php-fpm-sys-
 3298  3293 admin    S     360m  4.6   0  0.0 {php-fpm-proxy} php-fpm: pool www
 3299  3293 admin    S     360m  4.6   1  0.0 {php-fpm-proxy} php-fpm: pool www
SwapIn über 0%, hatte vorher auch die Speicherbreinigung laufen gelassen.
[~] # iotop Total DISK READ: 0.00 B/s | Total DISK WRITE: 4096.00 B/s TID PRIO USER DISK READ DISK WRITE SWAPIN IO> COMMAND 2494 -/0 UNKNOWN 0.00 B/s 4096.00 B/s 0.00 % 6.19 % /usr/sbin/rsyslogd -f /etc/rsyslog_on 3228 be/3 UNKNOWN 0.00 B/s 0.00 B/s 0.00 % 0.01 % [jbd2/md9-] 3 -/4 UNKNOWN 0.00 B/s 0.00 B/s 0.00 % 0.00 % [rcu_g] 4 -/4 UNKNOWN 0.00 B/s 0.00 B/s 0.00 % 0.00 % [rcu_par_g] 8 -/4 UNKNOWN 0.00 B/s 0.00 B/s 0.00 % 0.00 % [mm_percpu_w] 9 -/4 UNKNOWN 0.00 B/s 0.00 B/s 0.00 % 0.00 % [ksoftirqd/] 10 -/4 UNKNOWN 0.00 B/s 0.00 B/s 0.00 % 0.00 % [rcu_sche]@schtallone sagte in Performance Probleme durch Shelly Adapter?:
CPU: 25.8% usr 14.8% sys 0.1% nic 58.9% idle 0.1% io 0.0% irq 0.1% sirq
Moin,
was ich wirklich nicht verstehe, sind die Werte für
nicund nur 0,1 % für Idle.
Erklärung für die Werte:
CPU-ZeileAbkürzung Bedeutung us user - Zeit, die von ungeniceten Benutzerprozessen verwendet wird sy system - Zeit, die von Kernelprozessen verwendet wird ni nice - Zeit, die von ge"nice"ten Userprozessen verwendet wird id idle - Zeit, die das System im Leerlauf verbringt wa IO-wait - Zeit, die auf Datenverarbeitung gewartet wird (gibt Hinweise auf Engpässe bei der Datenträgergeschwindigkeit) hi Zeit, die auf das Bearbeiten von Hardware Interrupts verwendet wird si Zeit, die auf das Bearbeiten von Software Interrupts verwendet wird st stolen - Zeit, die von der laufenden Virtuellen Maschine vom Hypervisor für andere Aufgaben gestohlen wird (z.B. für andere VM) Bei Dir ist ni=~60 % <- also sind dort einige Prozesse ge-niced, sprich eine andere Priorität als
0am Laufen,nicegeht von-20höchste Priorität über0 = Standardbis+19niedrigste Priorität.
Auf der anderen Seite, Dein System hat keinidle, nur 0.1 %, ist also nie im Leerlauf???Schau mal wie Du bei Dir
topso aufrufen kannst, das auchniangezeigt wird, wie bei mirtop - 19:09:57 up 41 days, 10:37, 1 user, load average: 1.73, 1.75, 3.68 [IO: 0.68, 0.88, 2.80 CPU: 1.05, 0.88, 0.88] Tasks: 813 total, 1 running, 812 sleeping, 0 stopped, 0 zombie %Cpu(s): 3.6 us, 3.9 sy, 0.0 ni, 92.5 id, 0.0 wa, 0.0 hi, 0.0 si, 0.0 st GiB Mem : 7.718 total, 0.997 free, 3.171 used, 3.550 buff/cache GiB Swap: 6.633 total, 3.947 free, 2.686 used. 4.180 avail Mem || \/ PID USER PR NI VIRT RES %CPU %MEM TIME+ S COMMAND 12828 root 20 0 57.3m 2.5m 3.846 0.032 776:16.38 S synostgd-space 18292 dp20eic 20 0 34.1m 2.7m 3.846 0.035 0:15.33 R top 17518 root 20 0 835.6m 8.4m 2.564 0.106 658:38.72 S /usr/syno/bin/scemd 20309 104 20 0 62.4m 8.5m 2.564 0.107 761:48.40 S /usr/sbin/mosquitto -c /mqtt/config/mosquitto.conf 2903 1000 20 0 3366.4m 72.7m 1.282 0.920 60:59.37 S emqx -Bd -spp true -A 4 -IOt 4 -SDio 8 -e 262144 -zdbbl 8192 -Q 1048576 -P 2097152 -- -root /op+ 2955 1000 20 0 3360.9m 68.4m 1.282 0.866 58:10.59 S emqx -Bd -spp true -A 4 -IOt 4 -SDio 8 -e 262144 -zdbbl 8192 -Q 1048576 -P 2097152 -- -root /op+ 18 root 20 0 0.0m 0.0m 0.641 0.000 27:02.42 S [ksoftirqd/2]VG
Bernd

Hey! Du scheinst an dieser Unterhaltung interessiert zu sein, hast aber noch kein Konto.
Hast du es satt, bei jedem Besuch durch die gleichen Beiträge zu scrollen? Wenn du dich für ein Konto anmeldest, kommst du immer genau dorthin zurück, wo du zuvor warst, und kannst dich über neue Antworten benachrichtigen lassen (entweder per E-Mail oder Push-Benachrichtigung). Du kannst auch Lesezeichen speichern und Beiträge positiv bewerten, um anderen Community-Mitgliedern deine Wertschätzung zu zeigen.
Mit deinem Input könnte dieser Beitrag noch besser werden 💗
Registrieren Anmelden389
Online33.0k
Benutzer83.5k
Themen1.3m
Beiträge