[erl] XY Grafik Grafana, Heizkurve via csv-Datei darstellen
-
Hi,
ich habe vor ca. 5 Monaten die Heizkurve einer Wolf Heizung via einer csv-Datei in grafana eingebunden und zusätzlich y-Verschiebung und Sollvorlauftemperatur über Aussentemperatur eingebunden. Seit ca. 1 Woche wird die Grafik nicht mehr angezeigt und die X- und Y-Werte sind nicht mehr anwählbar, s. Screenshot. Die Tabelle wird noch angezeigt jedoch beim Umschalten auf Grafik kommt "Err". Ich komme nicht mehr weiter!?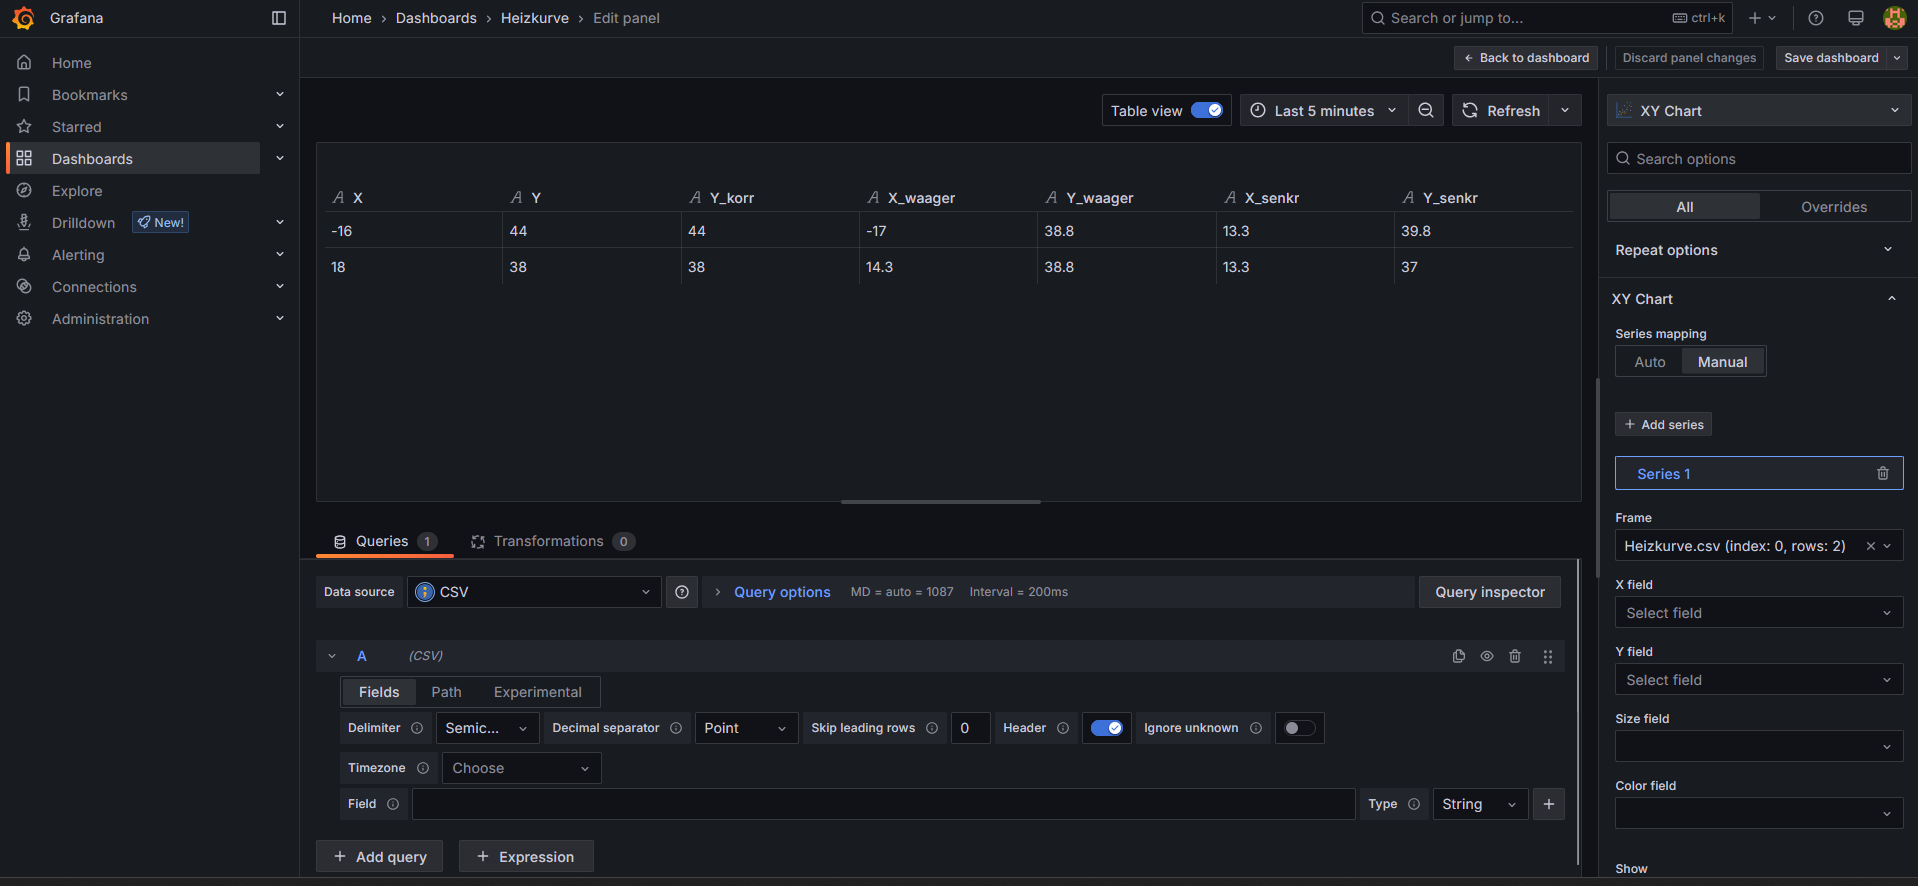
Es genügen, wenn ich die Grundgrafik mit der Spalte x und y wieder hinbekommen würde.
VG Axel -
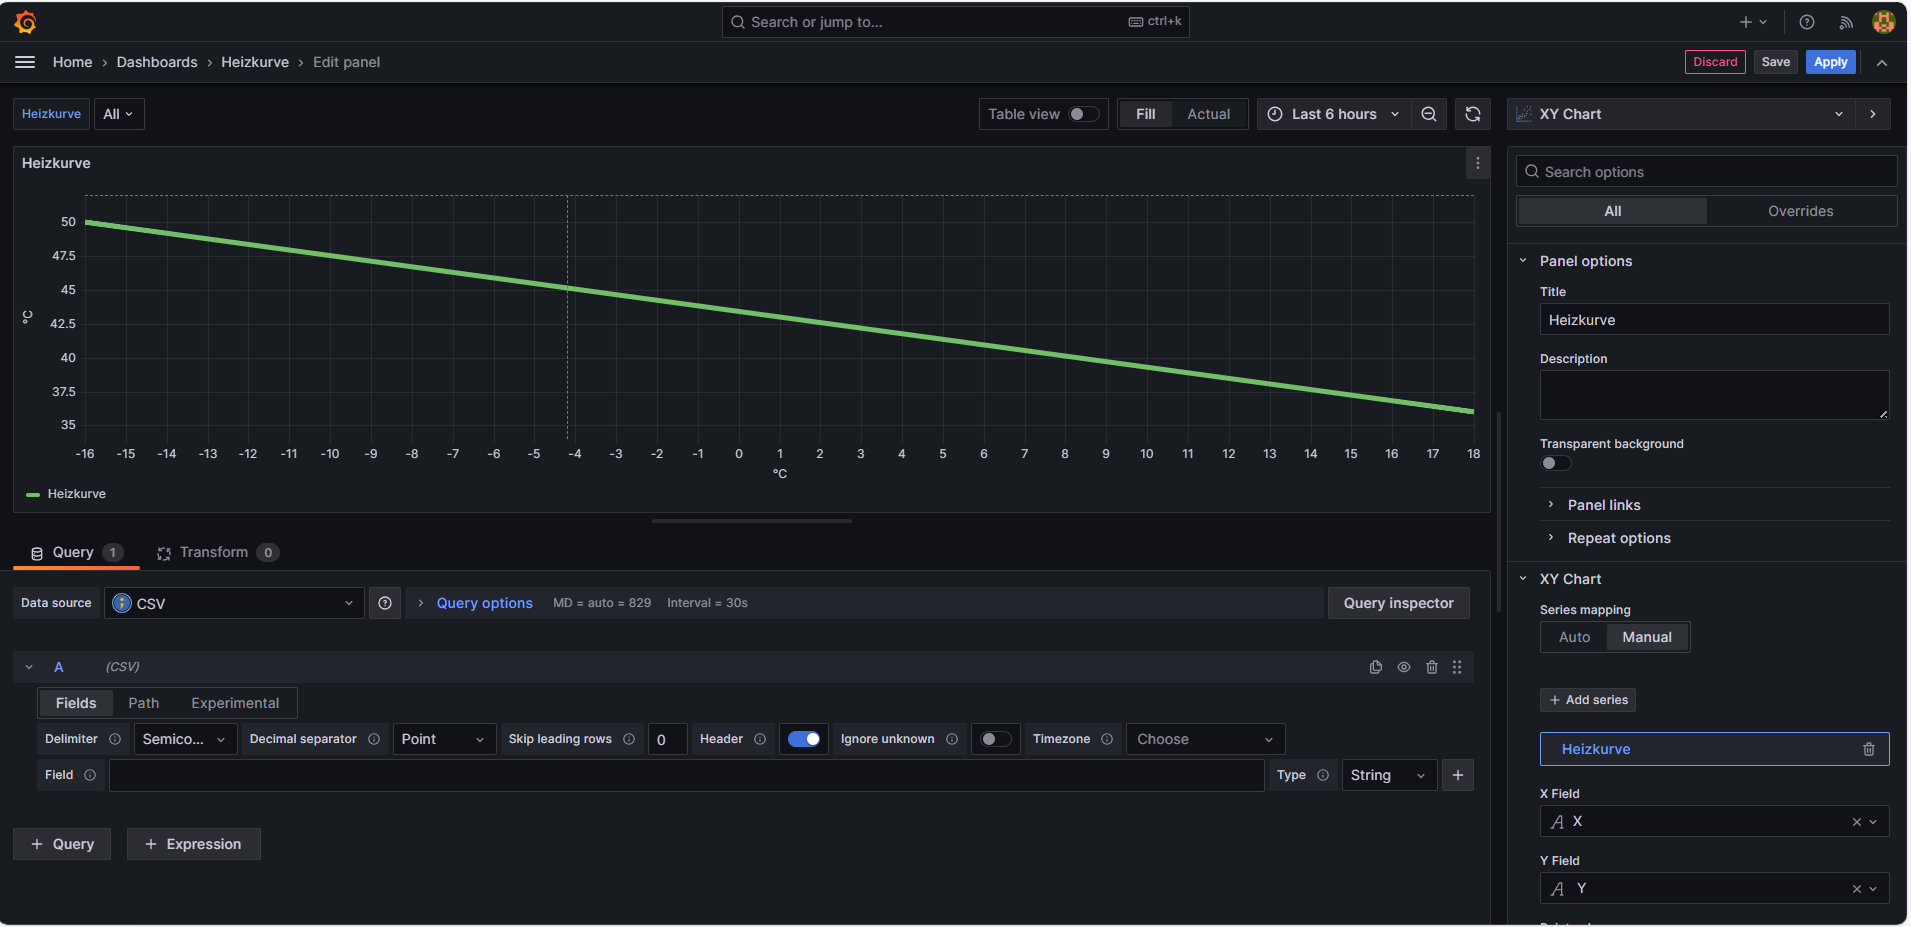
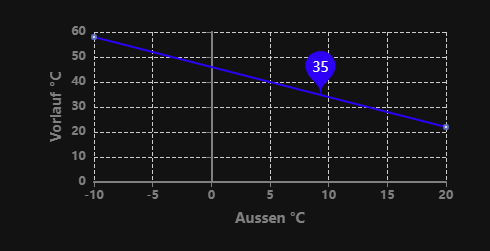
@afi Hi, so sah es mal im Januar aus, wenn nur x- und y- Spalte für die Heizkurvendarstellung verwendet wurde.
Habe inzwischen die csv-Datei neu aufgesetzt, jedoch ohne erfolg. Hat noch niemand mit csv-Dateien und xy-chart gearbeitet?
VG
-
@afi Braucht jemand noch mehr Infos um möglicherweise helfen zu können?
-
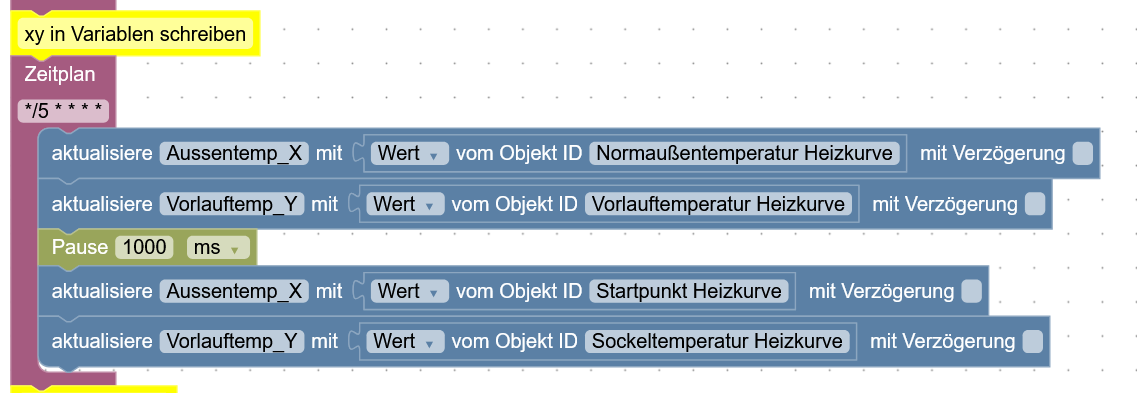
@afi Hi, ich versuche gerade die Daten der Heizkurve unter ioBroker in Variablen zu schreiben mit folgendem Blockly:
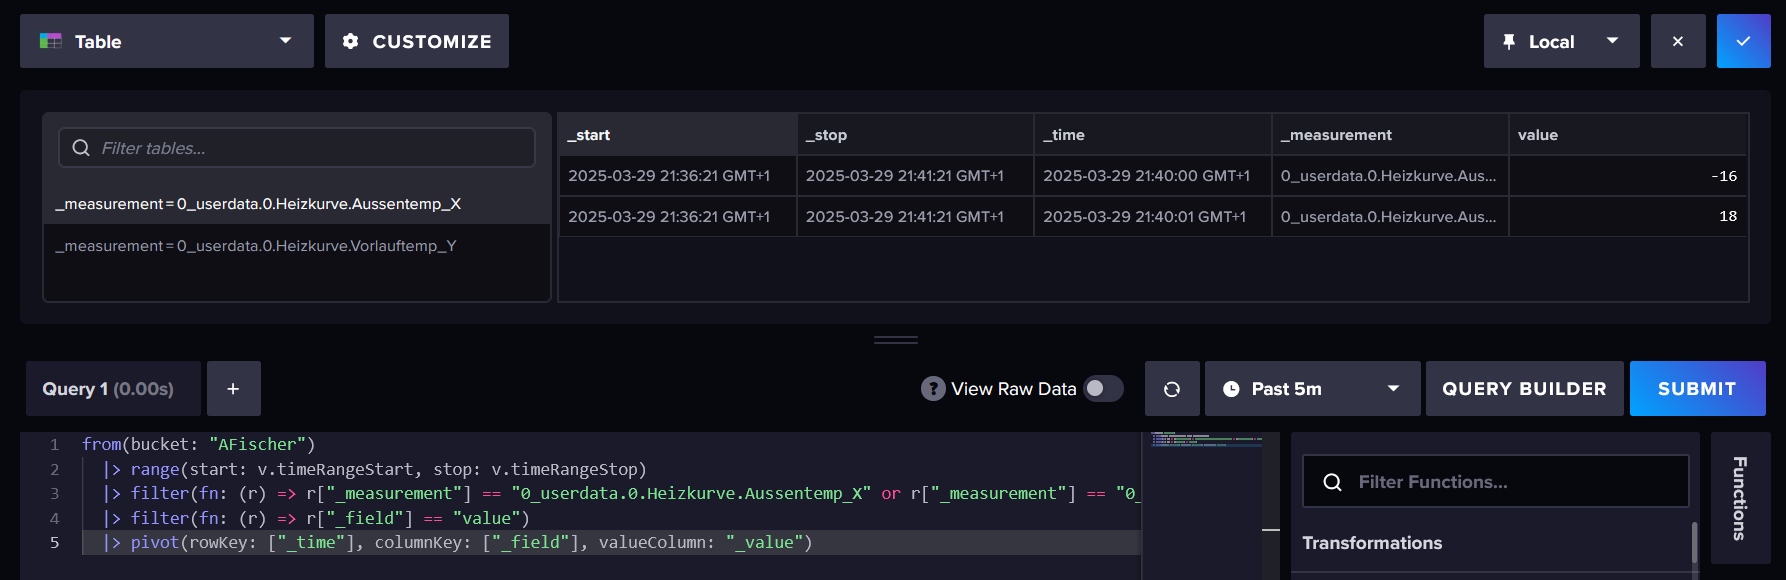
In InfluxDB versuche ich mit Query eine Tabelle zu erstellen, in der die x-Werte und y-Werte jeweils eine Spalte darstellen, leider gelingt mir dies bisher auch nicht, aber eventuell ist dies die richtige Richtung um von der CSV-Lösung abschied zu nehmen.
VG Axel
-
@afi
oder ohne Aufzeichnung als Flexchart und per script die aktuellen Werte schreiben?
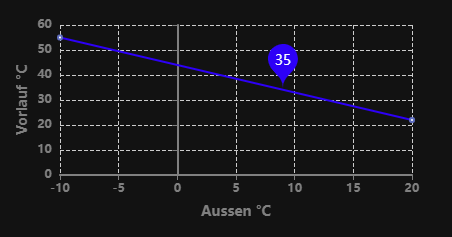
option = option = { "tooltip": { "trigger": "axis" }, "xAxis": { "type": "value", "name": "Aussen °C", "nameLocation": "middle", "nameGap": 30, "nameTextStyle": { "fontSize": 14, "fontWeight": "bold", "color": "gray" }, "axisLine": { "lineStyle": { "width": 2, "color": "gray" } }, "splitLine": { "lineStyle": { "type": "dashed", "color": "#ccc" } }, "axisLabel": { "fontSize": 12, "fontWeight": "bold" } }, "yAxis": { "type": "value", "name": "Vorlauf °C", "nameLocation": "middle", "nameRotate": 90, "nameGap": 30, "nameTextStyle": { "fontSize": 14, "fontWeight": "bold", "color": "gray" }, "axisLine": { "lineStyle": { "width": 2, "color": "gray" } }, "splitLine": { "lineStyle": { "type": "dashed", "color": "#ccc" } }, "axisLabel": { "fontSize": 12, "fontWeight": "bold" } }, "series": [ { "name": "Linie", "type": "line", "data": [ [-10, 55], [20, 22] ], "markPoint": { "data": [ { "coord": [9, 35], "name": "Pin", "symbol": "pin", "symbolSize": 50, "itemStyle": { "color": "blue" }, "label": { "show": true, "formatter": "35", "position": "inside", "color": "white", "fontSize": 14 }} ] }} ], "lineStyle": { "color": "blue" }, "backgroundColor": "transparent" }; -
@ullij Hi Ulli, Script wäre für mich was ganz neues und Flexchart sagt mir noch nichts.
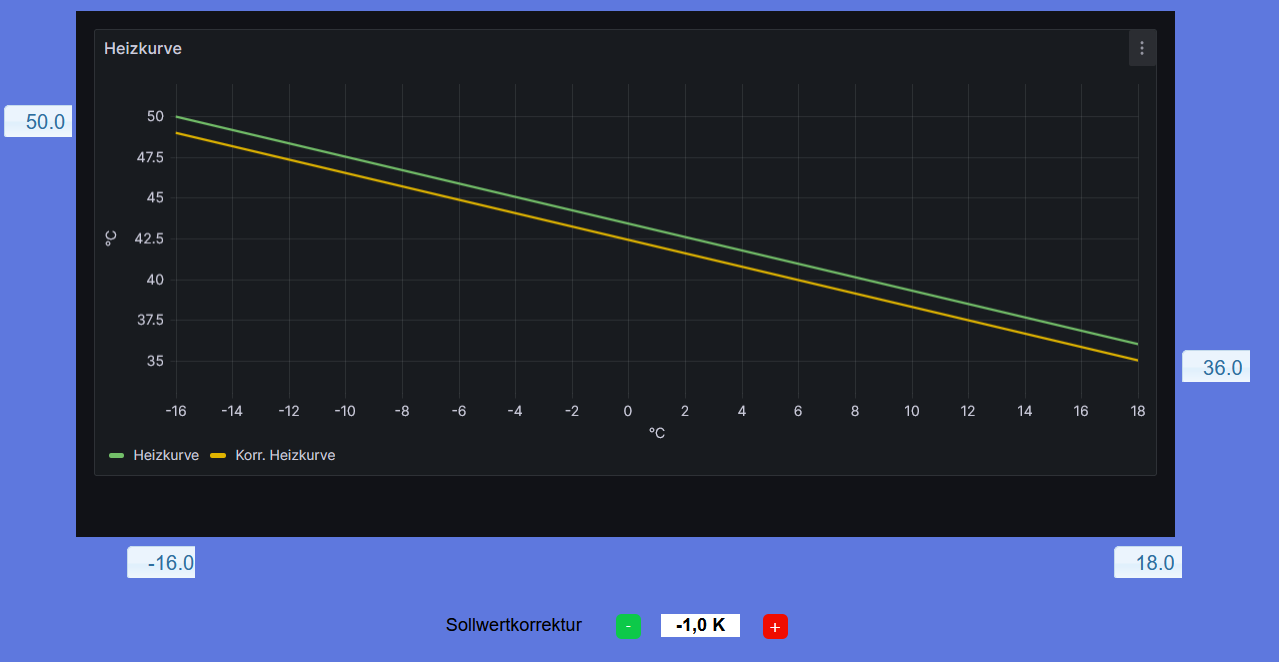
Eigentlich sieht es am Schluss wie im Bild aus und es ist zusätzliche eine senkrechte Linie von der aktuellen Aussentemperatur zur Heizkurve und vom Schnittpunkt eine waagerechte Linie zur Vorlauftemperatur, natürlich von der aktuellen Heizkurve, Sparfaktor in diesem FAll von -1°C berücksichtigt. Also wir haben keine statischen Verhältnisse. Es ist mir klar, es ist eine Spielerei, aber dafür sind Hobbies da.
VG Axel
-
@afi Dies ist natürlich eingebunden in VIS.
-
@ullij said in XY Grafik Grafana, Heizkurve via csv-Datei darstellen:
...und per script die aktuellen Werte schreiben?
Hättest du denn auch noch das Script dazu?
-
@icebear
da sitze ich selbst noch dran...kann nur mit Blockly -
@icebear sagte in XY Grafik Grafana, Heizkurve via csv-Datei darstellen:
@ullij said in XY Grafik Grafana, Heizkurve via csv-Datei darstellen:
...und per script die aktuellen Werte schreiben?
Hättest du denn auch noch das Script dazu?
so geht's bei mir...
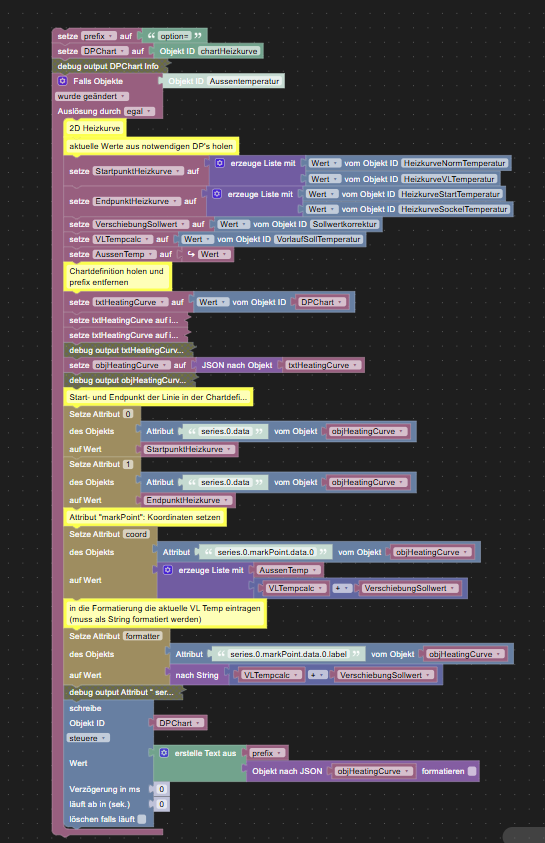
<xml xmlns="https://developers.google.com/blockly/xml"> <variables> <variable id="aNQ%N3JtpASs6*=Vt2O~">prefix</variable> <variable id=".~gZ:Afrap|7=[?dj%gQ">cop3DScatter</variable> <variable id="iJ^@~c7mAz^d#-$pTk@v">DPChart</variable> <variable id="G;11X4@MO}5d2r!iGS*Z">StartpunktHeizkurve</variable> <variable id=":IXs?V34J=WfE!4:t.yI">EndpunktHeizkurve</variable> <variable id="l1aa)l1Ld{S/g)}.!fFD">VerschiebungSollwert</variable> <variable id="p+P)q=JzpP7fNi^=]EC!">VLTempcalc</variable> <variable id=";NaSlSFU?oQwC*kJ`y)T">AussenTemp</variable> <variable id="eOgf3roqON[T)JeZ^]/K">txtHeatingCurve</variable> <variable id="`Zm=ma$;d6Q685p^h])f">objHeatingCurve</variable> </variables> <block type="comment" id="kM9L1|sPO9V*54DSgY-1" x="1063" y="-1262"> <field name="COMMENT">3D chart Wärmepumpe</field> <next> <block type="variables_set" id="|q.^7-B/*}u}O@8T;46/"> <field name="VAR" id=".~gZ:Afrap|7=[?dj%gQ">cop3DScatter</field> <value name="VALUE"> <block type="get_value" id="d(V.nlk6X-Hp*)sDmOC?"> <field name="ATTR">val</field> <field name="OID">0_userdata.0.0000_Visualisierung.Heizung.copnetz</field> </block> </value> </block> </next> </block> <block type="variables_set" id="2e=caFBEhso4NoA($?%{" x="113" y="-1187"> <field name="VAR" id="aNQ%N3JtpASs6*=Vt2O~">prefix</field> <value name="VALUE"> <block type="text" id="k-bB=Co*!2]29hI@PaOM"> <field name="TEXT">option=</field> </block> </value> <next> <block type="variables_set" id=".?gWlKfGQgme-vf|3VWA"> <field name="VAR" id="iJ^@~c7mAz^d#-$pTk@v">DPChart</field> <value name="VALUE"> <block type="field_oid" id="s]hKmrxk%HDUHae8}JQi"> <field name="oid">0_userdata.0.0000_Visualisierung.Heizung.chartHeizkurve</field> </block> </value> <next> <block type="debug" id="o,s^WX]?DaC@3lgqPzcJ" collapsed="true" disabled="true"> <field name="Severity">info</field> <value name="TEXT"> <shadow type="text" id="J$#G5XQ]IWwS-oexQzhM"> <field name="TEXT">test</field> </shadow> <block type="variables_get" id=";3U+PG?GAAdtD`;ay`Mk"> <field name="VAR" id="iJ^@~c7mAz^d#-$pTk@v">DPChart</field> </block> </value> <next> <block type="on_ext" id="pg%{LxXoSgcv,1.QT#vC"> <mutation xmlns="http://www.w3.org/1999/xhtml" items="1"></mutation> <field name="CONDITION">ne</field> <field name="ACK_CONDITION"></field> <value name="OID0"> <shadow type="field_oid" id="hnk?~uhf%9!}n;$.j)v["> <field name="oid">alias.0.1000_Heizung.Klima.AussenTemperatur</field> </shadow> </value> <statement name="STATEMENT"> <block type="comment" id="h%ZZ.LzYN~`cX|c?E4_,"> <field name="COMMENT">2D Heizkurve</field> <next> <block type="comment" id="!gz~#Pcg7Rk#vr~rrWz6"> <field name="COMMENT">aktuelle Werte aus notwendigen DP's holen</field> <next> <block type="variables_set" id="g[O2}5w9,nJSs^=wjJv^"> <field name="VAR" id="G;11X4@MO}5d2r!iGS*Z">StartpunktHeizkurve</field> <value name="VALUE"> <block type="lists_create_with" id="|dQ.=X+HO6arHMO4%(pz"> <mutation items="2"></mutation> <value name="ADD0"> <block type="get_value" id="sr^xL^Y9~b|okZW`j8o0"> <field name="ATTR">val</field> <field name="OID">alias.0.1000_Heizung.WP.HeizkurveNormTemperatur</field> </block> </value> <value name="ADD1"> <block type="get_value" id="qe99dbA5[h]/7_jFeoEj"> <field name="ATTR">val</field> <field name="OID">alias.0.1000_Heizung.WP.HeizkurveVLTemperatur</field> </block> </value> </block> </value> <next> <block type="variables_set" id="-LPu;6OrRq-_6g3V:|ZX"> <field name="VAR" id=":IXs?V34J=WfE!4:t.yI">EndpunktHeizkurve</field> <value name="VALUE"> <block type="lists_create_with" id=")XEG7|5Y~vs$SG.)+,C#"> <mutation items="2"></mutation> <value name="ADD0"> <block type="get_value" id="QzCv|AD}VPUeynlDH9%r"> <field name="ATTR">val</field> <field name="OID">alias.0.1000_Heizung.WP.HeizkurveStartTemperatur</field> </block> </value> <value name="ADD1"> <block type="get_value" id="yZ|y;w7oS0X{!4]Uf)Y!"> <field name="ATTR">val</field> <field name="OID">alias.0.1000_Heizung.WP.HeizkurveSockelTemperatur</field> </block> </value> </block> </value> <next> <block type="variables_set" id="s6`QX?^oUjT_::f)|}WL"> <field name="VAR" id="l1aa)l1Ld{S/g)}.!fFD">VerschiebungSollwert</field> <value name="VALUE"> <block type="get_value" id="NPBbV3z?(r;6,LCZ;Uv$"> <field name="ATTR">val</field> <field name="OID">alias.0.1000_Heizung.Mischer.HeizungSWKorrektur</field> </block> </value> <next> <block type="variables_set" id="np)Y?3K3=~11k%=4o(Gd"> <field name="VAR" id="p+P)q=JzpP7fNi^=]EC!">VLTempcalc</field> <value name="VALUE"> <block type="get_value" id="+oH~5ga/LS0Gh/:dx/!/"> <field name="ATTR">val</field> <field name="OID">0_userdata.0.1000_Heizung.Mischer.VorlaufSollTemperatur</field> </block> </value> <next> <block type="variables_set" id="dwsmV~k`Eks$b;6;sR?T"> <field name="VAR" id=";NaSlSFU?oQwC*kJ`y)T">AussenTemp</field> <value name="VALUE"> <block type="on_source" id="iDizSOyIIX+8pL,^Y)@D"> <field name="ATTR">state.val</field> </block> </value> <next> <block type="comment" id="?2^3U4I/qtFZGUI8U^Aj"> <field name="COMMENT">Chartdefinition holen und &#10;prefix entfernen</field> <next> <block type="variables_set" id="x8{uab-g+TbsaPv`q!SX"> <field name="VAR" id="eOgf3roqON[T)JeZ^]/K">txtHeatingCurve</field> <value name="VALUE"> <block type="get_value_var" id="jUA}^aKGxYX;wf,{KsWU"> <field name="ATTR">val</field> <value name="OID"> <shadow type="field_oid" id="b4+j#S)sV6CX]y`|+fcl"> <field name="oid">ID auswählen</field> </shadow> <block type="variables_get" id="-|l5(#|o%y9sc6{l;~GT"> <field name="VAR" id="iJ^@~c7mAz^d#-$pTk@v">DPChart</field> </block> </value> </block> </value> <next> <block type="variables_set" id="^or**NA(!{OXH4fbOQd]"> <field name="VAR" id="eOgf3roqON[T)JeZ^]/K">txtHeatingCurve</field> <value name="VALUE"> <block type="text_getSubstring" id="|d0:qk8GnXoMYDMfL7YS" inline="false"> <mutation at1="true" at2="false"></mutation> <field name="WHERE1">FROM_START</field> <field name="WHERE2">LAST</field> <value name="STRING"> <block type="variables_get" id="Up4x!5|}(=`Up+~yendL"> <field name="VAR" id="eOgf3roqON[T)JeZ^]/K">txtHeatingCurve</field> </block> </value> <value name="AT1"> <block type="text_indexOf" id="tI9JeIAV+WT+Bdi}wWNI" inline="false"> <field name="END">FIRST</field> <value name="VALUE"> <block type="variables_get" id=";]FI(OCyCn-dwY:P]T{b"> <field name="VAR" id="eOgf3roqON[T)JeZ^]/K">txtHeatingCurve</field> </block> </value> <value name="FIND"> <shadow type="text" id="078XZ@R323]H)Ny{iI@y"> <field name="TEXT">{</field> </shadow> </value> </block> </value> </block> </value> <next> <block type="variables_set" id="P`!h,|!Stj*8jO;s.9co"> <field name="VAR" id="eOgf3roqON[T)JeZ^]/K">txtHeatingCurve</field> <value name="VALUE"> <block type="text_getSubstring" id="IlT}gDf1YFZ^[8J,jb)[" inline="false"> <mutation at1="false" at2="true"></mutation> <field name="WHERE1">FIRST</field> <field name="WHERE2">FROM_START</field> <value name="STRING"> <block type="variables_get" id="7XiwsLHr:XVr8.4N.[x`"> <field name="VAR" id="eOgf3roqON[T)JeZ^]/K">txtHeatingCurve</field> </block> </value> <value name="AT2"> <block type="text_indexOf" id="RY2o2.#TMK!^@4hP(t0t" inline="false"> <field name="END">LAST</field> <value name="VALUE"> <block type="variables_get" id="#%|8t`Y_G%.Vv]CW#l8t"> <field name="VAR" id="eOgf3roqON[T)JeZ^]/K">txtHeatingCurve</field> </block> </value> <value name="FIND"> <shadow type="text" id="_dsEo?fM.!XeO1NajxMX"> <field name="TEXT">}</field> </shadow> </value> </block> </value> </block> </value> <next> <block type="debug" id="6C-INbK2^$oVDT!w4fR0" collapsed="true" disabled="true"> <field name="Severity">info</field> <value name="TEXT"> <shadow type="text" id="p=fy%*m+zjSD.Dx1R.J{"> <field name="TEXT">test</field> </shadow> <block type="variables_get" id="#j,~ntEs1+DH4!!XL_4h"> <field name="VAR" id="eOgf3roqON[T)JeZ^]/K">txtHeatingCurve</field> </block> </value> <next> <block type="variables_set" id=".9jQ?J}qsdtX=C+25yOm"> <field name="VAR" id="`Zm=ma$;d6Q685p^h])f">objHeatingCurve</field> <value name="VALUE"> <block type="convert_json2object" id="g41VEdbrH(Q};GB3{~*1"> <value name="VALUE"> <block type="variables_get" id="zJ;XL.d81;R7~P`g?Xn."> <field name="VAR" id="eOgf3roqON[T)JeZ^]/K">txtHeatingCurve</field> </block> </value> </block> </value> <next> <block type="debug" id="yLW0wH|SF8HhFgO4MrCA" collapsed="true" disabled="true"> <field name="Severity">info</field> <value name="TEXT"> <shadow type="text" id="p=fy%*m+zjSD.Dx1R.J{"> <field name="TEXT">test</field> </shadow> <block type="variables_get" id="7}nU+Y+rV2vQ%gnwZbfp"> <field name="VAR" id="`Zm=ma$;d6Q685p^h])f">objHeatingCurve</field> </block> </value> <next> <block type="comment" id="88MHN5WUvx,A_*I4dW7%"> <field name="COMMENT">Start- und Endpunkt der Linie in der Chartdefinition setzen</field> <next> <block type="object_set_attr" id="h?]00:^emb9NX%0N:o/:"> <field name="ATTR">0</field> <value name="OBJECT"> <block type="get_attr" id="tl2%$wc4WyN#VauN-fPt"> <value name="PATH"> <shadow type="text" id="qg)u{1U5,y[EpgbM}6?9"> <field name="TEXT">series.0.data</field> </shadow> </value> <value name="OBJECT"> <shadow type="get_object" id="x73-Xi{Jnr~ww{aUKc_-"> <field name="OID">Object ID</field> </shadow> <block type="variables_get" id="dh5=yARY7$FyI(836uZj"> <field name="VAR" id="`Zm=ma$;d6Q685p^h])f">objHeatingCurve</field> </block> </value> </block> </value> <value name="VALUE"> <shadow type="text" id="sQCSglM$u41EB(_usL9@"> <field name="TEXT">value</field> </shadow> <block type="variables_get" id="Q$_r~b^t}`L@0WF2d~(u"> <field name="VAR" id="G;11X4@MO}5d2r!iGS*Z">StartpunktHeizkurve</field> </block> </value> <next> <block type="object_set_attr" id="H2wY{19PHb0J:]vnV[b$"> <field name="ATTR">1</field> <value name="OBJECT"> <block type="get_attr" id="-:zD].vR0h6^(mOTAc2f"> <value name="PATH"> <shadow type="text" id="u*:F;IC1aCIM9;-1]Yj6"> <field name="TEXT">series.0.data</field> </shadow> </value> <value name="OBJECT"> <shadow type="get_object" id="x73-Xi{Jnr~ww{aUKc_-"> <field name="OID">Object ID</field> </shadow> <block type="variables_get" id="NS-_.;+V5PJ/NXl%R^JF"> <field name="VAR" id="`Zm=ma$;d6Q685p^h])f">objHeatingCurve</field> </block> </value> </block> </value> <value name="VALUE"> <shadow type="text" id="sQCSglM$u41EB(_usL9@"> <field name="TEXT">value</field> </shadow> <block type="variables_get" id="k9DQ`7:8iyC,pTy`#XN?"> <field name="VAR" id=":IXs?V34J=WfE!4:t.yI">EndpunktHeizkurve</field> </block> </value> <next> <block type="comment" id="?PqE?tfaW^nJ#wf!DJQ;"> <field name="COMMENT">Attribut "markPoint": Koordinaten setzen</field> <next> <block type="object_set_attr" id="=hBa~aMArI4H`O(jeL5Z"> <field name="ATTR">coord</field> <value name="OBJECT"> <block type="get_attr" id="P!J_B7oli4%!eEF@hD7M"> <value name="PATH"> <shadow type="text" id="8jBb;:6P]f1R?X%U(r%S"> <field name="TEXT">series.0.markPoint.data.0</field> </shadow> </value> <value name="OBJECT"> <shadow type="get_object" id="x73-Xi{Jnr~ww{aUKc_-"> <field name="OID">Object ID</field> </shadow> <block type="variables_get" id="1Pr]H}?Znev7SqJj9#~%"> <field name="VAR" id="`Zm=ma$;d6Q685p^h])f">objHeatingCurve</field> </block> </value> </block> </value> <value name="VALUE"> <shadow type="text" id="sQCSglM$u41EB(_usL9@"> <field name="TEXT">value</field> </shadow> <block type="lists_create_with" id="|:d7x%y0lv{3_(r3l*AE"> <mutation items="2"></mutation> <value name="ADD0"> <block type="variables_get" id="JcY`WX$EEMP23IuD{:K3"> <field name="VAR" id=";NaSlSFU?oQwC*kJ`y)T">AussenTemp</field> </block> </value> <value name="ADD1"> <block type="math_arithmetic" id="S-)$XxP|wDV86!d5bVof"> <field name="OP">ADD</field> <value name="A"> <shadow type="math_number" id="L(+Mh`S)0AlvMoaS320;"> <field name="NUM">1</field> </shadow> <block type="variables_get" id="jK.R|N$D2Wz7D4sFG.Sm"> <field name="VAR" id="p+P)q=JzpP7fNi^=]EC!">VLTempcalc</field> </block> </value> <value name="B"> <shadow type="math_number" id="#YKpotA.7m!c{_)?:0|g"> <field name="NUM">1</field> </shadow> <block type="variables_get" id="kGa1naz`iuszE$P%)9|O"> <field name="VAR" id="l1aa)l1Ld{S/g)}.!fFD">VerschiebungSollwert</field> </block> </value> </block> </value> </block> </value> <next> <block type="comment" id="p8|RH$RFpu0;ffWs_Ty,"> <field name="COMMENT">in die Formatierung die aktuelle VL Temp eintragen&#10;(muss als String formatiert werden)</field> <next> <block type="object_set_attr" id=".md_A5Z+gf5UNcU[HS2+"> <field name="ATTR">formatter</field> <value name="OBJECT"> <block type="get_attr" id="g.9sDX}vgs]WcDHU6ew."> <value name="PATH"> <shadow type="text" id="w[XD%xO=m=?xY.}qD9pr"> <field name="TEXT">series.0.markPoint.data.0.label</field> </shadow> </value> <value name="OBJECT"> <shadow type="get_object" id="x73-Xi{Jnr~ww{aUKc_-"> <field name="OID">Object ID</field> </shadow> <block type="variables_get" id="#[PRlfy-CySCdhNozf:="> <field name="VAR" id="`Zm=ma$;d6Q685p^h])f">objHeatingCurve</field> </block> </value> </block> </value> <value name="VALUE"> <shadow type="text" id="sQCSglM$u41EB(_usL9@"> <field name="TEXT">value</field> </shadow> <block type="convert_tostring" id="s3V4d!en7,tbow;%li8%"> <value name="VALUE"> <block type="math_arithmetic" id="c[PfZZLLAHp!6J4k,#o,"> <field name="OP">ADD</field> <value name="A"> <shadow type="math_number" id="L(+Mh`S)0AlvMoaS320;"> <field name="NUM">1</field> </shadow> <block type="variables_get" id="2@VY=Z/#)1]jC/#Vijwv"> <field name="VAR" id="p+P)q=JzpP7fNi^=]EC!">VLTempcalc</field> </block> </value> <value name="B"> <shadow type="math_number" id="#YKpotA.7m!c{_)?:0|g"> <field name="NUM">1</field> </shadow> <block type="variables_get" id="boU-/oYe?zCJ.H}vM}8$"> <field name="VAR" id="l1aa)l1Ld{S/g)}.!fFD">VerschiebungSollwert</field> </block> </value> </block> </value> </block> </value> <next> <block type="debug" id="EMv!5:QpOt*0lH`KLngN" collapsed="true" disabled="true"> <field name="Severity">info</field> <value name="TEXT"> <shadow type="text" id="6U:~OP#%E_C{xgkm7!B#"> <field name="TEXT">test</field> </shadow> <block type="get_attr" id="OX5C/mv$gN-}k}d6~_Y)"> <value name="PATH"> <shadow type="text" id="9t-7+I!!TeW=()F$pg7,"> <field name="TEXT">series.0.markPoint.data.0.label</field> </shadow> </value> <value name="OBJECT"> <shadow type="get_object" id="x73-Xi{Jnr~ww{aUKc_-"> <field name="OID">Object ID</field> </shadow> <block type="variables_get" id="B|J{$eFQ}Kn+m6rp6H{o"> <field name="VAR" id="`Zm=ma$;d6Q685p^h])f">objHeatingCurve</field> </block> </value> </block> </value> <next> <block type="control_ex" id="o5s93kvC4L0WhA1WMr8x"> <field name="TYPE">false</field> <field name="CLEAR_RUNNING">FALSE</field> <value name="OID"> <shadow type="field_oid" id="`gyj4_;B^#Je}xA44c5S"> <field name="oid">0_userdata.0.0000_Visualisierung.Heizung.chartHeizkurve</field> </shadow> <block type="variables_get" id="Sh}$@~Qg$-YTa3{|g3V!"> <field name="VAR" id="iJ^@~c7mAz^d#-$pTk@v">DPChart</field> </block> </value> <value name="VALUE"> <shadow type="logic_boolean" id="U!XF=Pk{.1eT8ROljCIi"> <field name="BOOL">TRUE</field> </shadow> <block type="text_join" id="V2FHN/m1@Rh:]**W3Ch7"> <mutation items="2"></mutation> <value name="ADD0"> <block type="variables_get" id="+0#[ZeN4bya*U0Q;`ygr"> <field name="VAR" id="aNQ%N3JtpASs6*=Vt2O~">prefix</field> </block> </value> <value name="ADD1"> <block type="convert_object2json" id="Xy+d(hPV7kcgFS(v.l@:"> <field name="PRETTIFY">FALSE</field> <value name="VALUE"> <block type="variables_get" id="jRI4N1*=z%r}Xd`5Mh:#"> <field name="VAR" id="`Zm=ma$;d6Q685p^h])f">objHeatingCurve</field> </block> </value> </block> </value> </block> </value> <value name="DELAY_MS"> <shadow type="math_number" id="?uM8nDEK-(/*GVlH4pHx"> <field name="NUM">0</field> </shadow> </value> <value name="EXPIRE"> <shadow type="math_number" id="v!NY_kcVWzB^nWEShSVR"> <field name="NUM">0</field> </shadow> </value> </block> </next> </block> </next> </block> </next> </block> </next> </block> </next> </block> </next> </block> </next> </block> </next> </block> </next> </block> </next> </block> </next> </block> </next> </block> </next> </block> </next> </block> </next> </block> </next> </block> </next> </block> </next> </block> </next> </block> </next> </block> </next> </block> </next> </block> </statement> </block> </next> </block> </next> </block> </next> </block> </xml> -
@ullij Hi Ulli, herzlichen Dank, so ungefähr habe ich das Blockly verstanden.
0_userdata.0.0000_Visualisierung.Heizung.copnetz; 0_userdata.0.0000_Visualisierung.Heizung.chartHeizkurve; Series.0.data und series.0.markPoint.data.0 verstehe ich leider nicht??
VG Axel
-
@afi sagte in XY Grafik Grafana, Heizkurve via csv-Datei darstellen:
Eigentlich sieht es am Schluss wie im Bild aus und es ist zusätzliche eine senkrechte Linie von der aktuellen Aussentemperatur zur Heizkurve und vom Schnittpunkt eine waagerechte Linie zur Vorlauftemperatur, natürlich von der aktuellen Heizkurve, Sparfaktor in diesem FAll von -1°C berücksichtigt
ist hier auch so. Der Pin kennezichnet den aktuellen Betriebspunkt und im Skript ist die Sollwertverschiebung (bei mir =0) berücksichtigt...man könnte dafür noch eine 2. Linie einbauen
0_userdata.0.0000_Visualisierung.Heizung.chartHeizkurve;
ist der Datenpunkt in dem das Chart gespeichert ist (Json).
{"tooltip":{"trigger":"axis"},"xAxis":{"type":"value","name":"Aussen °C","nameLocation":"middle","nameGap":30,"nameTextStyle":{"fontSize":14,"fontWeight":"bold","color":"gray"},"axisLine":{"lineStyle":{"width":2,"color":"gray"}},"splitLine":{"lineStyle":{"type":"dashed","color":"#ccc"}},"axisLabel":{"fontSize":12,"fontWeight":"bold"}},"yAxis":{"type":"value","name":"Vorlauf °C","nameLocation":"middle","nameRotate":90,"nameGap":30,"nameTextStyle":{"fontSize":14,"fontWeight":"bold","color":"gray"},"axisLine":{"lineStyle":{"width":2,"color":"gray"}},"splitLine":{"lineStyle":{"type":"dashed","color":"#ccc"}},"axisLabel":{"fontSize":12,"fontWeight":"bold"}},"series":[{"name":"Linie","type":"line","data":[[-10,58],[20,22]],"markPoint":{"data":[{"coord":[10.5,34],"name":"Pin","symbol":"pin","symbolSize":50,"itemStyle":{"color":"blue"},"label":{"show":true,"formatter":"34","position":"inside","color":"white","fontSize":14}}]}}],"lineStyle":{"color":"blue"},"backgroundColor":"transparent"}"series.0.data", sind die beiden Punkte für die Linie
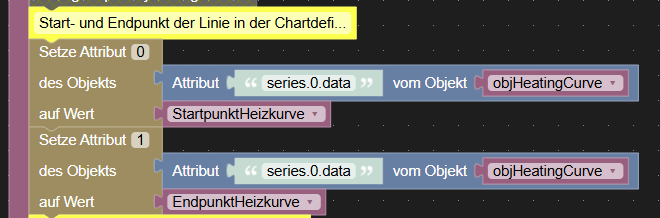
"series.0.markPoint.data.0" und "series.0.markPoint.data.0.label" die Eigenschaften der Markierung
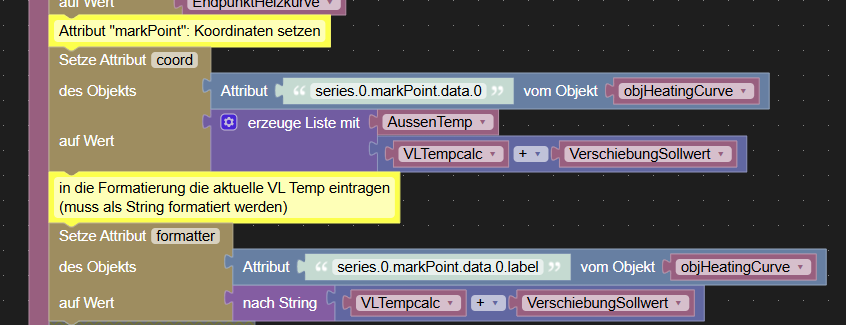
also die Attribute des Json als Array, die aktuelle Werte benötigen. Der Rest vom Diagramm ist statisch, aber natürlich anpassbar -> Json struktur und Inhalt ansehen.
Anzeige in der Vis/Vis-2 mit einem HTML basic Iframe
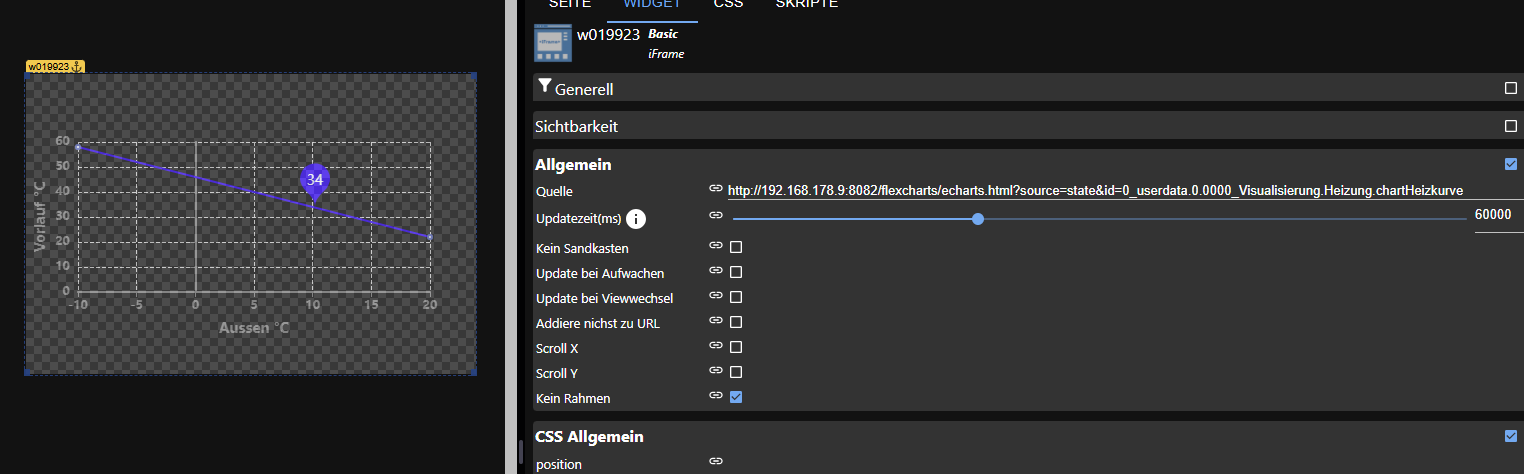
Näheres dazu siehe Adapter
FlexchartsVG
Ulli -
@ullij Hi Ulli, vielen Dank, ich glaube ich habe es verstanden. VG Axel
