eCharts Y-axis scaling
-
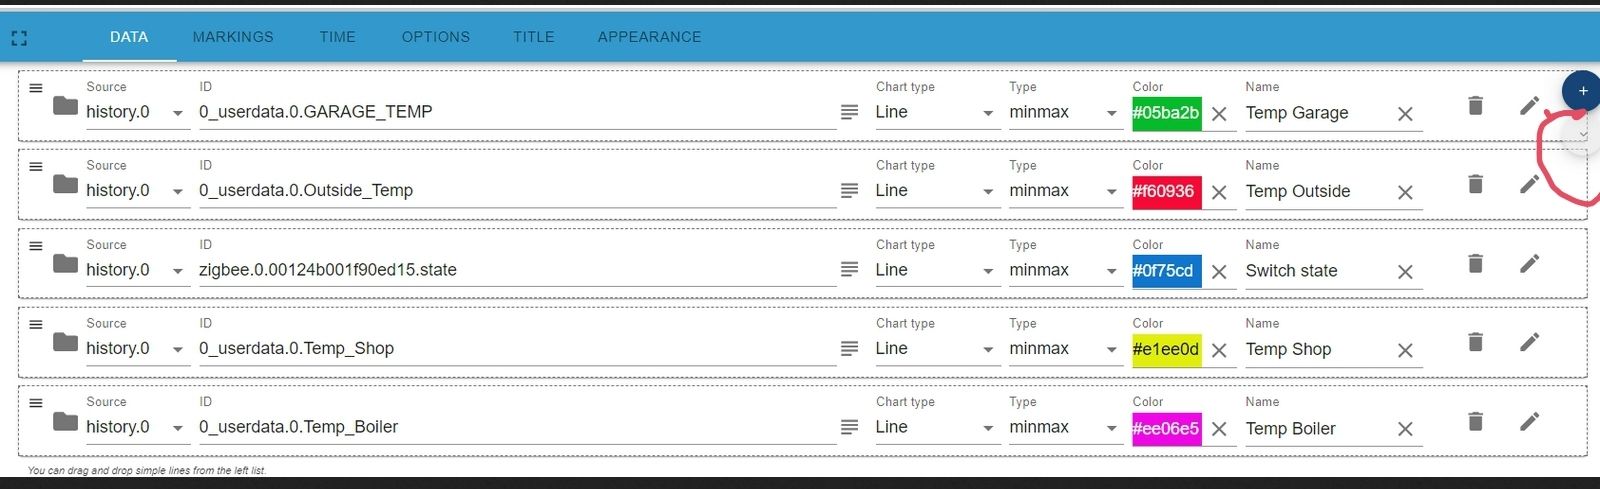
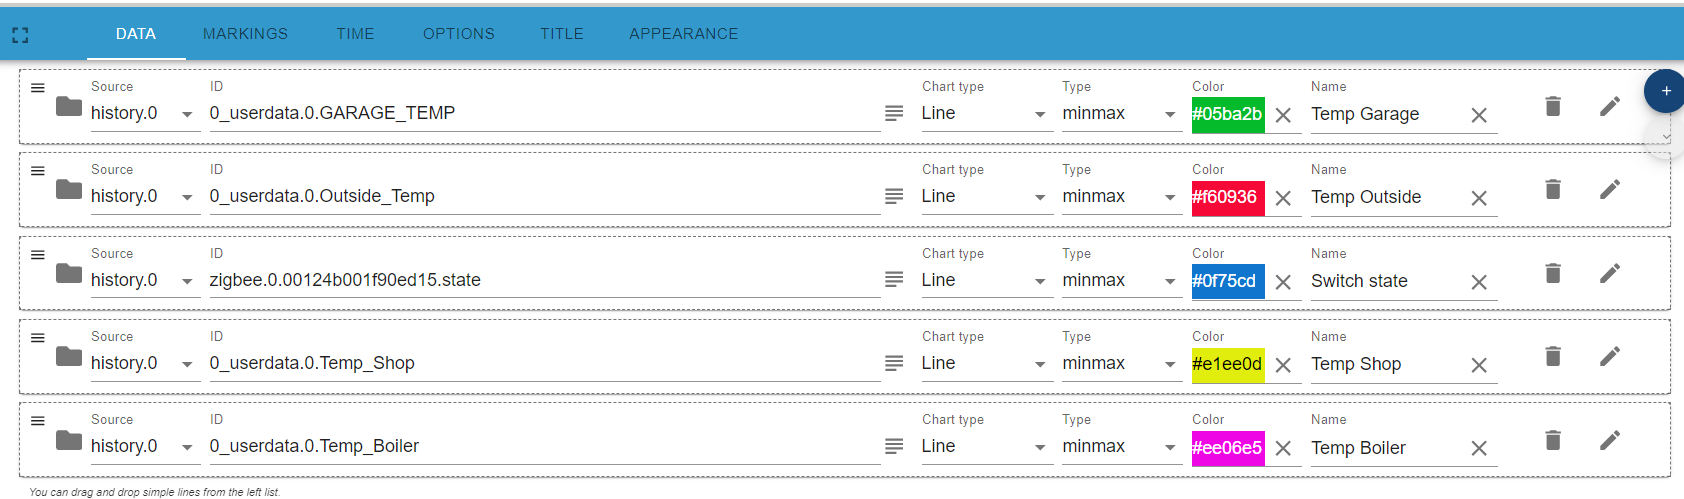
I would like to display multiple temperature data on one eChart screen with same Y-Axis scaling for all, but not able to do it. Each data set is scaled independently. I have all data sets as minmax.
-
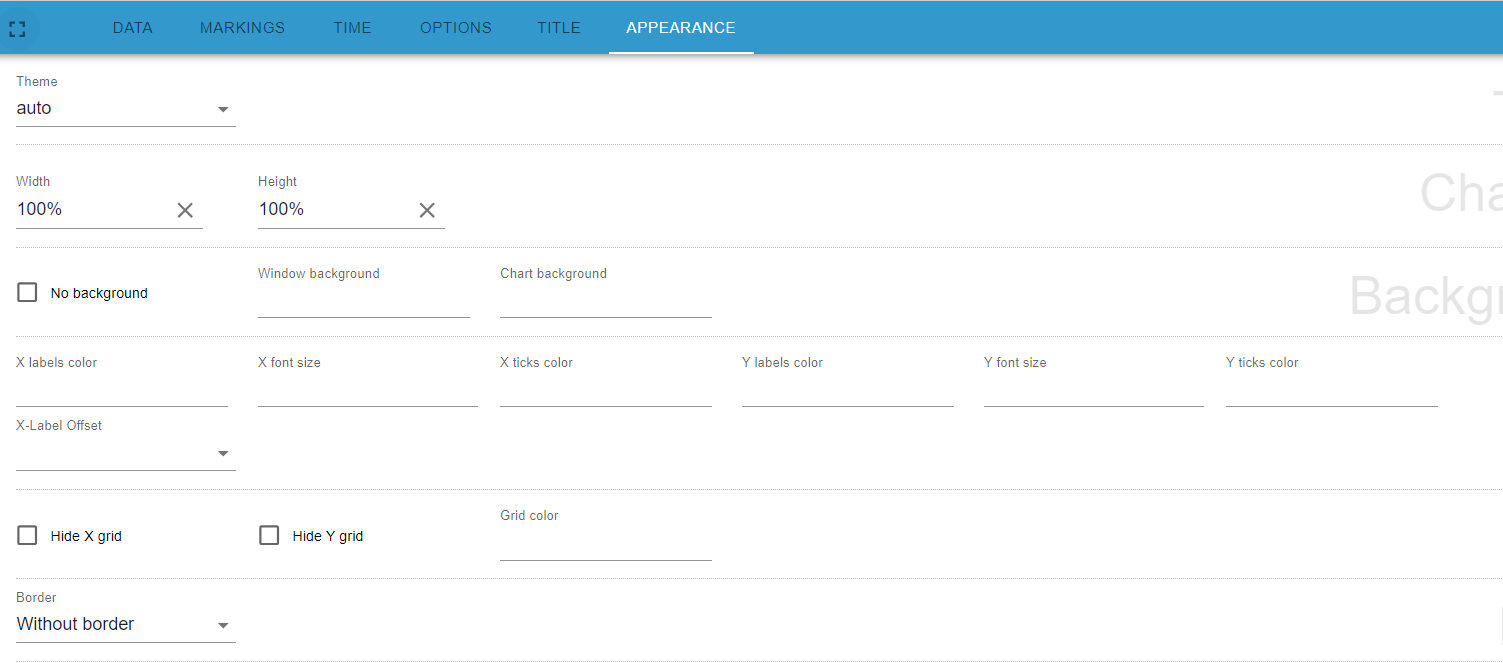
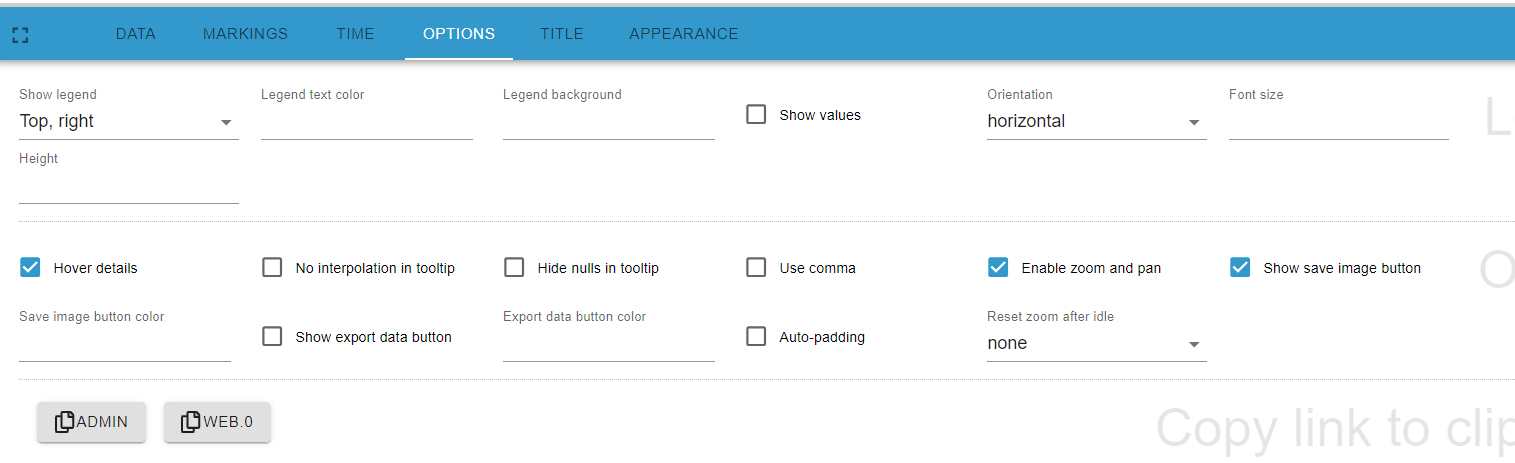
@ap2017 please show the configuration
there is a field for using separate or a common axis
I don't have eCharts installed -
-
@ap2017 open here