

eCharts Y-axis scaling
-
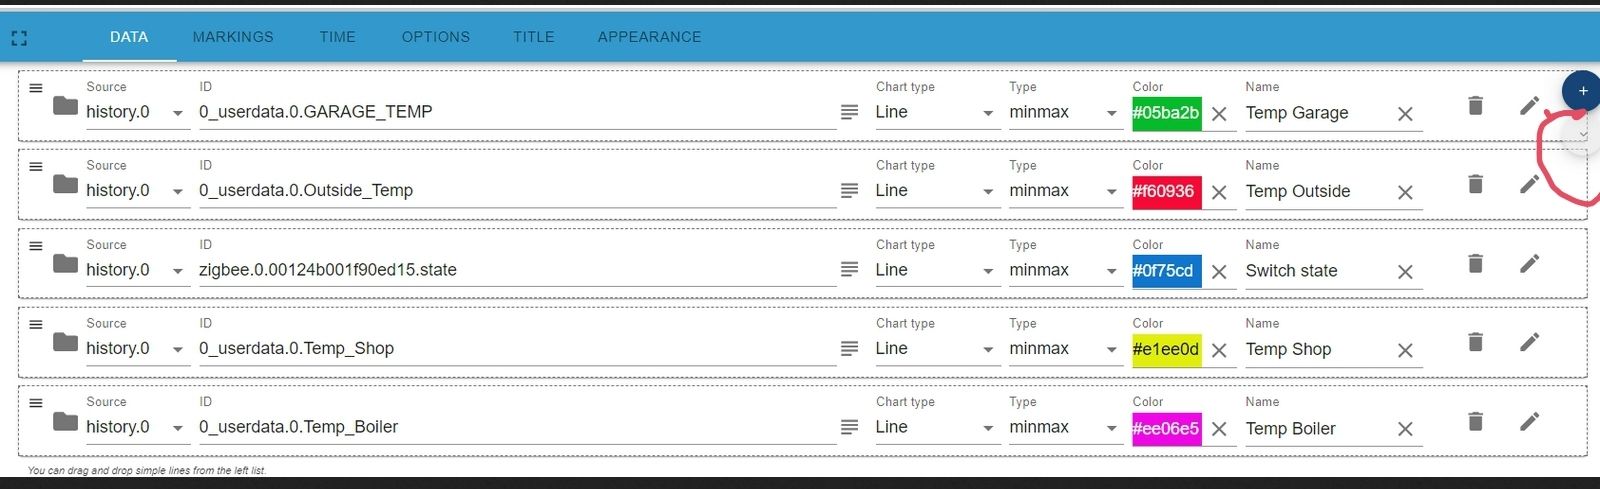
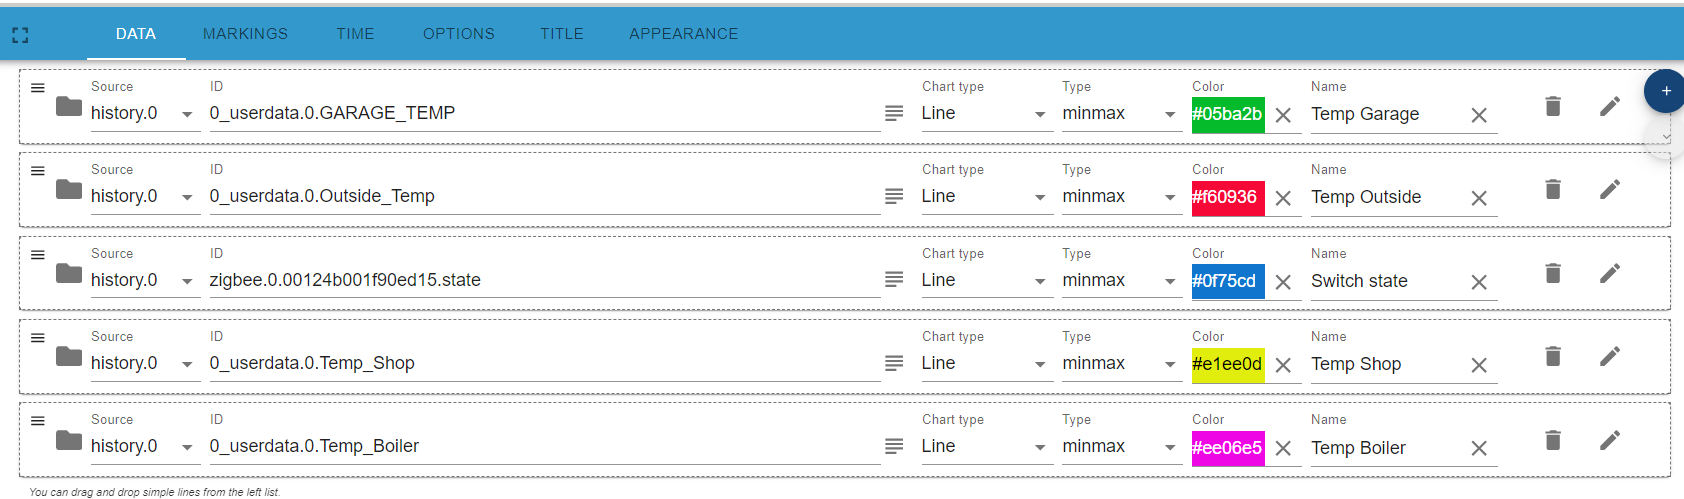
I would like to display multiple temperature data on one eChart screen with same Y-Axis scaling for all, but not able to do it. Each data set is scaled independently. I have all data sets as minmax.
@ap2017 please show the configuration
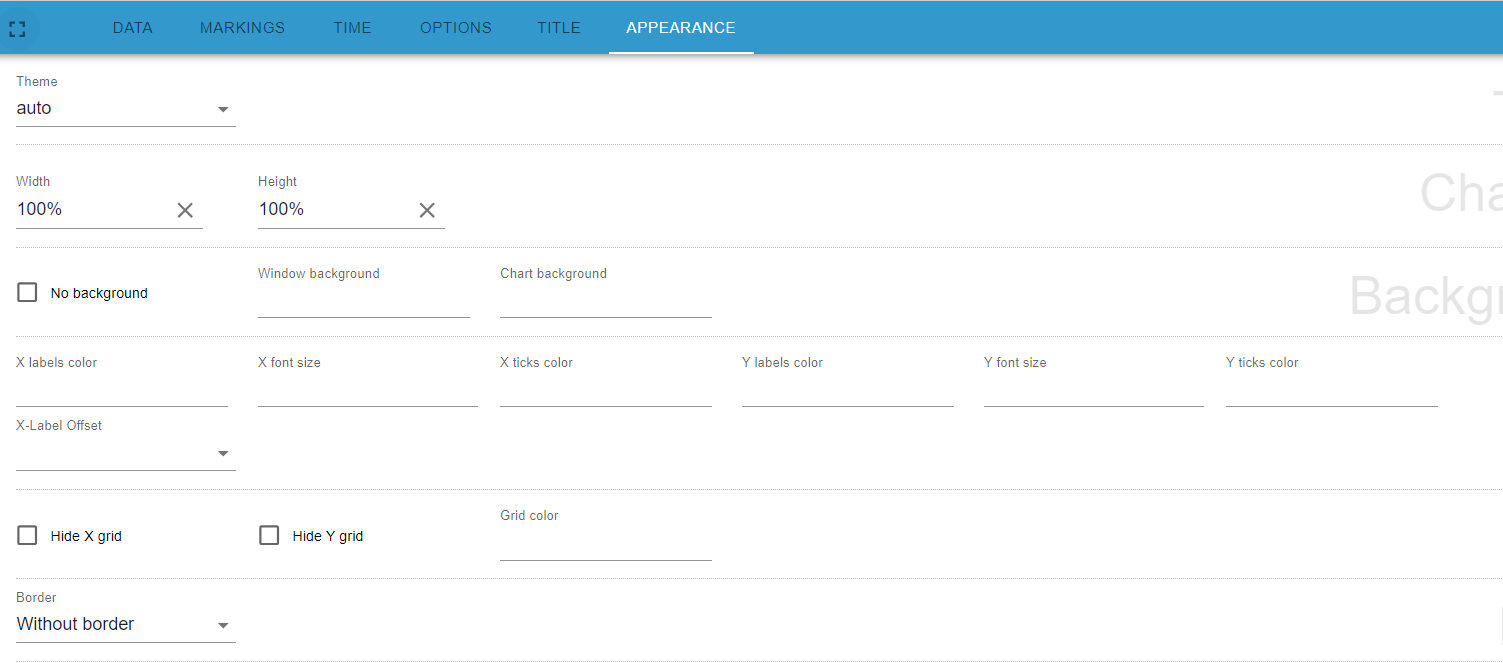
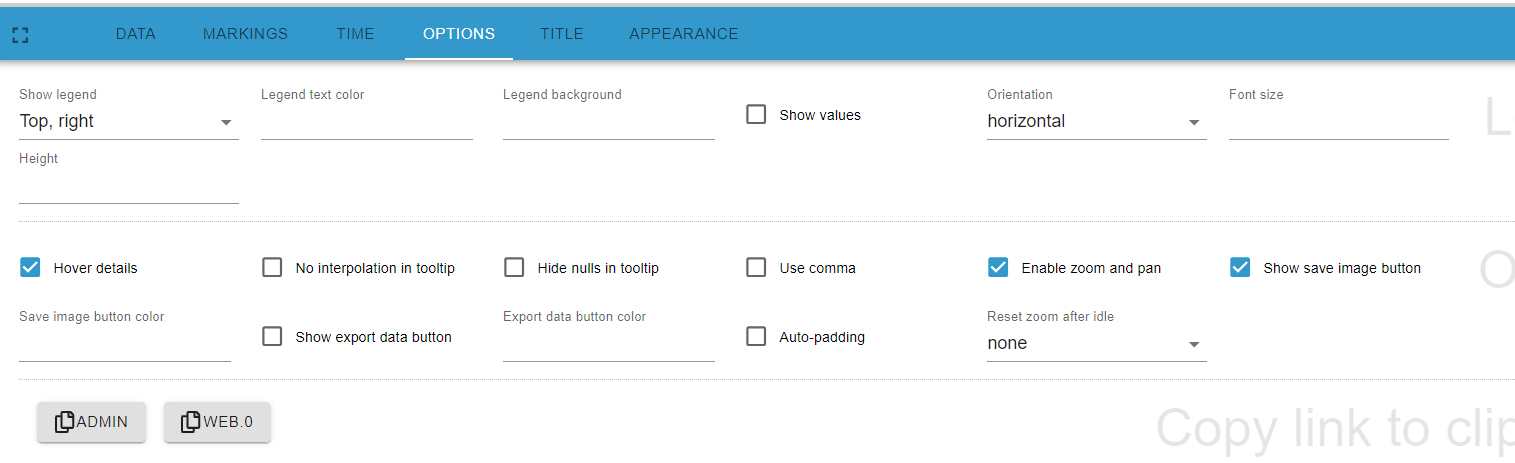
there is a field for using separate or a common axis
I don't have eCharts installed -
@ap2017 please show the configuration
there is a field for using separate or a common axis
I don't have eCharts installed -
@ap2017 open here
Hey! Du scheinst an dieser Unterhaltung interessiert zu sein, hast aber noch kein Konto.
Hast du es satt, bei jedem Besuch durch die gleichen Beiträge zu scrollen? Wenn du dich für ein Konto anmeldest, kommst du immer genau dorthin zurück, wo du zuvor warst, und kannst dich über neue Antworten benachrichtigen lassen (entweder per E-Mail oder Push-Benachrichtigung). Du kannst auch Lesezeichen speichern und Beiträge positiv bewerten, um anderen Community-Mitgliedern deine Wertschätzung zu zeigen.
Mit deinem Input könnte dieser Beitrag noch besser werden 💗
Registrieren AnmeldenSupport us
469
Online33.0k
Benutzer83.5k
Themen1.3m
Beiträge